
Implications of a Fed rate cut near a record high

Key points:
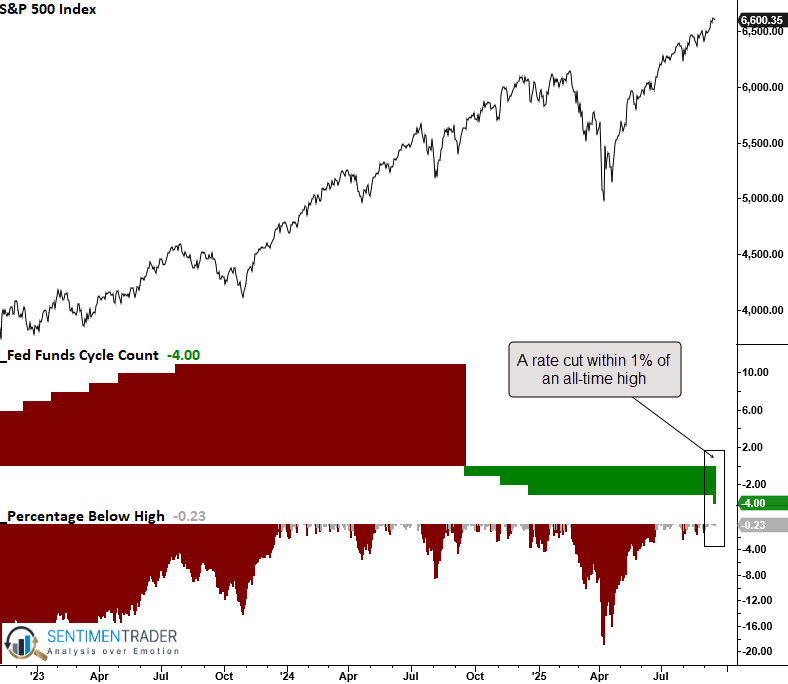
- The Federal Reserve cut its target rate with the S&P 500 within 1% of a record high
- Similar interest rate cuts suggest equities rally, but it wasn't a smooth ride
- The dollar dipped, boosting gold, and small caps rallied but couldn't hold their gains
A non-recessionary rate cut
On Wednesday, the Federal Reserve cut its target interest rate while the S&P 500 traded within 1% of its record high. The proximity of the market to all-time highs suggests that this rate cut is likely non-recessionary in nature, aimed more at supporting continued economic growth rather than countering a downturn.
Non-recessionary cuts typically have a more constructive impact on equities, as they can extend bull markets and boost investor confidence, in contrast to recessionary cuts, which often coincide with market weakness and signal broader economic stress. This distinction is critical, as the market's reaction to the Fed's policy move will likely reflect optimism about sustained growth rather than defensive positioning for an economic contraction.
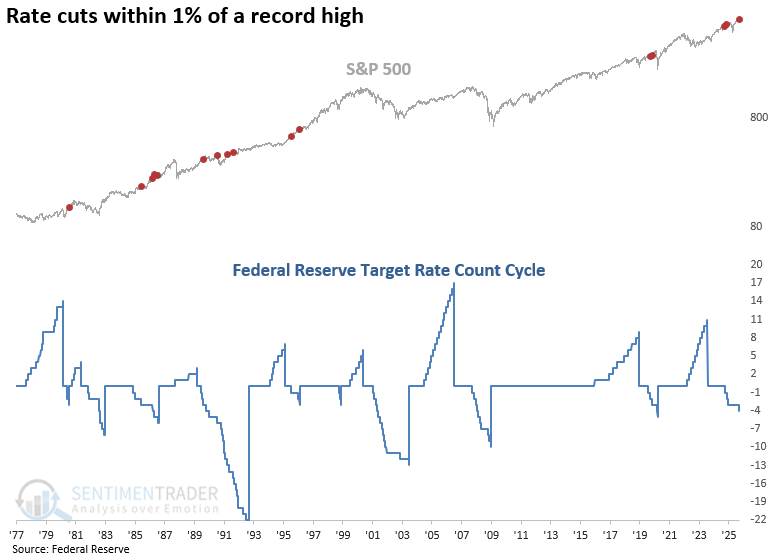
In every case, interest rate cuts near a record high in stocks occurred within the context of an easing cycle, which is defined as three or more consecutive cuts without any intervening rate hikes.
A rally over the next year
Whenever the Federal Reserve lowered its target rate and the S&P 500 traded less than 1% shy of a record high, the world's most benchmarked advanced over the subsequent year every time. However, the variability in the win rate suggests it wasn't a smooth ascent. Furthermore, the sixth month mark underperformed random returns and win rates by a meaningful amount, as indicated by the unfavorable z-score.
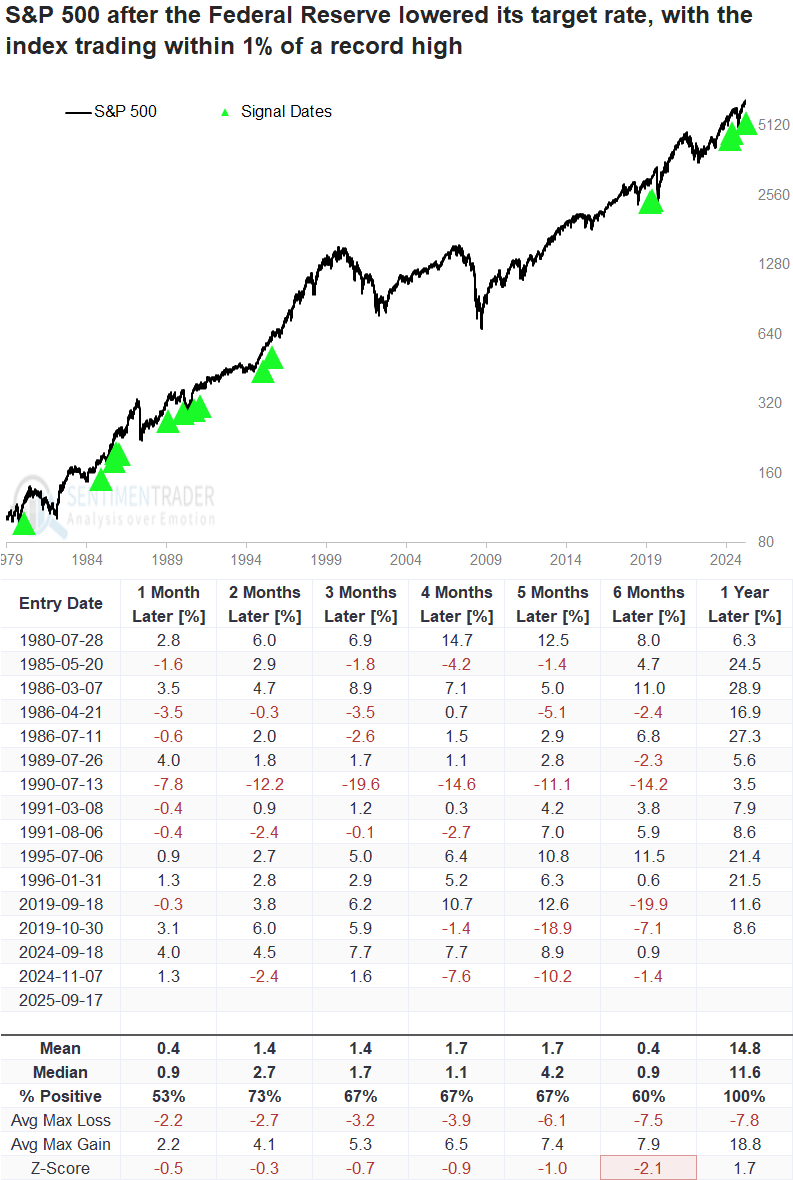
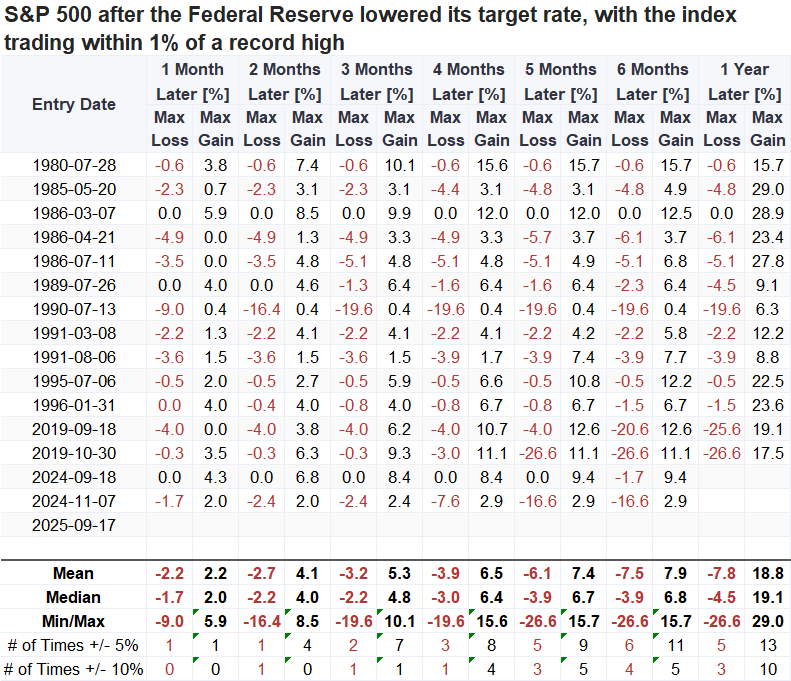
Over the course of the following year, the S&P 500 fell by more than 10% three times. Still, it gained over 10% on ten separate occasions, suggesting a favorable risk/reward dynamic.
Since the 2019 precedents coincided with COVID, 1990 stands out as the only instance of a significant drawdown that wasn't the result of an unusual, government-engineered shutdown.
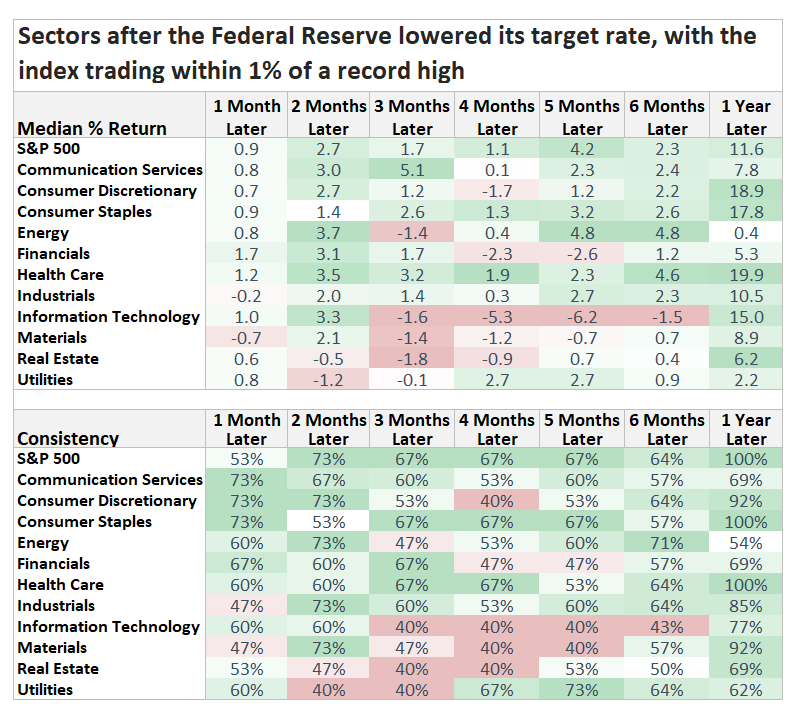
Other groups
Although technology outperformed the S&P 500 a year later, three- to six-month returns and win rates were dismal. Most of these historical precedents occurred between 1985 and 1991, a period when the sector largely moved sideways. Since 1995, however, tech has consistently been the top performer.
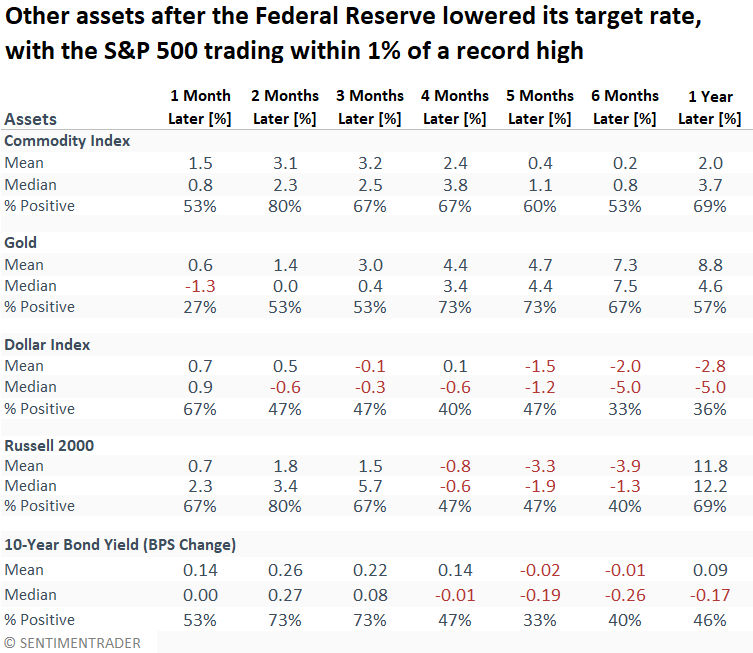
Looking at how the signals play out across asset classes, the dollar tends to weaken, which helps gold in the medium run. Small-caps usually pop right after the cut, but the gains fade pretty quickly. As for the 10-year yield, it tends to rise for three months before drifting slightly lower.
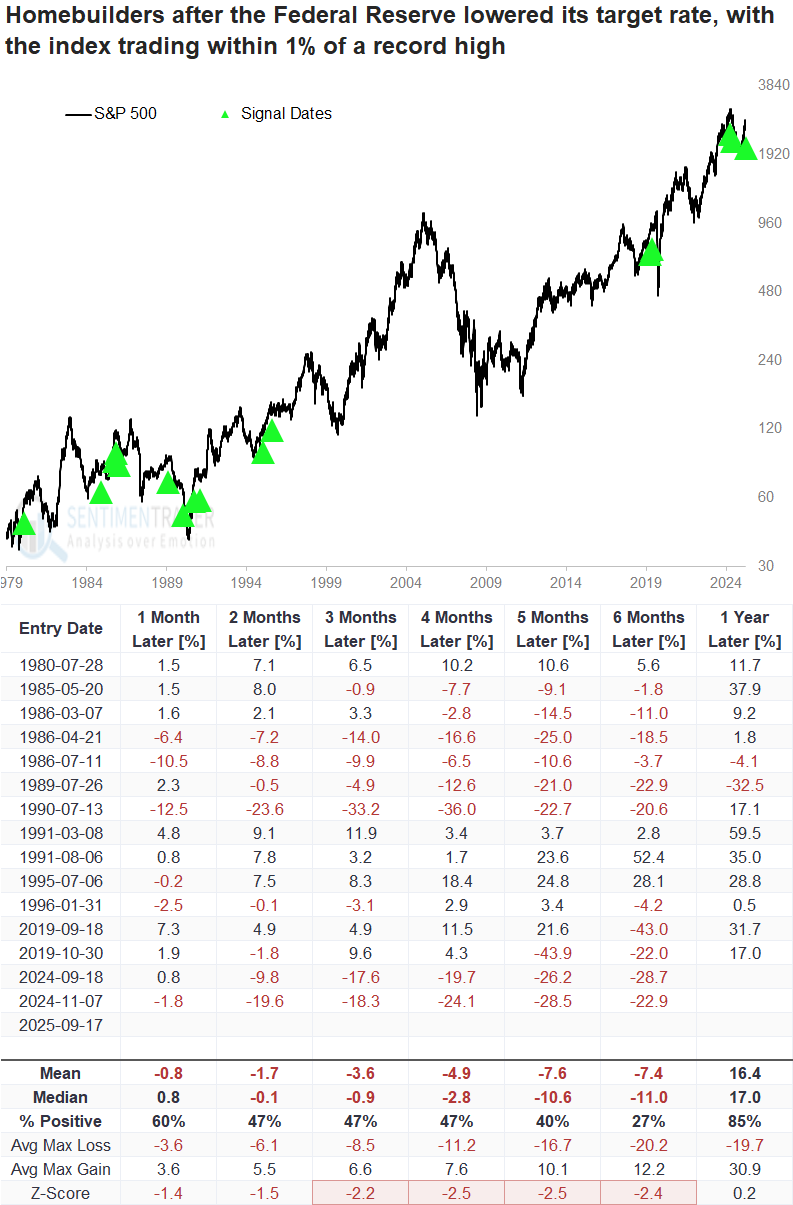
With the increase in the 10-year yield shown above, it's no surprise that homebuilders faced headwinds in the following six months.
What the research tells us...
On Wednesday, the Federal Reserve announced an interest rate cut with the S&P 500 trading just shy of an all-time high. After similar scenarios, the S&P 500 advanced without exception over the following year, though the trajectory was rarely linear.
Rate cuts of this nature tend to weaken the U.S. dollar, providing a tailwind for gold. At the same time, because these moves are typically non-recessionary, Treasury yields-particularly the 10-year-have historically risen in the aftermath for a few months as investors recalibrated growth and inflation expectations. This dynamic has pressured interest-rate-sensitive groups, such as homebuilders and, ultimately, small-cap stocks.