
If you just have to buy and hold the Nasdaq 100...

Key Points
- The Nasdaq 100 Index (a capitalization-weighted index) has been a stellar performer over the past several decades
- Many investors are unaware that there is an equal-weighted version of the index
- A simple switching strategy between the two may offer the potential for greater long-term returns
The Nasdaq 100 Equal Weighted Index
The standard Nasdaq 100 Index is "capitalization-weighted," i.e., each stock is weighted based on "stock price times number of shares outstanding." A Nasdaq 100 Equal Weight Index also exists, which gives equal weight to all 500 stocks in the index. In this manner, the largest companies do not dominate the index performance. The First Trust NASDAQ-100 Equal Weighted Index Fund ETF (ticker QQEW) tracks the Nasdaq 100 Equal Weight Index and has monthly total return data back to May 2006. So, we will start our test there.
Nasdaq 100 Index versus NASDAQ 100 Equal-Weighted Index: Buy-and-Hold
For testing, we will use the Invesco QQQ Trust ETF (ticker QQQ) to represent the Nasdaq 100 Index and the First Trust NASDAQ-100 Equal Weighted Index Fund ETF (ticker QQEW) to represent the Nasdaq 100 Equal Weight Index.
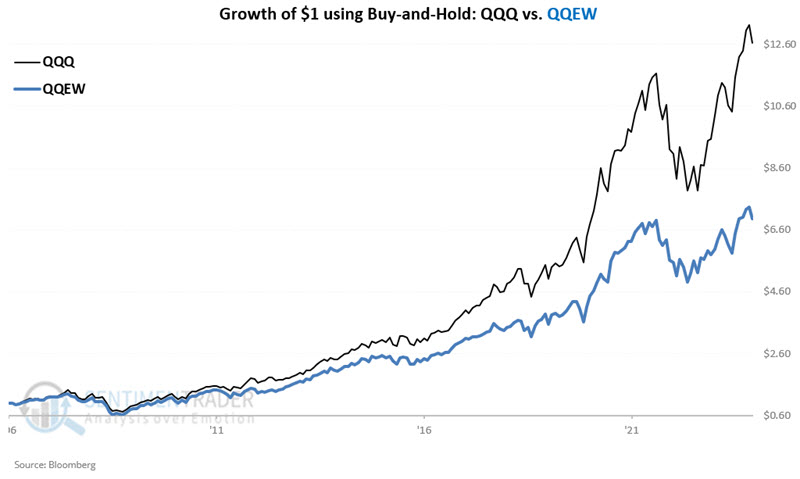
The chart below displays the growth of $1 invested on a buy-and-hold basis in both QQQ and QQEW starting in May 2006.
The cumulative returns for buy-and-hold appear in the table below.
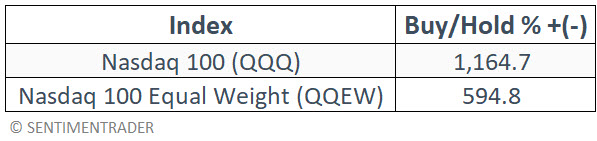
On a buy-and-hold basis, the cap-weighted index has significantly outperformed the equal-weighted index (1.96-to-1) since 2006. So, at first blush, defining the cap-weighted index as the best choice for an always fully invested approach appears pretty straightforward. But let's take a closer look at performance results throughout the year.
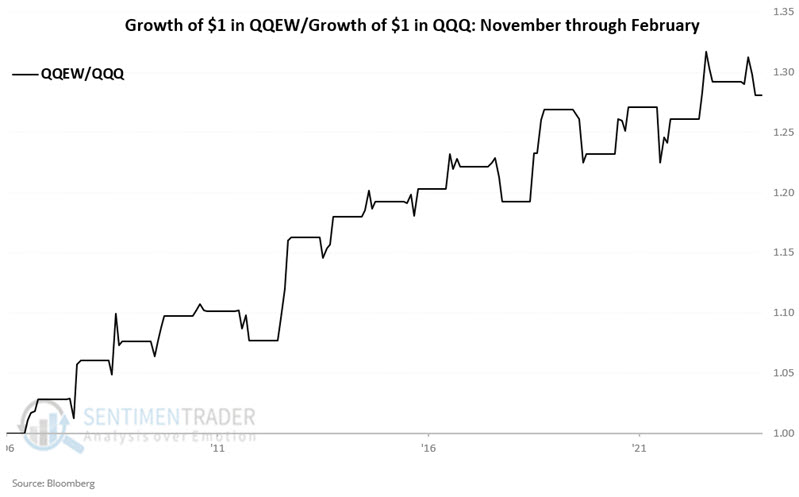
Nasdaq 100 Index versus NASDAQ 100 Equal-Weighted Index: November through February
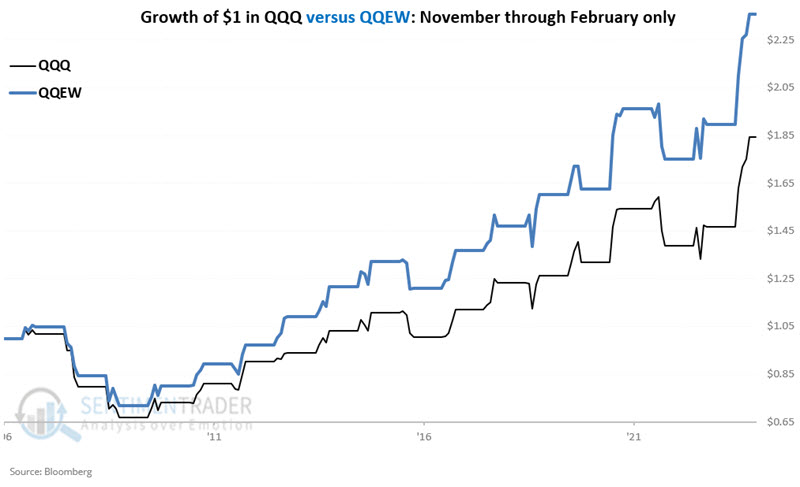
The chart below displays the growth of $1 invested on a buy-and-hold basis in both QQQ and QQEW only during the months of November through February starting in May 2006.
The cumulative returns for holding on during the months of November through February appear in the table below.
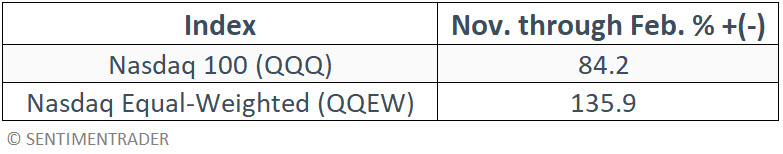
If held only from the end of October through the end of February, the equal-weighted index (QQEW) outperformed the cap-weighted index (QQQ) by a factor of 1.61-to-1. Also interesting to note is the consistency with which QQEW outperformed during these months, as reflected in the chart below, which divides the growth of $1 in QQEW by the growth of $1 in QQQ from November through February.
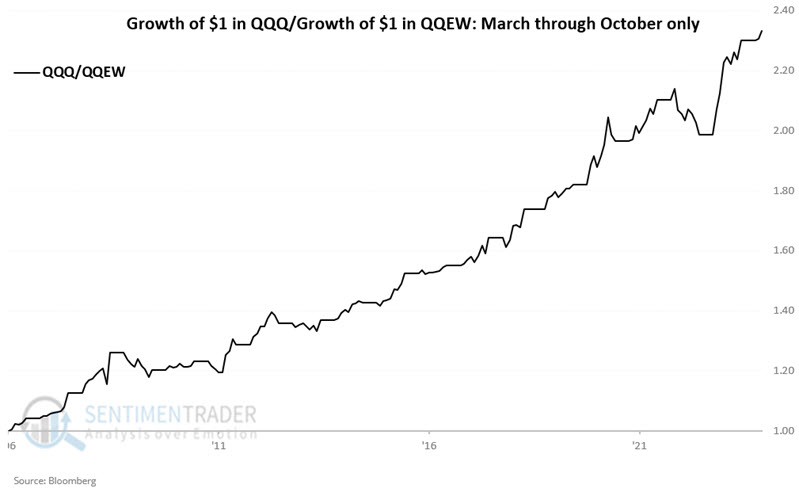
Nasdaq 100 Index versus NASDAQ 100 Equal-Weighted Index: March through October
The chart below displays the growth of $1 invested on a buy-and-hold basis in both QQQ and QQEW only from March through October starting in 2006.
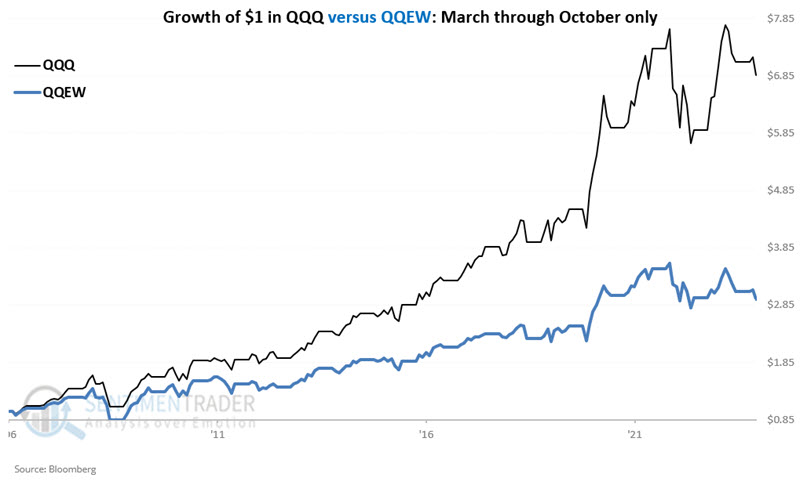
The cumulative returns for holding on during the months of March through October appear in the table below.
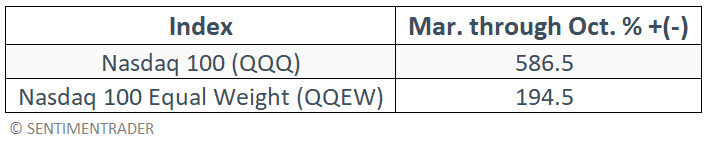
If held only from the end of February through October, the cap-weighted index (QQQ) outperformed the equal-weighted index (QQEW) by a factor of 3.02-to-1. In a near reversal of the above results, QQQ has consistently outperformed QQEW from March through October, as shown in the relative performance chart below.
Putting the two periods together into a switching strategy
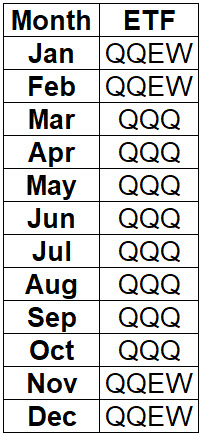
Let's create a switching strategy that will always be fully invested in either ticker QQQ (cap-weighted Nasdaq 100) or ticker QQEW (equal-weighted Nasdaq 100) using the following rules:
- During November through February, hold ticker QQEW
- During March through October, hold ticker QQQ
The table below summarizes this simple approach.
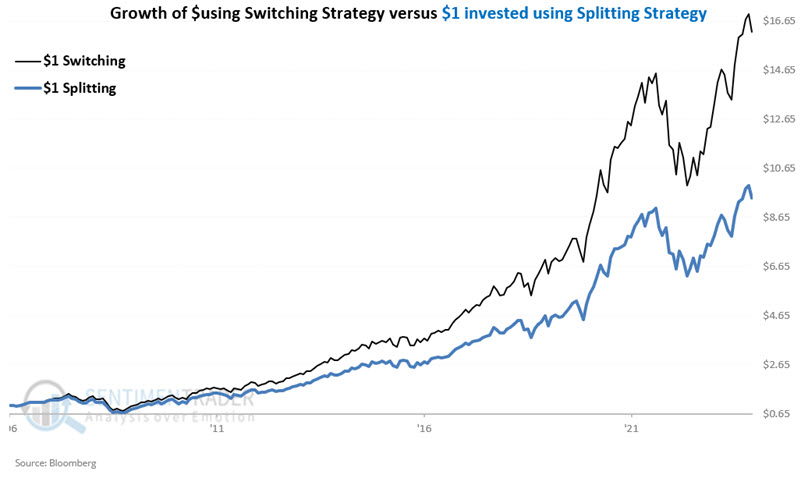
As a baseline, we will also track a strategy that splits 50% between QQQ and QQEW and rebalances every year at the end of October. The chart below displays the hypothetical growth of $1 invested using both the "switching" strategy (black line) and the "splitting" strategy (blue line).
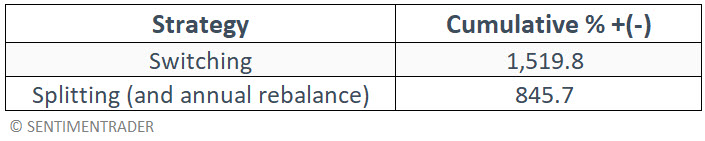
The cumulative returns for buy-and-hold appear in the table below.
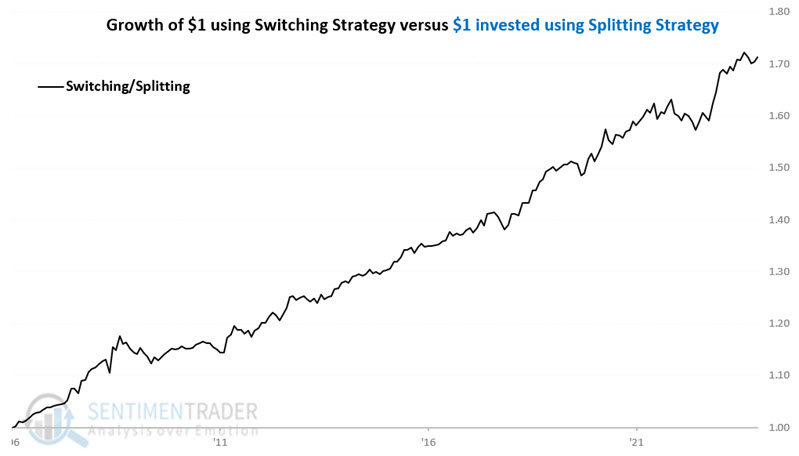
As shown in the chart below, the "switching" strategy has outperformed the "splitting" strategy by a factor of 1.71 to 1. It also beat buying and holding QQQ by a factor of 1.30 to 1.
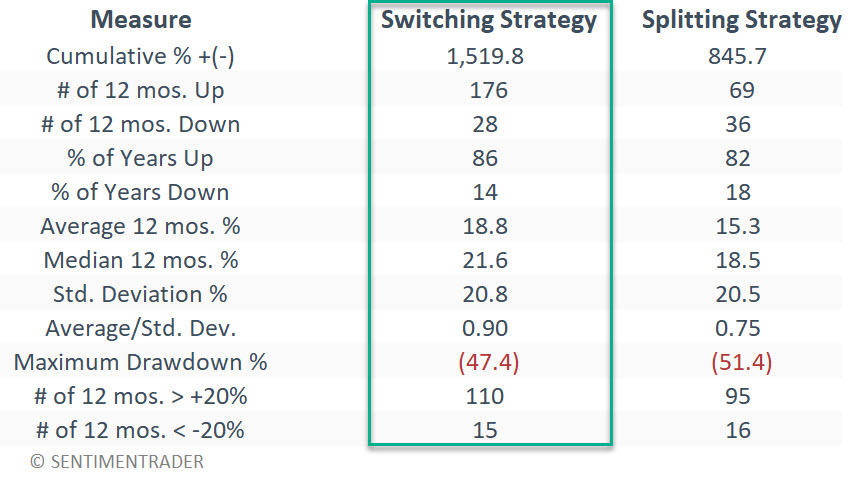
The table below summarizes the performance results for the two strategies.
A word on taxes
One of the benefits of a buy-and-hold approach is avoiding paying capital gains taxes until you actually sell your shares. One potential problem with the switching strategy highlighted above is that it makes two trades a year. Thus, all gains and losses are considered short-term capital gains (or losses) for tax purposes AND taxes must be paid every year there is a gain. As a result, it might reasonably be argued that the strategy above is best used in a qualified account (i.e., one that defers capital gains taxes) and not in a taxable one.
Additionally, in a non-taxable account, the strategy Switching highlighted herein would fit into the "30% Always In" (since it is always fully invested in a stock index) portion of the 30-30-30-10 Strategy detailed here.
What the research tells us...
One note of caution. While the Nasdaq 100 has been a stellar performer for many years, buying and holding this index entails significant risk. Note that during the 2000-2002 bear market, the index suffered a staggering -83% drawdown following the tech bubble bursting. Likewise, the 2007-2008 bear market witnessed a peak-to-valley drawdown of -54%. So be forewarned that buying and holding any Nasdaq-related index can and will sometimes experience extreme volatility. Another thing to consider is that there is no guarantee that the equal-weighted index will continue to outperform during November through February, nor that the cap-weighted will continue to outperform the rest of the year. Still, with those risks firmly in mind, for an investor looking to leave some portion of their capital fully invested in stocks at all times - if history proves an accurate guide - the switching strategy highlighted here may hold the potential for above-average long-term results.