
If you expect a pullback, consider these four sectors

Key points
- Seasonality can be especially helpful in deciding when and where to allocate capital, and also what to avoid altogether
- Real Estate, Materials, Banks, and Energy are all on the cusp of unfavorable seasonal periods
- While seasonality offers clues, it is best applied in conjunction with confirming price action; each of these four sectors has been showing relative price weakness
- "Investors" might consider allocating capital elsewhere for now, while "traders" who are not bullish on the overall market may consider playing the short side
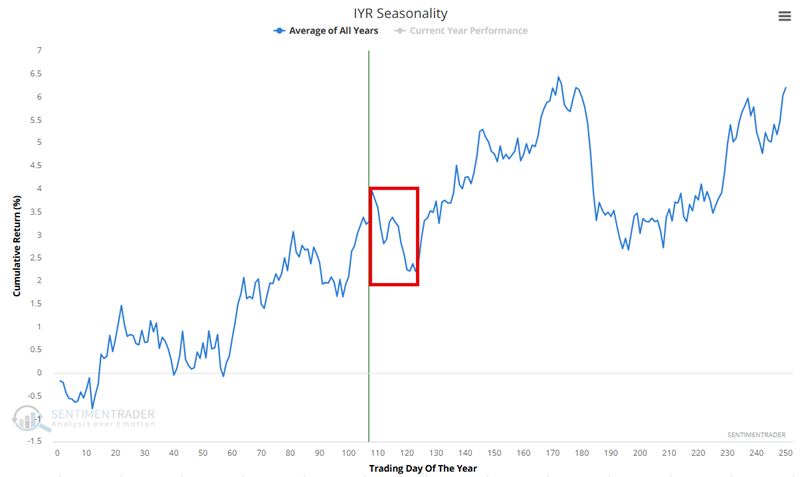
Sector #1: Real Estate (ticker IYR)
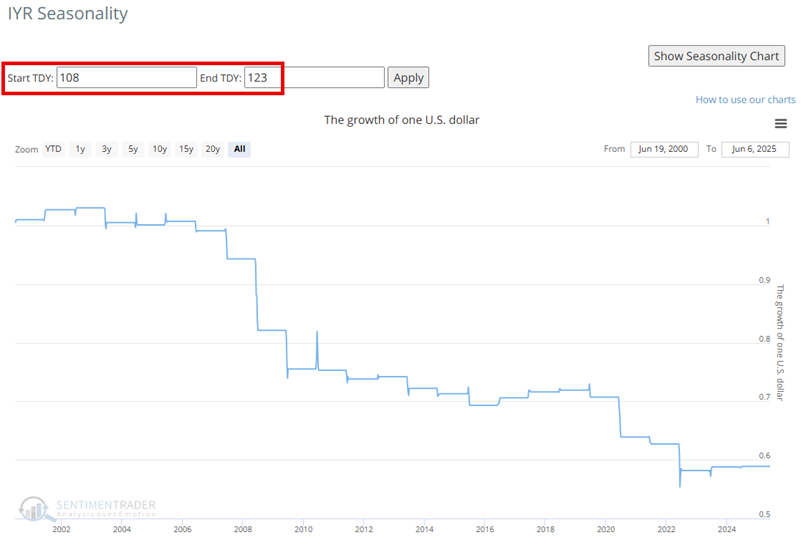
The Annual Seasonal Trend chart below for ticker IYR shows an unfavorable period that extends from the close of Trading Day of the Year (TDY) #108 through TDY #123. For 2025, this period extends from the close on 2025-06-09 through 2025-07-01.
The chart below displays the hypothetical growth of $1 invested in IYR only during this period, every year since 2001.
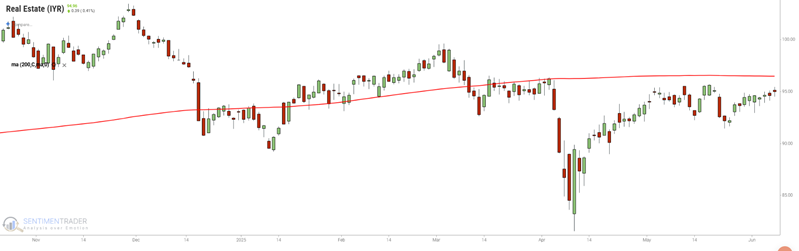
IYR has bounced significantly off its April low, but remains below a declining 200-day moving average. As long as price action and seasonality align, the outlook for IYR is unfavorable.
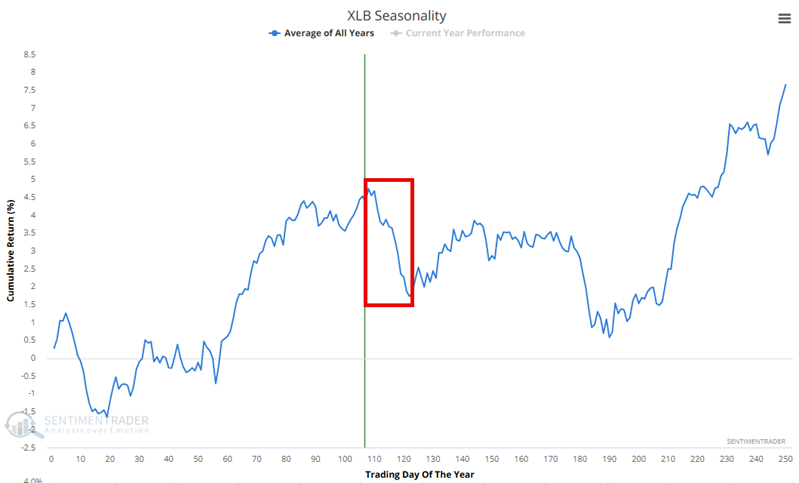
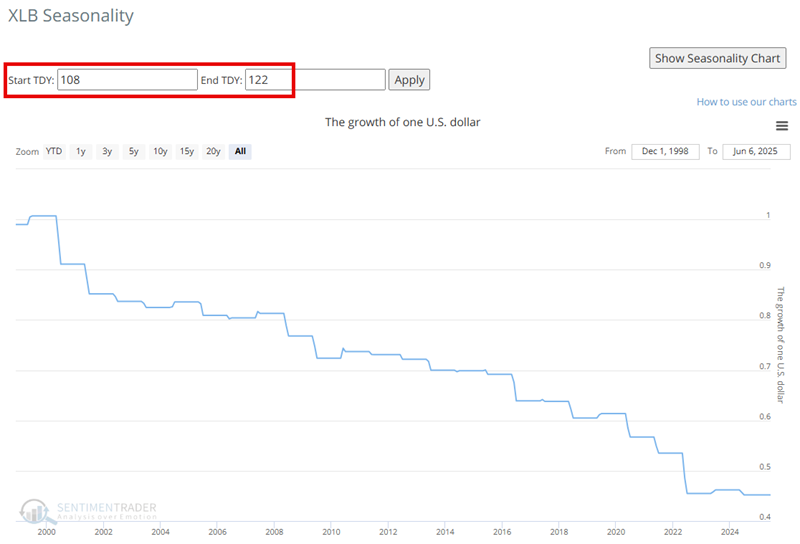
Sector #2: Materials (ticker XLB)
The Annual Seasonal Trend chart below for ticker XLB shows an unfavorable period that extends from the close of Trading Day of the Year (TDY) #108 through TDY #122. For 2025, this period extends from the close on 2025-06-09 through 2025-06-30.
The chart below displays the hypothetical growth of $1 invested in XLB only during this period, every year since 2000.
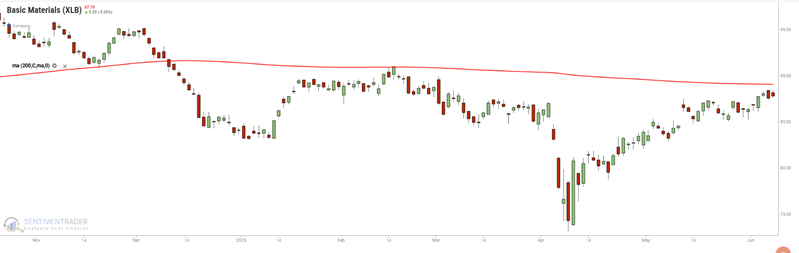
XLB has bounced significantly off its April low, but remains below a declining 200-day moving average. As long as price action and seasonality align, the outlook for XLB is unfavorable.
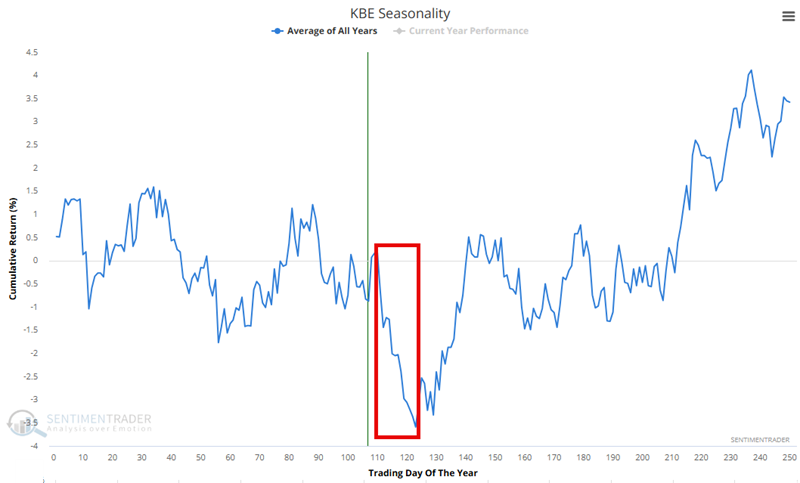
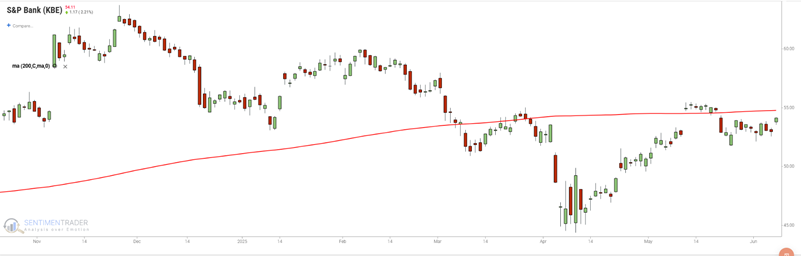
Sector #3: Banks (ticker KBE)
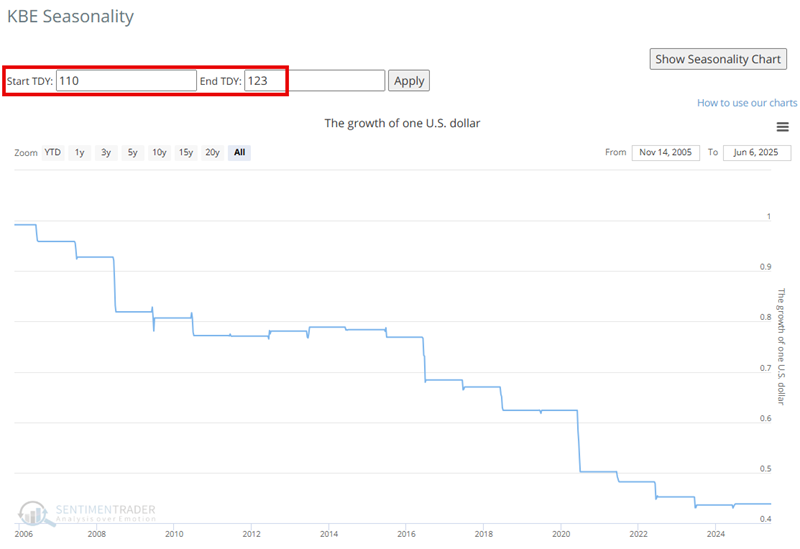
The Annual Seasonal Trend chart below for ticker KBE shows an unfavorable period that extends from the close of Trading Day of the Year (TDY) #110 through TDY #123. For 2025, this period extends from the close on 2025-06-11 through 2025-07-01.
The chart below displays the hypothetical growth of $1 invested in KBE only during this period, every year since 2006.
KBE recently popped its head above its 200-day moving average before dropping back below (while the overall market moved higher - a sign of relative weakness.
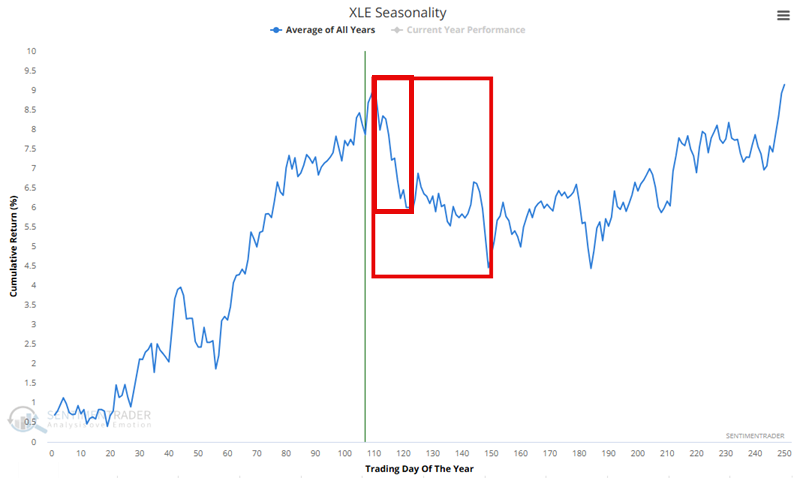
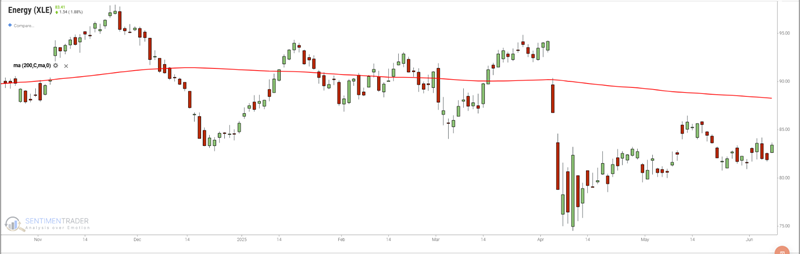
Sector #4: Energy (ticker XLE)
The Annual Seasonal Trend chart below for ticker XLE shows an unfavorable period from the close of Trading Day of the Year (TDY) #110 through TDY #123 and a longer period from TDY #110 through TDY #149. For 2025, the shorter period extends from the close on 2025-06-11 through 2025-07-01. The longer period extends through 2025-08-07.
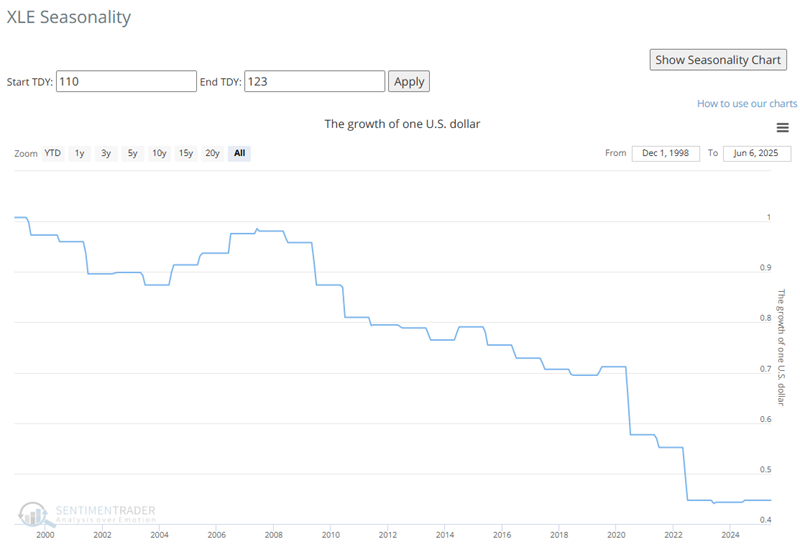
The chart below displays the hypothetical growth of $1 invested in XLE only during the TDY #110 through TDY #123 period, every year since 2000.
The chart below displays the hypothetical growth of $1 invested in XLE only during the TDY #110 through TDY #149 period, every year since 2000.
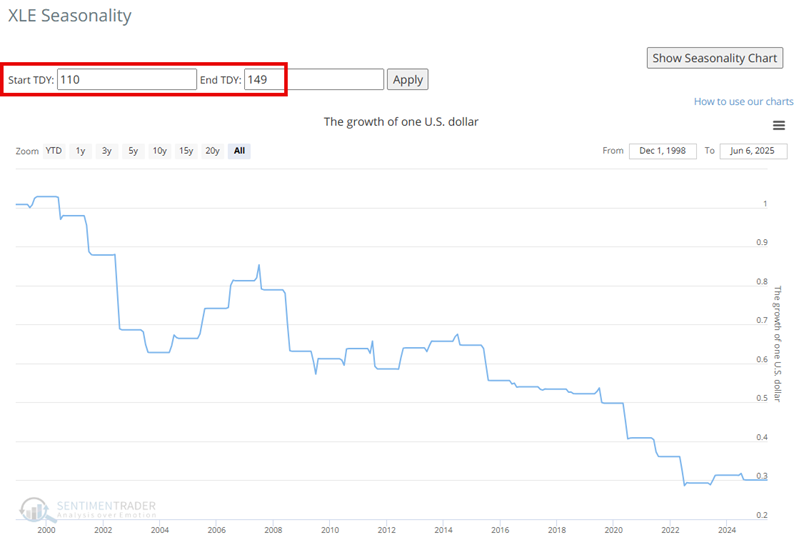
XLE bounced relatively weakly off the April lows and remains below a declining 200-day moving average.
Playing the short side
While "investors" are encouraged to allocate elsewhere for now, a short-term trader who expects the market to cool off might consider trying to play the short side of these sectors. There are three basic choices, each with some serious risks to carefully consider before committing:
Shorting ETF shares: The most straightforward approach is to sell short shares of the abovementioned ETFs. The pro is point-for-point movement if the ETF does, in fact, decline. This approach requires a margin account and entails potentially unlimited risk (a stop-loss is mandatory) if the ETF rallies rather than declines.
Buying put options: Buying a put option offers a limited risk way to bet on a price decline in a specific security/sector. The problem here is that the July options for the ETFs listed above generally have low trading volume and potentially wide bid/ask spreads. Carefully consider the bid/ask spread before trading options on any of these ETFs.
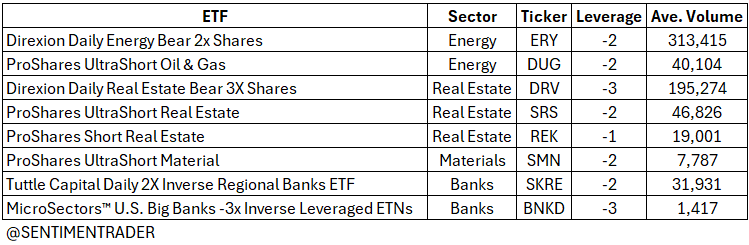
Buying Inverse ETFs: Inverse ETFs allow traders to play the short side by simply buying shares in a stock account. Some possibilities are listed in the table below. Please note that the ETFs listed in the table below are for your further consideration and NOT specific "recommendations." There are several significant risks involved with investing in inverse ETFs. Note that most of those listed below are "Inverse Leveraged" funds, i.e., they attempt to track two to three times the daily movement of the underlying index. Over time, 2x and 3x funds do not always precisely track their benchmark exactly, so traders don't always get exactly the returns they expect. Generally speaking, inverse leveraged funds can lose money at an absolutely astounding rate if the underlying index moves in the wrong direction. Lastly, most of the ETFs listed below are not heavily traded.
One "thought" here would be to reduce the amount of capital you commit to a -2x by half, or a -3x by 2/3rds (to eliminate the effect of leverage). In other words, if you usually consider allocating $5,000, allocate only $2,500 to a -2x fund (i.e., play the short side without the leverage).
What the research tells us…
If the stock market continues to rally as it has in the past month or so, the sectors discussed above may do just fine. But the real point is that a big part of investing is asset allocation, and investing where you expect the best returns. Could these four perform well in the month ahead? Absolutely. However, history and recent price action suggest that investors look elsewhere for now. Short-term traders considering the short side must decide on a vehicle with which to do so and carefully consider the attendant risks as discussed above.