Data &
Technology
Research
Reports
Report Solutions
Reports Library
Actionable
Strategies
Free
Resources
Simple Backtest Calculator
Simple Seasonality Calculator
The Kelly Criterion Calculator
Sentiment Geo Map
Public Research Reports
Free Webinar
Pricing
Company
About
Meet Our Team
In the News
Testimonials
Client Success Stories
Contact
Log inLoginSign up
< BACK TO ALL REPORTS

If the Nasdaq is peaking, it should look like this

Jason Goepfert
2020-09-04
Looking at the 8 other times the Nasdaq Composite formed a major peak, there was not a lot of back-and-forth price action. The index tended to rally hard into the peak, then fall hard right after.

On Thursday, we saw that the consistency of gains and their magnitude in the Nasdaq Composite over several time frames can be matched by only two other times in its history.

After Thursday's rout, one of the most popular questions has been whether this is "it", the final pricking of what could be considered bubbly behavior. If so, what would a peak look like?

The go-to analog is 1999. While there are some fair comparisons to that period, while others wildly miss the mark. The assumption out there seems to be that if this is, indeed, a 1999-2000 type pricking of a bubble, then we'll see wild back-and-forth swings in the weeks ahead, with big drops then dramatic rallies. If we rely solely upon n=1 then maybe that's the case. But when it comes to analogs, we'd prefer to cast a wider net.

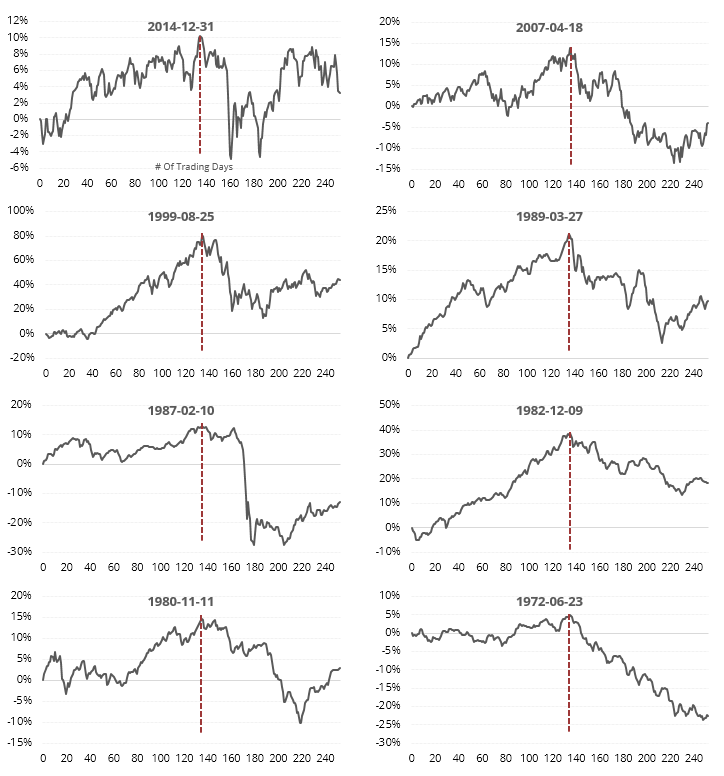
Below, we can see an average of the 8 other times the Nasdaq hit a 3-year peak that wasn't surpassed for at least the next year.

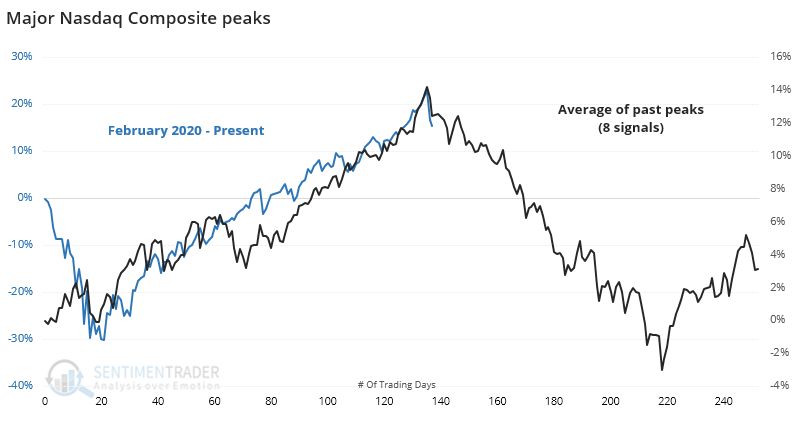
That average is v-toppy, meaning there wasn't a lot of back-and-forth activity surrounding the peak. The Nasdaq soared higher, then...did not. The individual signals show that when the Nasdaq peaked, it PEAKED, underlined and with all-caps. There wasn't much dickering around.

The suggestion from this is that if the Nasdaq is finally peaking, and if it looks anything like its past major peaks, then we're more likely to see an almost straight-down move in the weeks ahead. If we instead see a bunch of back-and-forth volatility with a subsequent move to new highs, then it would violate pretty much all the historical peak precedents (unless it peaks then plunges again, which would reset the analogs).

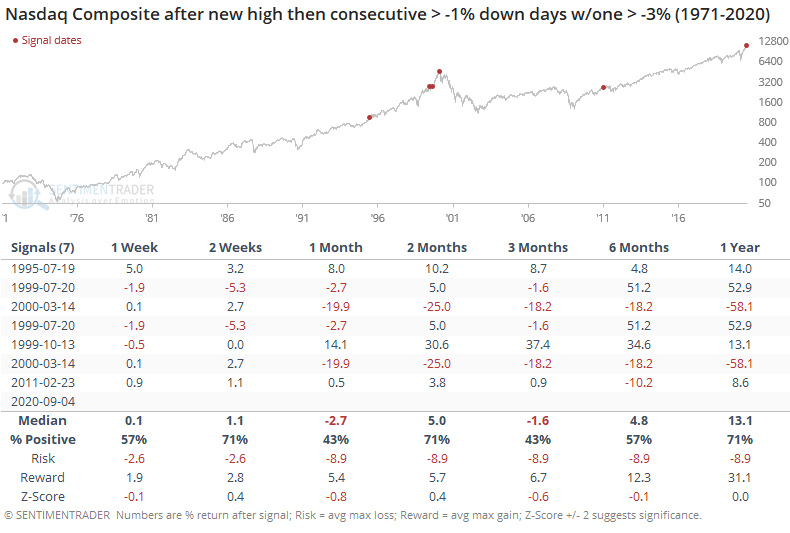
As this is published, the Nasdaq is down again. It has never hit a 52-week high then suffered back-to-back losses of greater than 3%. It has dropped more than 2% on consecutive sessions twice.

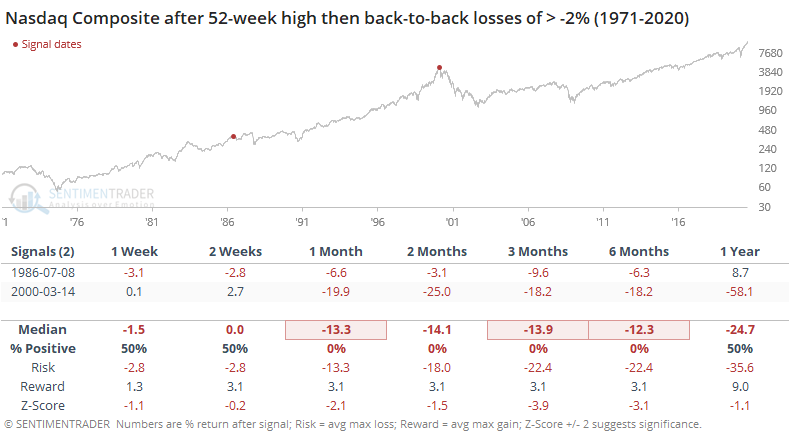
There is time for the index to recover. If not, it helps to confirm what has already been some troubling precedents.

EDIT: After this was published, the Nasdaq rose enough avoid another 2% loss. Its precedents got a little less scary as a result.

Sorry, you don't have access to this report

Upgrade your subscription plan to get access
Go to Dasboard
DATA &
TECHnologies
IndicatorEdge
‍
BackTestEdge
‍
Other Tools
‍
DataEdge API
RESEARCH
reports
Research Solution
‍
Reports Library
‍
actionable
Strategies
Trading Strategies
‍
Smart Stock Scanner
‍
FREE
RESOUrCES
Simple Backtest
Calculator
Simple Seasonality
Calculator
The Kelly Criterion
Calculator
Sentiment Geo Map
‍
Public Research Reports
‍
Free Webinar
COMPANY
‍
About
‍
Meet our Team
‍
In the News
‍
Testimonials
‍
Client Success Stories
Pricing
Bundle pricing
‍
Announcements
‍
FAQ
© 2024 Sundial Capital Research Inc. All rights reserved.
Setsail Marketing
TermsPrivacyAffiliate Program
Risk Disclosure: Futures and forex trading contains substantial risk and is not for every investor. An investor could potentially lose all or more than the initial investment. Risk capital is money that can be lost without jeopardizing ones’ financial security or life style. Only risk capital should be used for trading and only those with sufficient risk capital should consider trading. Past performance is not necessarily indicative of future results.

Hypothetical Performance Disclosure: Hypothetical performance results have many inherent limitations, some of which are described below. No representation is being made that any account will or is likely to achieve profits or losses similar to those shown; in fact, there are frequently sharp differences between hypothetical performance results and the actual results subsequently achieved by any particular trading program. One of the limitations of hypothetical performance results is that they are generally prepared with the benefit of hindsight. In addition, hypothetical trading does not involve financial risk, and no hypothetical trading record can completely account for the impact of financial risk of actual trading. for example, the ability to withstand losses or to adhere to a particular trading program in spite of trading losses are material points which can also adversely affect actual trading results. There are numerous other factors related to the markets in general or to the implementation of any specific trading program which cannot be fully accounted for in the preparation of hypothetical performance results and all which can adversely affect trading results.

Testimonial Disclosure: Testimonials appearing on this website may not be representative of other clients or customers and is not a guarantee of future performance or success.