
If July closes higher...

Key points
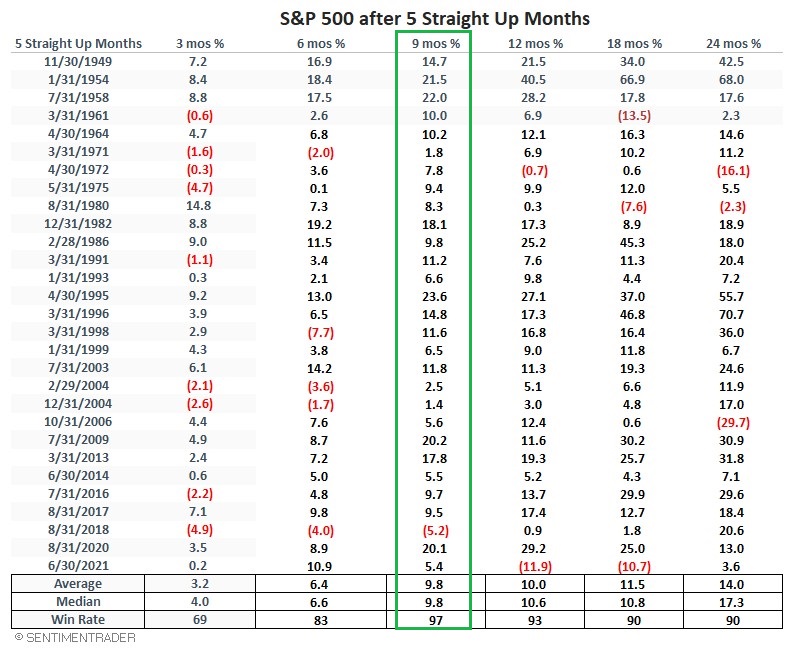
- The S&P 500 appears likely to close July 2023 with a gain; this would mark the 5th consecutive up month
- This has happened only 29 times since 1949
- The S&P 500 was higher nine months later 97% of the time
Five up months for the S&P 500 Index is rare - and bullish
Since 1949, there have been only 29 times when the S&P 500 Index showed a calendar monthly gain for five consecutive months. The table below displays the dates and subsequent S&P 500 performance for each of the previous instances.
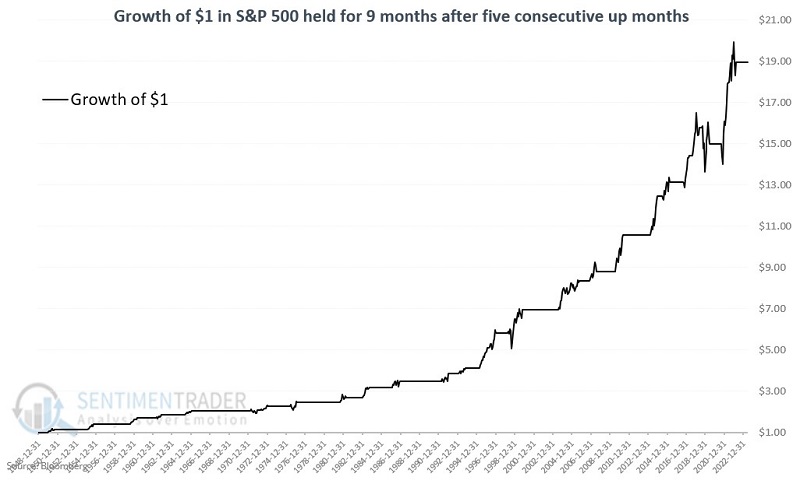
The chart below displays the growth of $1 invested in the S&P 500 only during the first nine months after five consecutive higher monthly closes.
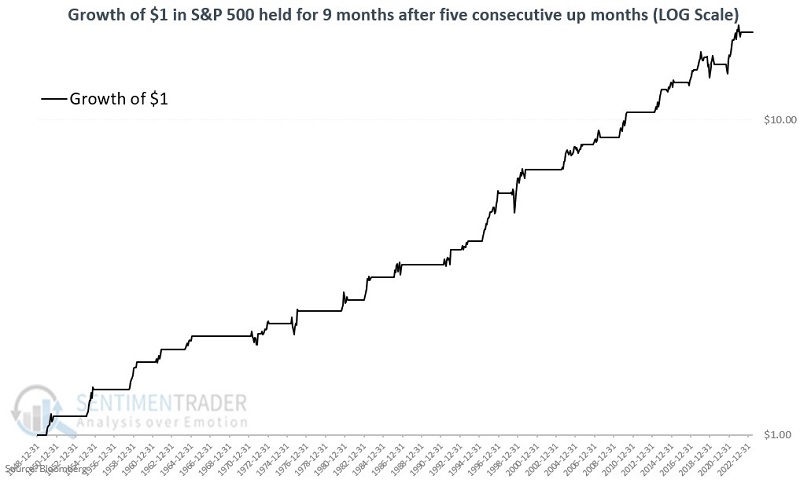
To better understand the consistency of returns, the chart below displays the same values as the chart above, but on a logarithmic basis (i.e., the distance between $1 and $10 is the same as the distance between $10 and $100).
What the research tells us…
No single indicator is the be-all, end-all of trading. And no indicator is infallible. Still, history has demonstrated in many ways that momentum in the stock market can be a powerful force. There is no guarantee that stock prices will glide effortlessly higher just because the S&P 500 closes higher for five consecutive months. Drawdowns, volatility, and the occasional loss are inevitable. But the "lower left to upper right" nature of the equity curve above is what most investors seek. If July 2023 closes with the S&P 500 above 4450.38, it will mark the fifth consecutive higher monthly close. History suggests that this occurrence would lend significant weight to the bullish side of the ledger.