Indicators &
Backtest Tools
Research
Reports
Report Solutions
Reports Library
Strategies
& Scanner
Free
Resources
Simple Backtest Calculator
Simple Seasonality Calculator
The Kelly Criterion Calculator
Sentiment Geo Map
Public Research Reports
Free Webinar
Pricing
Company
About
Meet Our Team
In the News
Testimonials
Client Success Stories
Contact
Log inLoginSign up
< BACK TO ALL REPORTS

Huge Internal Rotation

Dean Christians
2021-01-27

Jason and I have highlighted some oddities in short-term breadth measures of late. The indicators run counter to several long-term studies that remain constructive. We can add one more item to the list of oddities. The percentage of S&P 500 members outperforming the Index on a rolling 1-month basis contracted in a significant way over the last six trading days. The indicator experienced a decline of 16.44%. Significant gyrations up and down in this indicator are a sign of internal rotation.

Let's take a look at some historical chart examples of the indicator.

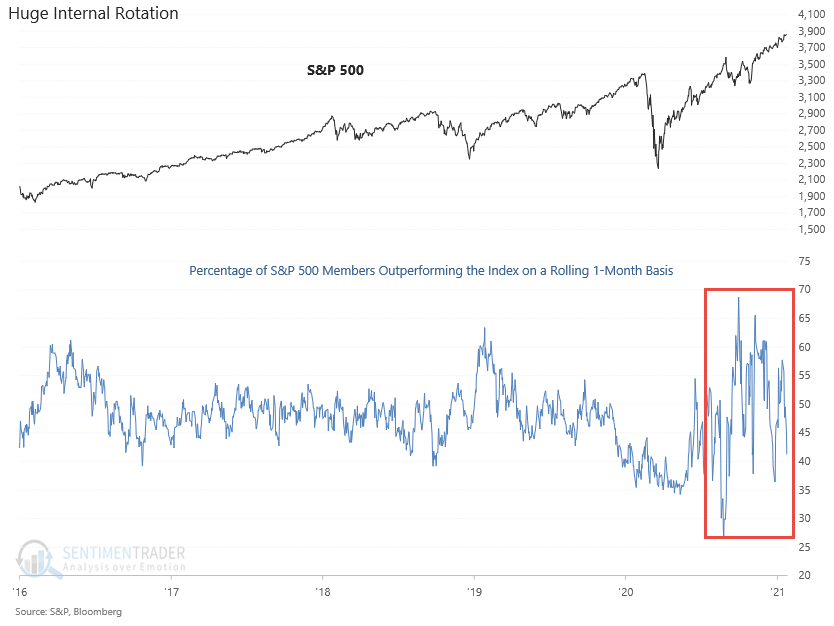
Current Chart for Members Outperforming Index

As one can see, the gyrations up and down since late July have been significant. It's not uncommon to see this type of internal rotation around market transition periods. i.e., bear to bull or bull to bear.  What makes this period different from others is the duration. The process is occurring in a brief period.
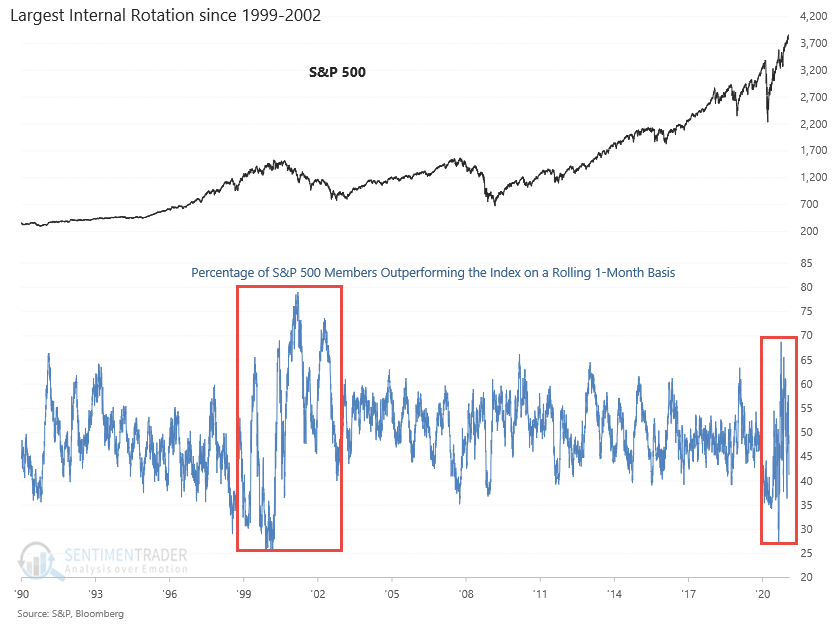

1999-2002 Example

If we zoom out to include the 1990's in our chart, we can see the internal rotation in the 1999-2002 period. While the gyrations were more significant than the current day, they occurred over a much longer timeframe.

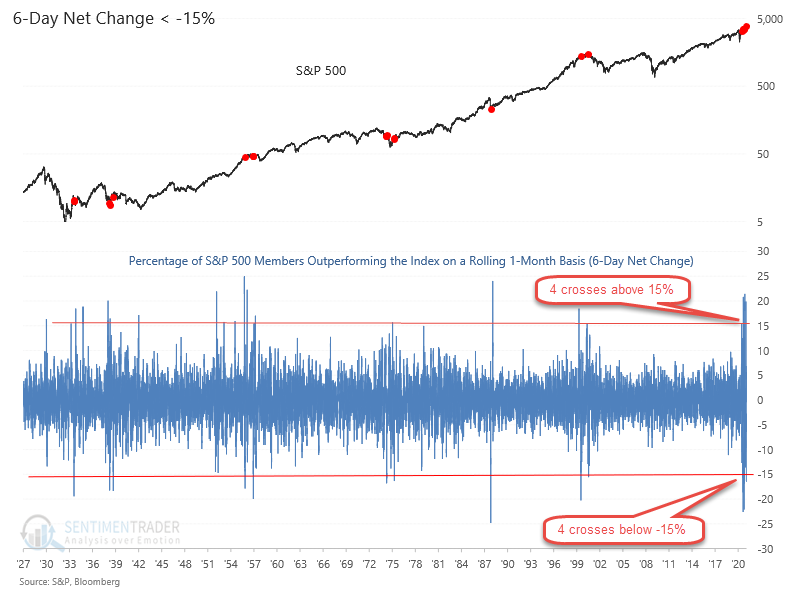
If we zoom out further and look at the 6-day net change in the percentage of members outperforming, one can see the large up and down swings from a historical perspective. I count four instances where the 6-day net change crossed above 15% and four where it crossed below -15% since July 2020. That's the most in history in such a brief period. Please note, the red dots in the chart represent readings of -15% or less.


Conclusion: I suspect the extreme internal rotation in such a brief period is a sign of investor uncertainty around the disconnect between some segments of the economy and the stock market. Investors are struggling with the growth versus value conundrum.

Sorry, you don't have access to this report

Upgrade your subscription plan to get access
Go to Dasboard
Indicators & Backtest Tools
IndicatorEdge
‍
BackTestEdge
‍
Other Tools
‍
DataEdge API
RESEARCH
reports
Research Solution
‍
Reports Library
‍
Strategies & Scanner
Trading Strategies
‍
Smart Stock Scanner
‍
FREE
RESOUrCES
Simple Backtest
Calculator
Simple Seasonality
Calculator
The Kelly Criterion
Calculator
Sentiment Geo Map
‍
Public Research Reports
‍
Free Webinar
COMPANY
‍
About
‍
Meet our Team
‍
In the News
‍
Testimonials
‍
Client Success Stories
Pricing
Bundle pricing
‍
Announcements
‍
FAQ
© 2024 Sundial Capital Research Inc. All rights reserved.
Setsail Marketing
TermsPrivacyAffiliate Program
Risk Disclosure: Futures and forex trading contains substantial risk and is not for every investor. An investor could potentially lose all or more than the initial investment. Risk capital is money that can be lost without jeopardizing ones’ financial security or life style. Only risk capital should be used for trading and only those with sufficient risk capital should consider trading. Past performance is not necessarily indicative of future results.

Hypothetical Performance Disclosure: Hypothetical performance results have many inherent limitations, some of which are described below. No representation is being made that any account will or is likely to achieve profits or losses similar to those shown; in fact, there are frequently sharp differences between hypothetical performance results and the actual results subsequently achieved by any particular trading program. One of the limitations of hypothetical performance results is that they are generally prepared with the benefit of hindsight. In addition, hypothetical trading does not involve financial risk, and no hypothetical trading record can completely account for the impact of financial risk of actual trading. for example, the ability to withstand losses or to adhere to a particular trading program in spite of trading losses are material points which can also adversely affect actual trading results. There are numerous other factors related to the markets in general or to the implementation of any specific trading program which cannot be fully accounted for in the preparation of hypothetical performance results and all which can adversely affect trading results.

Testimonial Disclosure: Testimonials appearing on this website may not be representative of other clients or customers and is not a guarantee of future performance or success.