
How to tell if fears of a credit event are real or perceived

Key Points
- Pundit warnings of an impending "credit event" have increased
- Credit spreads measure the yield gap between lower-graded and higher-graded debt securities
- Rising credit spreads reflects uncertainty - and, at times, fear - regarding the economy and/or the financial system
- Monitoring credit spreads can offer important clues about the actual level of risk in the financial markets
Definition of a credit event
cred·it e·vent
noun: credit event; plural noun: credit events
a default, bankruptcy, or other situation is recognized as affecting a country's or organization's creditworthiness and may trigger insurance payments as defined in a credit default swap.
"Investors should remember that this is a relatively small credit event relative to some of those we've seen in the banking sector before."
Monitoring credit spreads is one way to measure whether credit event fears are real or perceived.
An overview of credit spreads
A "credit spread" measures the difference in the current yield for a lower-rated security versus a higher-rated security. The lower the rating for a given debt instrument, the higher the likelihood the issuer will default and be unable to repay all of the promised interest and principal. The higher the rating for a given debt instrument, the less likely the issuer will default and be unable repay all of the promised interest and principal.
As a result, in order to attract buyers, lower-rated debt instruments must offer a higher interest rate (i.e., yield) to compensate for the higher risk of default. By monitoring the level and trend of credit spreads, an investor can get a sense of the amount of fear in the market. In a sense, credit spreads in the bond market serve a similar function as the VIX Index in the stock market. Credit spreads essentially measure "fear."
When there is fear in the bond market, credit spreads will widen as buyers of lower-rated securities demand much higher yields to compensate for the (real or perceived) increase in risk. On the other hand, if things are generally calm, that demand diminishes, and credit spreads narrow.
The type of credit spread we will focus on in this piece is known as a "Credit default swap." Credit default swaps are a little-understood derivative that allows the various parties to swap the exposure of default of an underlying bond.
An Overview of Credit Default Swaps
Over the past few years, one of the fastest-growing derivatives markets is for credit default swaps (CDS). A CDS allows the various parties to swap the default exposure of the underlying credit (i.e., bond). For example, investors in a relatively risky bond might be uncomfortable that its issuer could default on their payments. To hedge that risk, the investor buys a CDS.
When they buy the CDS, the investor pays another trader (the seller) a periodic payment. That other trader then takes on the risk that the bond issuer will default. If that happens, the seller is responsible for paying the bond investor an agreed-upon amount. This allows the original investors to offset some of their risks, allows the seller to generate a stable flow of income, and allows the bond market to enjoy more liquidity. Of course, just like selling options, the seller of a CDS takes on possibly significant risks, and a major system-wide event could trigger a massive wave of trouble since this market has become so huge.
The CDX Index indicator posted to our site tracks an index created by Dow Jones, which monitors the spread between credit default swaps on high-yield (i.e., junk) bonds and Treasury securities. The higher the index, the wider the spread - which means that credit investors are increasingly worried about defaults and are willing to pay higher prices for default protection.
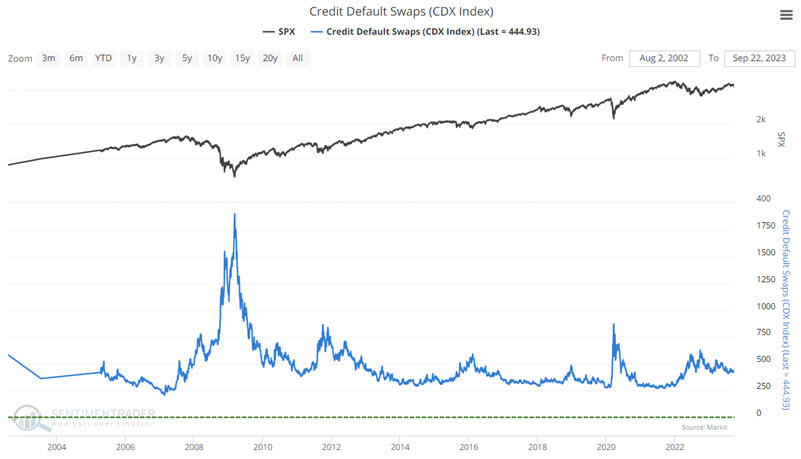
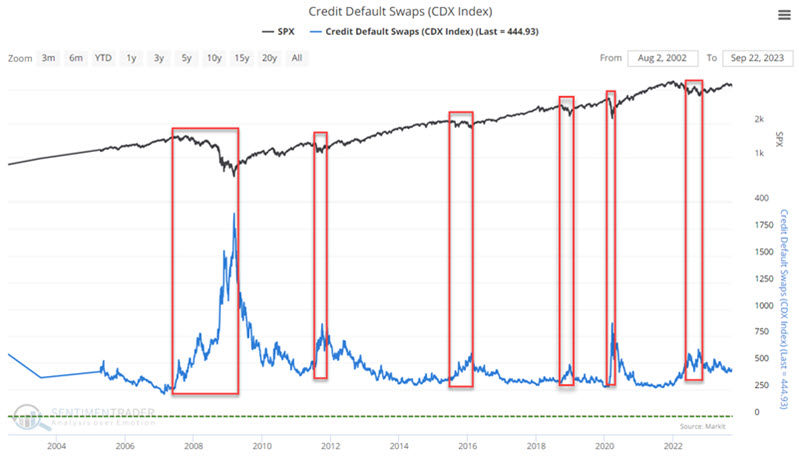
The stock market hates uncertainty. As a result, when credit spreads widen - indicating some turmoil in the financial system - the stock market tends to react negatively. Anecdotally, we can see this phenomenon in the chart below.
The real question then becomes, "Is there a way to objectively use credit spreads as a trading tool?" One potential way to do so is to follow the trends in the CDX Index.
Tracking Credit Default Swaps with the CDX Index
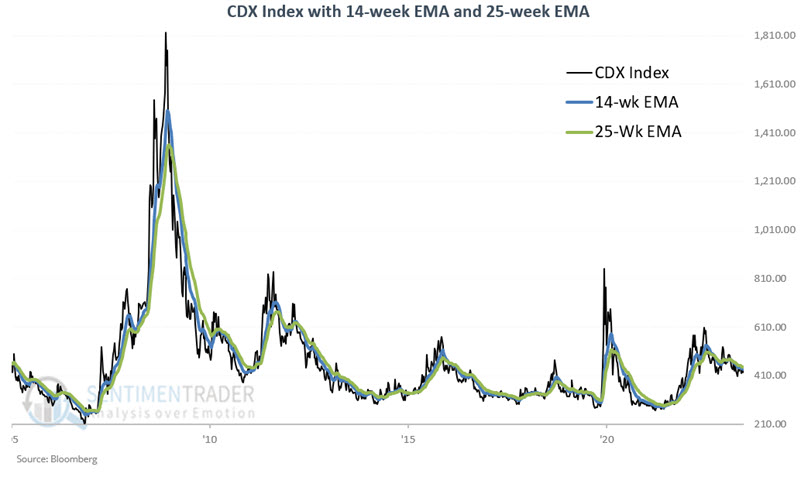
The CDX Index is a "fear gauge" that measures stress in the financial markets. As such, we expect it to rise when the stock market falls and vice versa. To track the trend of the CDX Index, we will use a 14-week and a 25-week exponential moving average. The chart below displays the CDX Index with its 14- and 25-week EMAs.
To get a better feel for how this index moves, the chart below zooms into the 2020-2023 period.
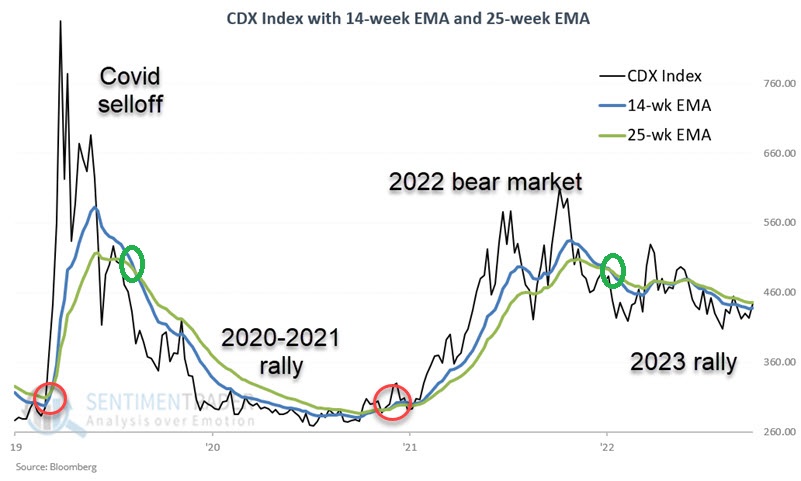
Note the spike during the Covid panic, then the reversal as the stock market turned around. Then, the index started increasing in late 2021 as the stock market peaked and continued to rise during the 2022 bear market. The 14-week EMA finally crossed back below the 25-week EMA on 2023-01-06, suggesting potentially improved conditions for stocks.
Currently, the 14-week EMA remains below the 25-week EMA. However, the gap has narrowed in the last two months. A cross of the 14-week EMA back above the 25-week EMA would indicate actual trouble in the financial markets.
To better understand the assertion above, let's look at S&P 500 performance based on the action of the CDX Index.
The CDX Index and S&P 500 performance
Let's analyze the S&P 500 Index performance based on whether the 14-week EMA for the CDX Index is above or below its 25-week EMA.
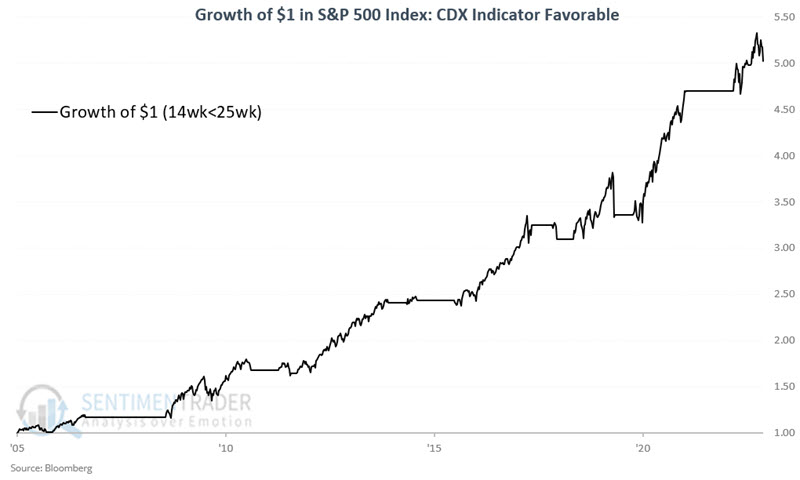
The chart below displays the cumulative percentage performance for the S&P 500 Index if held long only when the CDX Index's 14-week EMA is below its 25-week EMA. Since the CDX Index was first calculated in 2005, the S&P 500 has gained +402% while the 14-week EMA is below the 25-week EMA.
The chart below displays the cumulative percentage performance for the S&P 500 Index if held long only when the CDX Index's 14-week EMA is above its 25-week EMA.
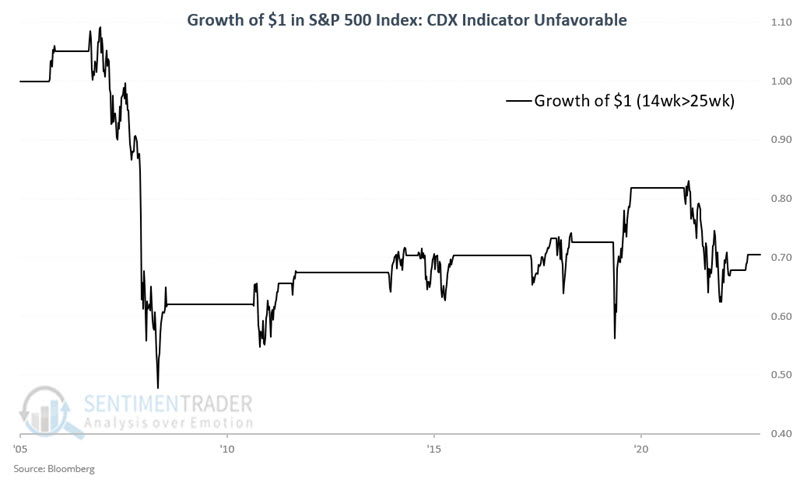
Since the CDX Index was first calculated in 2005, the S&P 500 has lost -29% when the 14-week EMA exceeded the 25-week EMA.
What the research tells us…
Swings in the CDX Index can offer insight into the actual level of fear and complacency among large institutional investors. When fear and uncertainty increase in the market and economy, the CDX Index will almost invariably reflect this. During these times, CDS sellers demand more premium to protect themselves, and large institutional bond investors will readily pay up to offload risk. As long as the 14-week EMA holds below the 25-week EMA, fears of a credit event are just predictions. However, nothing lasts forever. When the 14-week EMA next crosses above the 25-week EMA, market history suggests that investors may be wise to consider playing some defense.