
How the credit market reacts to changes in credit spreads

Key Points
- Credit spreads tend to rise in periods of doubt and fear and fall when things are "calm"
- Bank loans tend to have a highly inverse relationship to credit spreads
- The speed and consistency with which credit markets (bank loans in particular) react to changes in credit spreads is something that few traders fully understand
Indicator #1: BBB - AAA yields
The chart below displays the spread between yields on BBB-rated and AAA-rated bonds.
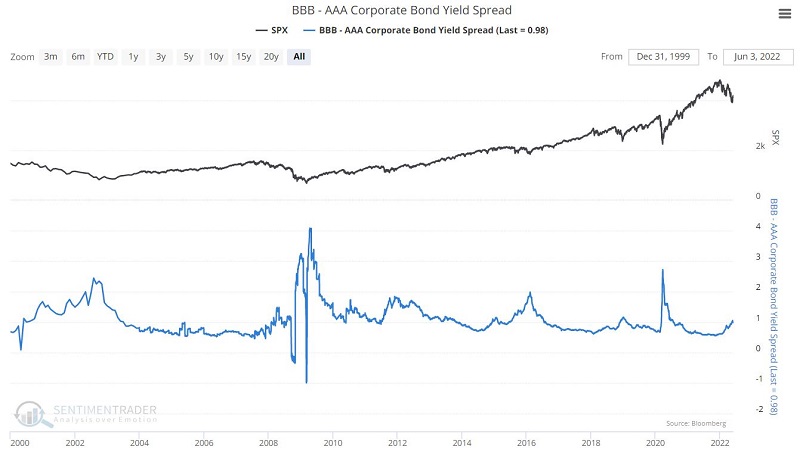
During periods of uncertainty in the financial markets in general - and the credit markets specifically - this spread widens, and investors dump lower-rated credits and seek the safer haven of higher-rated securities.
Indicator #2: CDX Index (Credit Default Swaps)
The chart below displays the action of the CDX Index, which monitors the spread between credit default swaps on high-yield (i.e., junk) bonds and Treasury securities. The higher the index, the wider the spread - this means that credit investors are more and more worried about defaults and are willing to pay higher prices for default protection. For more information on the CDX Index, see this recent article.
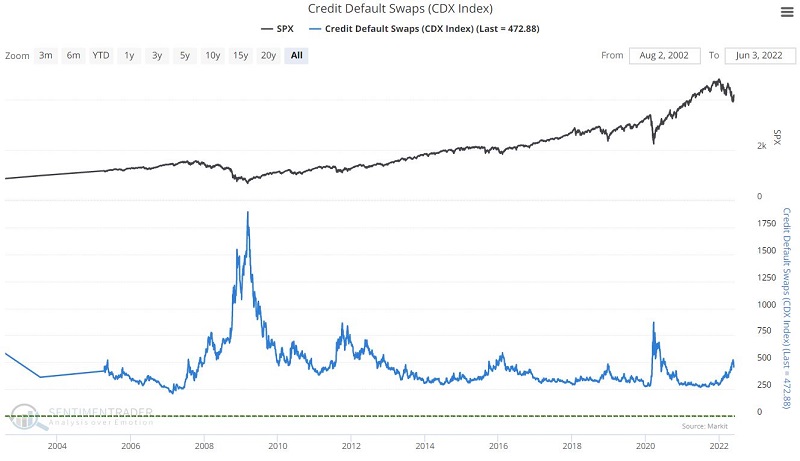
Like the BBB-AAA spread, this index rises during periods of uncertainty in the financial markets in general - and the credit markets specifically.
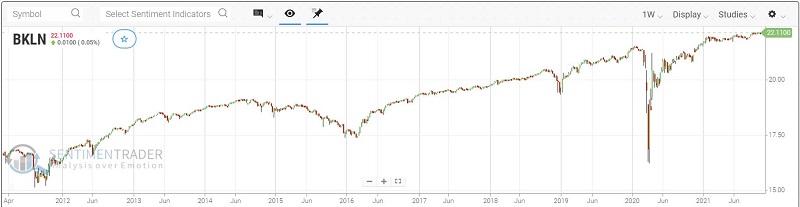
Indicator #3: Ticker BKLN (Invesco Senior Loan ETF)
The chart below displays weekly price action for ticker BKLN (Invesco Senior Loan ETF). BKLN invests entirely in U.S. leveraged loans, giving investors a pure-play on the domestic economy. During periods of uncertainty, this security will typically decline sharply in price.
Using the indicators
To build a model I look at the following:
A = 9-day exponential average for BBB-AAA spreads
B = 9-day exponential average for CDX Index
C = 9-day exponential average for BKLN
D = If A two days ago < A three days ago, then for today D = 4 else D = 0
E = If B two days ago < B three days ago, then for today then E = 2 else E = 0
F = If C two days ago > C three days ago, then for today then F = 1 else F = 0
G = D + E + F
In English:
- If the 9-day EMA for the BBB-AAA spread is trending lower, that is bullish
- If the 9-day EMA for CDX Index is trending lower, that is bullish
- If the 9-day EMA for BKLN is trending higher, that is bullish
For any given trading day, G can read 0 through +7
NOTE: There is a one-day lag in data to make the information useful for trading purposes. In other words, the reading for a Tuesday is based on data from the previous Thursday and Friday. For example, if Variable A declines from Thursday to Friday (i.e., if the 9-day EMA for the BBB-AAA spread is falling), then Variable D will be rated as +4 on the following Tuesday. So, a trader could calculate the indicators after Friday's close and make a trade (if called for) on Monday's close (the next trading day) to be in position for trading on Tuesday.
Trading rules
- If G > 1, then hold BKLN
- If G <=1, then do not hold BKLN
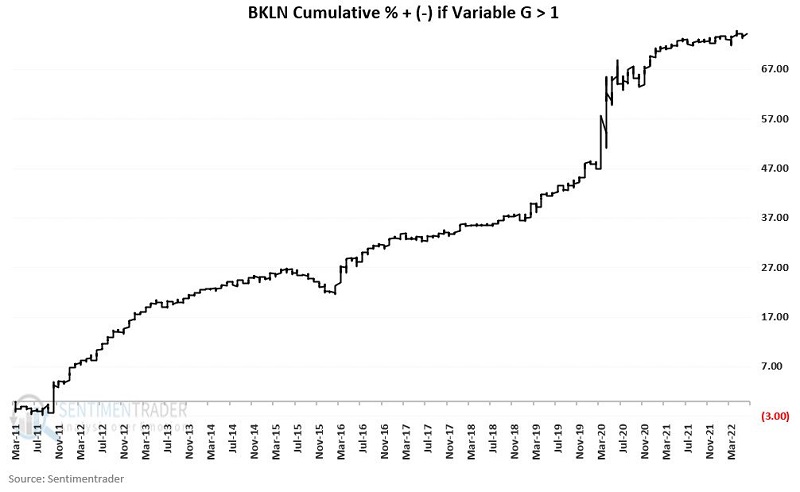
Results
The chart below displays the cumulative % +(-) for BKLN if held long only when Variable G > +1. These results are illustrative and do not deduct anything for slippage or commissions. The cumulative % gain was +74.3%.
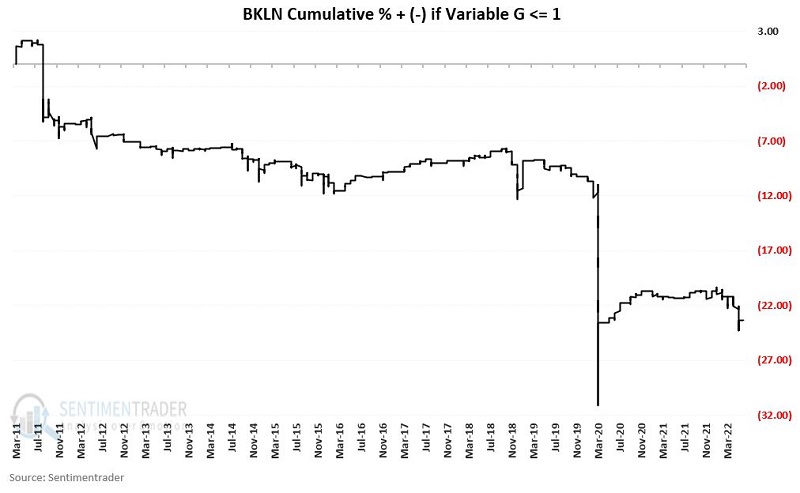
The chart below displays the cumulative % +(-) for BKLN if held long only when Variable G <= 1. These results are illustrative and do not deduct anything for slippage or commissions. The cumulative % decline was -23.3%.
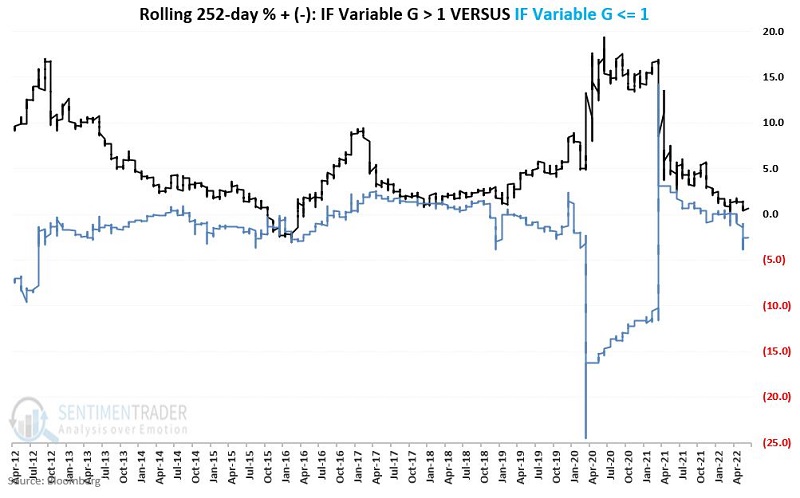
The chart below displays the rolling 252-day return from holding BKLN depending on whether Variable G is above +1 (black) or <= +1 (blue). The black line was above the blue line during 97.3% of all rolling 252-day periods tested. In other words, bank loan performance is consistently in tune with changes in credit spreads (i.e., bank loans tend to rise in value when credit spreads are falling and vice versa).
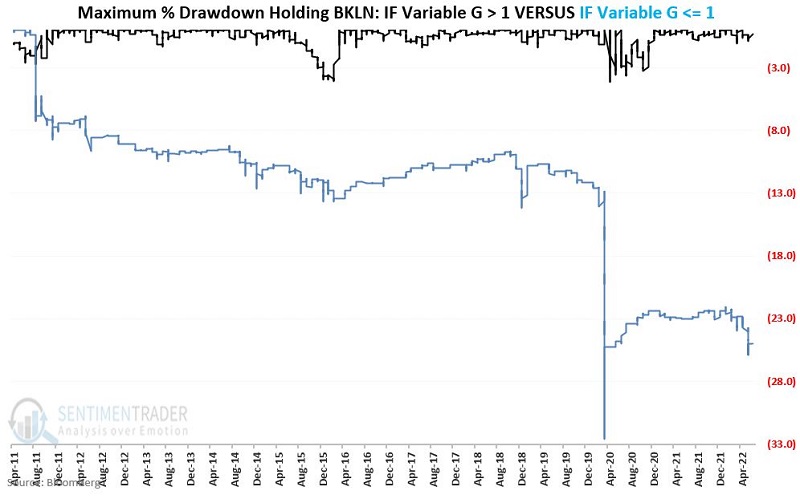
Finally, the chart below displays maximum drawdowns achieved by holding BKLN when Variable G is above +1 (black) or <= +1 (blue).
- The maximum drawdown to date for BKLN when Variable G is above +1 is (-4.2%)
- The maximum drawdown to date for BKLN when Variable G is <= +1 is (-32.6%)
What the research tells us…
The results detailed above clearly illustrate the real impact that changes in credit spreads can have in the credit markets. They also demonstrate the consistency with which the financial markets react to changes in credit spreads.