
How low can the price of gas go?

Key points
- The price of Unleaded Gas futures is essentially unchanged from where it was ten years ago
- While geopolitical tensions have everyone anticipating higher energy prices. Unleaded Gas is entering its weakest time of year
- A recent development in crude oil pricing has also flashed a yellow flag for Gas
Unleaded Gas price action is mixed
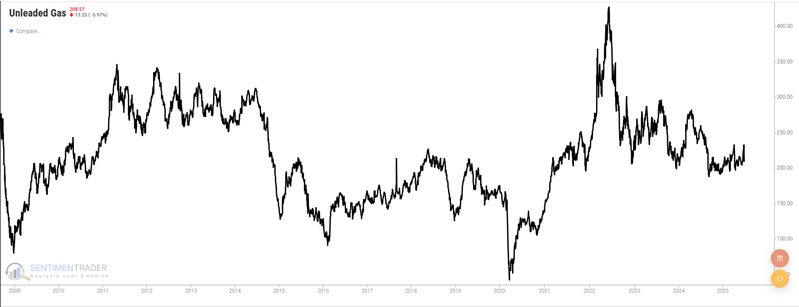
Rule #1 for the energy commodities: If anyone tells you what price unleaded gas (and/or crude oil for that matter) is headed for, ignore them. The chart below shows that the price of unleaded gas futures has fluctuated widely, yet not really gone anywhere in roughly seventeen years.
Many traders assume that gasoline price fluctuations are driven by anticipated worldwide economic growth (affecting demand) and geopolitical tensions, or lack thereof (affecting supply). Good luck quantifying those two factors.
More helpfully, we have found at least two factors that can be combined to help determine which side of unleaded gas to be on at any given moment.
Unleaded Gas is entering a significant seasonal period
The chart below displays the annual seasonal trend for Unleaded Gas futures. We see a glaringly obvious tendency for unleaded gas to decline in price during the year's second half.
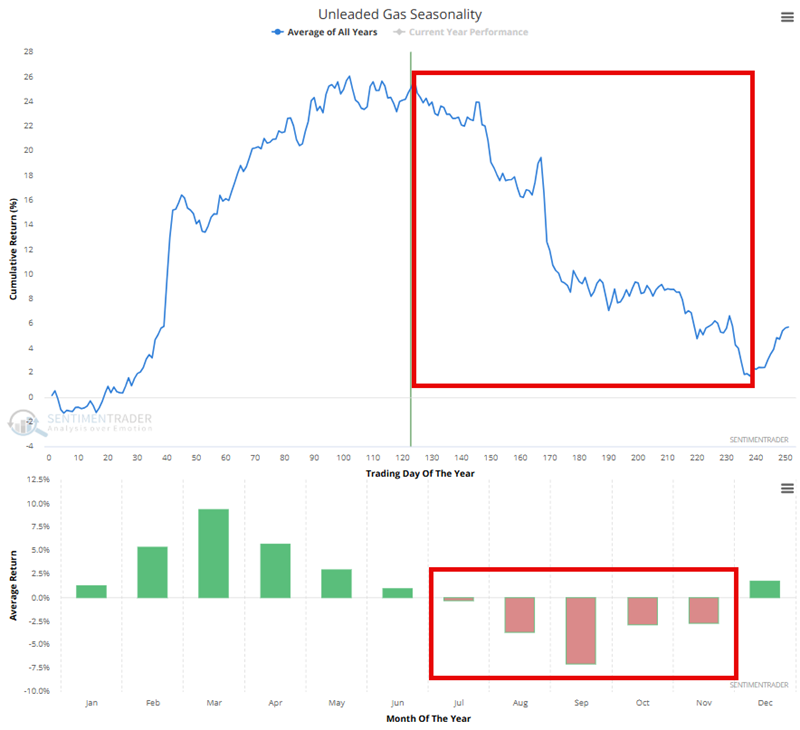 Trading Day of the Year (TDY) #124 through TDY #238 is highlighted in the red box in the upper clip. For 2025, this period extends from the close on 2025-06-25 through 2025-12-04. Also, please keep in mind in the lower clip that July through November has historically been weak. Does this imply that unleaded gas prices will fall in a straight nonstop between now and early December? Not at all. However, it suggests that traders should look for opportunities to play the short side of the market between now and then.
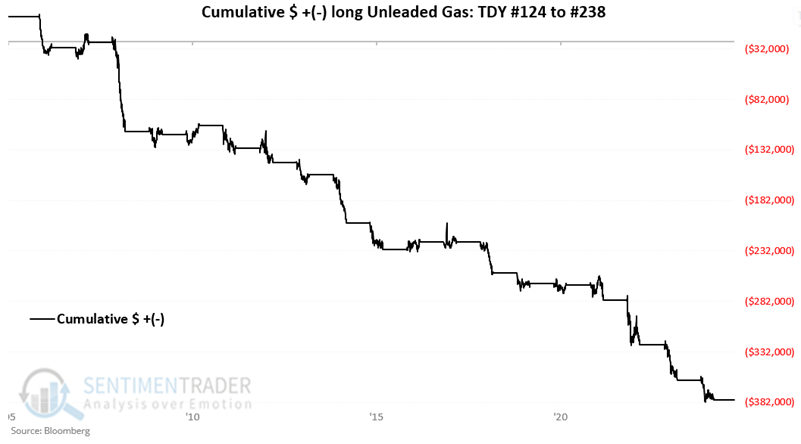
To illustrate the typical nature of Unleaded Gas performance during this period, the chart below displays the hypothetical cumulative $ +(-) achieved by holding a long position in unleaded gas futures only from TDY #124 through TDY #238 since 2007. The results speak for themselves.
The table below summarizes unleaded gas performance during this seasonally unfavorable period.
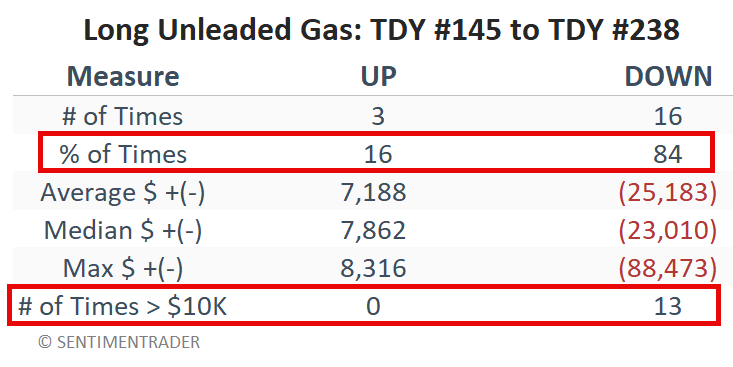
Caveat: Do not discount the potential for a sizeable rally during this supposedly unfavorable seasonal period. Shorting gasoline and forgetting about it until December is folly and an invitation to financial disaster. Nevertheless, the overall results have been decidedly unfavorable, with a 17% Win Rate and thirteen declines over $10K.
Crude Oil Term Structure is another potential factor
The term structure of crude oil futures shows the relationship of the near-term futures contract to a further-out contract. If it is above 1.0, the near-term contract is priced higher than the further-out contract, called backwardation.
So, what does this have to do with Unleaded Gas? Crude and unleaded typically trade with a correlation of somewhere in the 80% to 85% range. So, it is not a stretch to suggest that what affects crude oil also affects Unleaded Gas. The chart below uses Unleaded Gas futures as the index and shows the dates when the Crude Oil Term Structure crossed above 1.05 for the first time in 21 days in the last 15 years. The most recent signal occurred on 2025-06-06.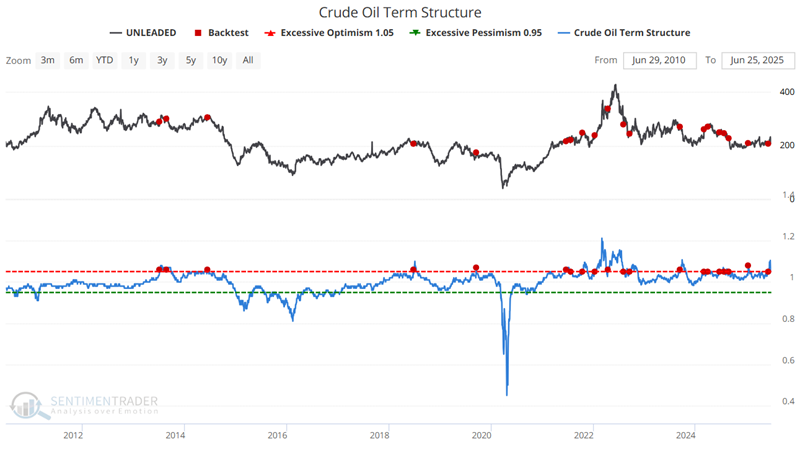 The table below summarizes unleaded gas futures performance and displays signal-by-signal results, not the typically poor performance during the two to six months after a signal.
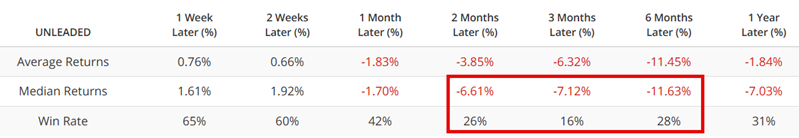
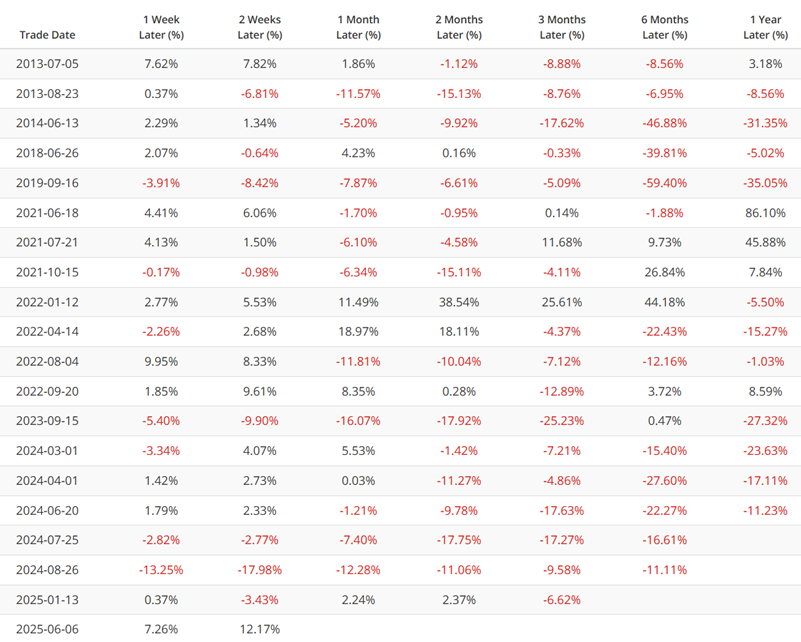
Note the particularly unfavorable tendencies two to six months after a signal. The June 6th signal dovetails with the unfavorable seasonal period highlighted above.
Putting Unleaded Gas Seasonality and Crude Oil Term Structure together
The current situation involves Unleaded Gas seasonality entering the unfavorable TDY #124 to TDY #238 period and Crude Oil's Term Structure crossing above 1.05 for the first time in two months. Let's look at combining these two factors into a simple model.
The indicators for my Unleaded Gas Model (UGM):
A = If the Trading Day of the Year for Unleaded Gas is between TDY #124 and #238, then A = -2, else A = 0
B = If Crude Oil Term Structure crosses above 1.05, then B = -1 for 63 trading days (a subsequent drop below 1.05 followed by another cross above 1.05 would extend the -1 reading for another 63 trading days)
C = A + B
Variable C can range from 0 to -3.
- 0 = Crude Oil Term Structure is neutral; TDY is NOT between #124 to #238 (Favorable for Unleaded)
- -1 = Crude Oil Term Structure is unfavorable; TDY is NOT #124 to #238 (Favorable for Unleaded)
- -2 = Crude Oil Term Structure is neutral; TDY is between #124 to #238 (Unfavorable for Unleaded)
- -3 = Crude Oil Term Structure is unfavorable; TDY is between #124 to #238 (Unfavorable for Unleaded)
Let's look at Unleaded Gas performance depending on the current reading for the Unleaded Gas Model.
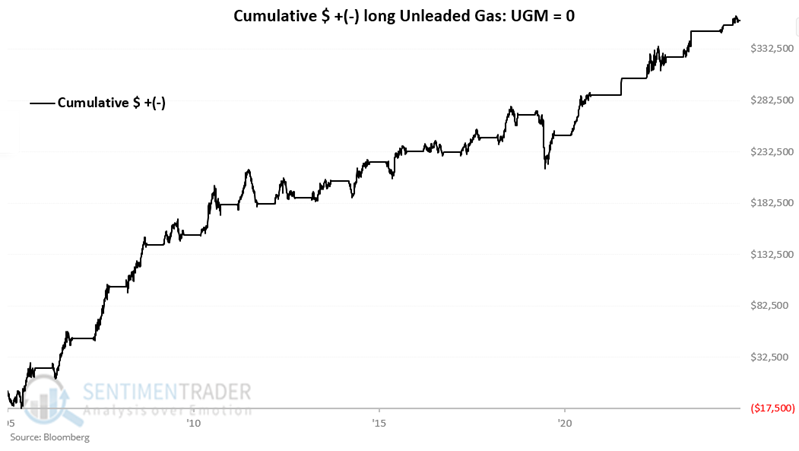
UGM = 0
The chart below displays the hypothetical cumulative $ +(-) from holding a long position in Unleaded Gas futures if the model = 0. The hypothetical gain is +$360,587.
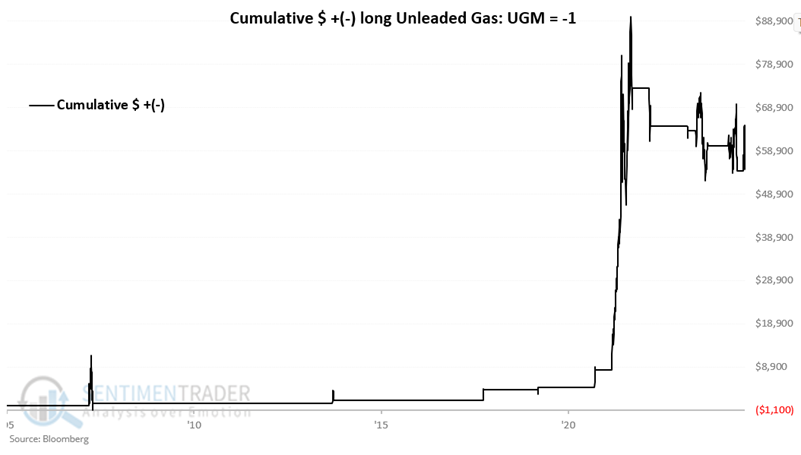
UGM = -1
The chart below displays the hypothetical cumulative $ +(-) from holding a long position in Unleaded Gas futures if the model = -1. The hypothetical gain is +$54,579.
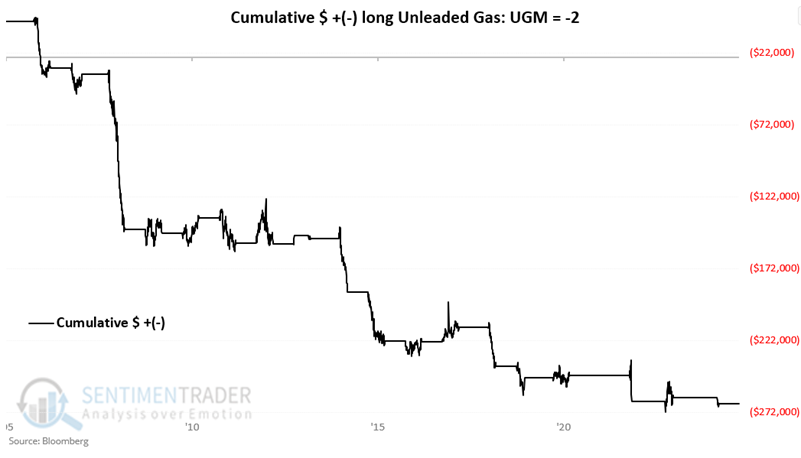
UGM = -2
The chart below displays the hypothetical cumulative $ +(-) from holding a long position in Unleaded Gas futures if the model = -2. The hypothetical loss is -$266,066.
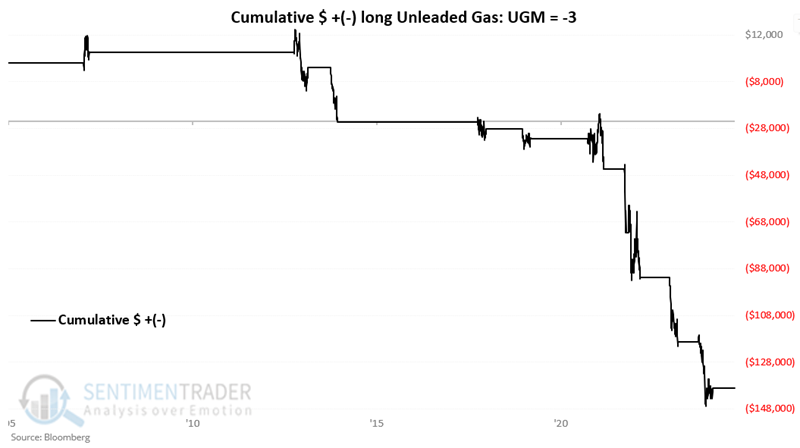
UGM = -3
The chart below displays the hypothetical cumulative $ +(-) from holding a long position in Unleaded Gas futures if the model = -3. The hypothetical loss is -$139,003.
The table below summarizes results for Unleaded Gas futures based on the reading for the Unleaded Gas Model (UGM)
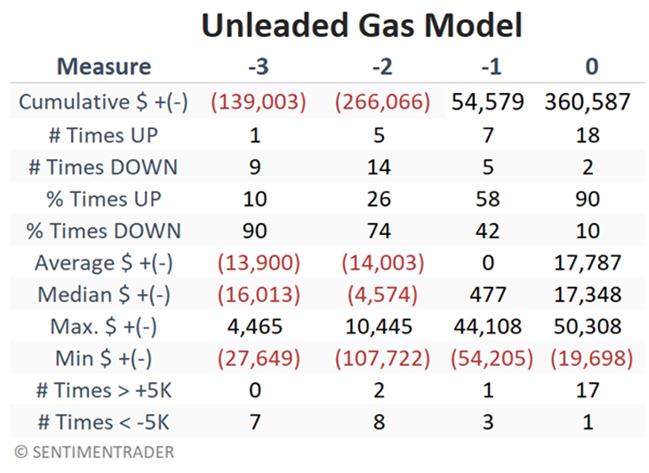
Where are we now?
The UGM dropped from -1 to -3 at the close on 2025-06-25, essentially changing the model from "favorable" to "unfavorable."
The UGM will stay at -3 until the close on 2025-09-04 (when the 63 trading day counting period for Crude Oil Term Structure signal runs out) UNLESS our Crude Oil Term Structure indicator crosses back above 1.05 between now and then (which would extend the "unfavorable" rating for Variable B another 63 days). Barring another Crude Oil Term Structure signal, the model would revert to a still unfavorable (BUT slightly less relentlessly unfavorable; i.e., a 26% Win Rate during -2 readings versus a 10% Win Rate during -3 readings) -2 reading on 2025-09-04.
What the research tells us…
At the present moment, geopolitical events have the potential to cause gas prices to rise sharply. That said, the factors discussed above suggest that well-capitalized traders ignore the "New noise" and view any price weakness as a potential opportunity to play the short side of Unleaded Gas futures in the months ahead (with appropriate risk controls in place).