
Housing indicators flash a warning sign

Key points
- Housing Starts and Housing Permits both ticked lower in the latest month
- These measures are often a good bellwether for the homebuilding sector and the broader market
- With both measures below their respective 12-month exponential moving averages, housing as a market factor will fall on the unfavorable side of the weight of the evidence ledger at the end of April
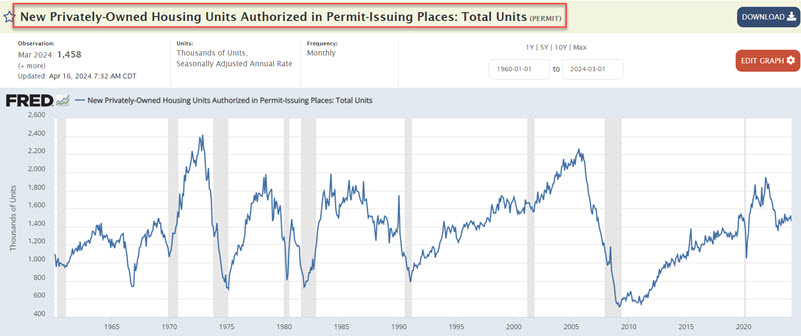
Housing Permits tick back to the downside
Housing permits (technically known as New Privately-Owned Housing Units Authorized in Permit-Issuing Places: Total Units) also ticked lower in the latest monthly update. During April, the number of housing starts for March was reported. We technically evaluate this data at the end of the month in which the data is reported. The chart below displays the raw data from FRED.
The chart below displays the number of housing permits issued in the most recently reported month and a 12-month exponential moving average.
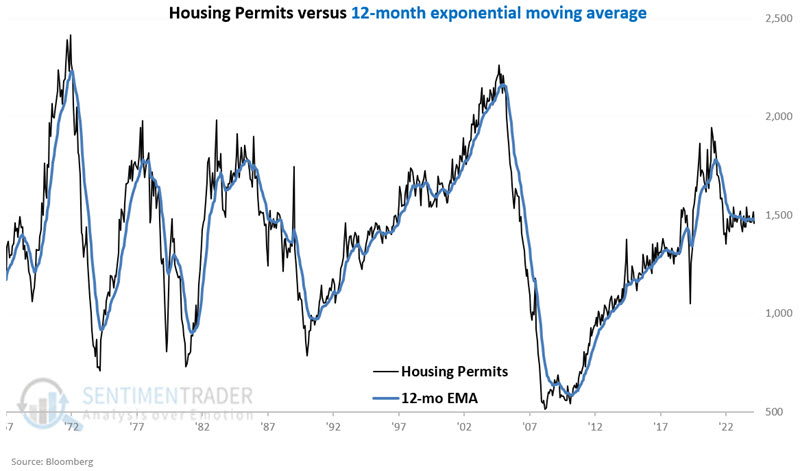
We add a 12-month exponential moving average to discern a trend, as shown in the chart below. Interpretation is pretty straightforward:
- Above = Good
- Below = Bad
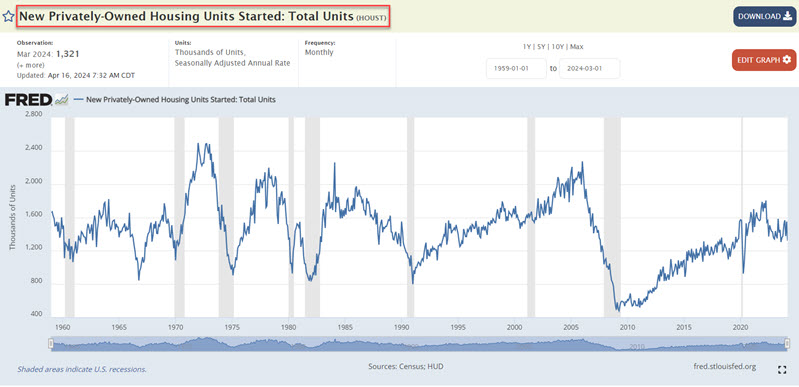
Housing Starts also tick lower
Housing Starts (technically known as New Privately-Owned Housing Units Started: Total Units) ticked lower in the latest monthly update. The number of housing starts for March is reported in April. We technically evaluate this data at the end of the month in which the data is reported. The chart below displays the raw data from FRED.
We add a 12-month exponential moving average to discern a trend, as shown in the chart below.
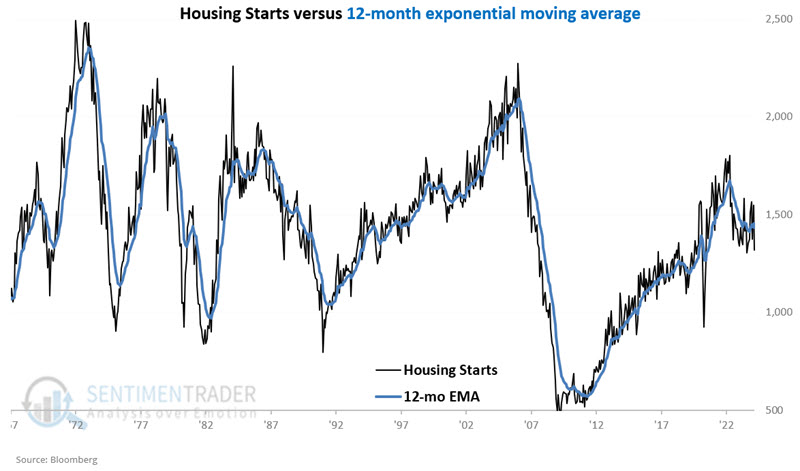
A look at the far-right-hand side of the chart above reveals that the monthly readings have bounced above and below the moving average in recent months. Nevertheless, given the latest reading, at the end of April, this indicator will be deemed "unfavorable" for homebuilders and the broader market for May.
Combining the two indicators
Unsurprisingly, the two data series above are similar but also not as closely joined at the hip as one might expect. For the record, the correlation of monthly readings between the two data series is roughly 68%.
The indicators above are not considered "trading signals" or "trading systems" per se. A rise above the moving average does not necessarily constitute an "automatic" buy sign"l for a stock. Still, there is potential value in following these indices.
If at least one of the two data series exceeds its 12-month EMA, it bodes well for homebuilders, the broader market, and the overall economy.
Focusing on homebuilders
We will use Fidelity Select Construction and Housing Portfolio (ticker FSHOX) to test homebuilding stocks. For the record, FSHOX is a managed fund, but it has a history back to 1986 and a roughly 96% correlation to the SPDR Home Builders ETF (XHB) and a 93% correlation to the iShares Dow Jones Home Construction ETF (ITB).
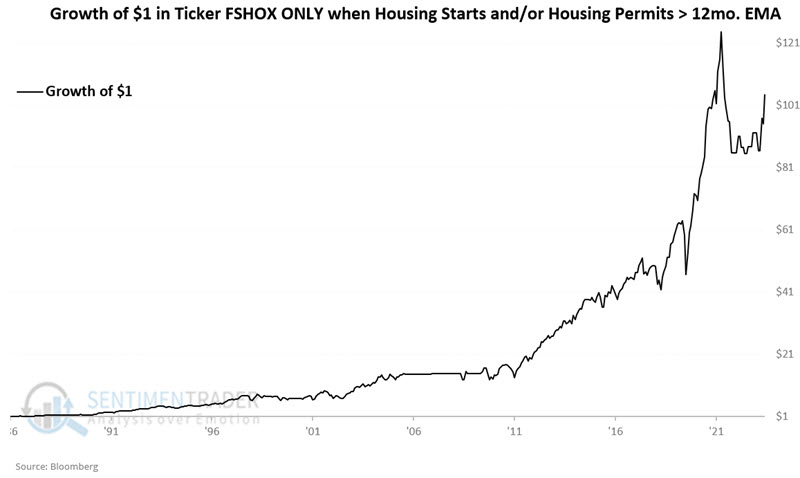
The chart below displays the growth of $1 invested in ticker FSHOX only when one or more of the housing indicators above are favorable. Since 1986, $1 invested in this manner hypothetically grew to $104.
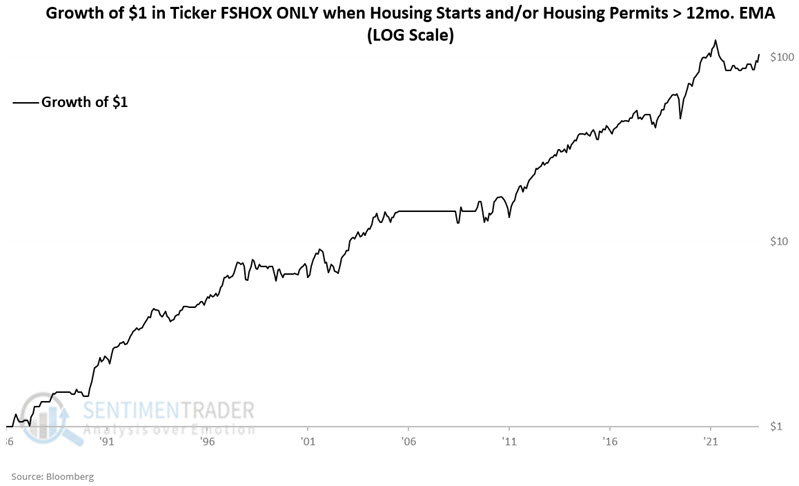
The chart below displays the same information on a logarithmic scale.
Now, let's look at homebuilder performance when both indicators are unfavorable. The chart below displays the growth of $1 invested in ticker FSHOX when both housing indicators above are unfavorable. Since 1986, $1 invested in this manner hypothetically shrank to $0.89.
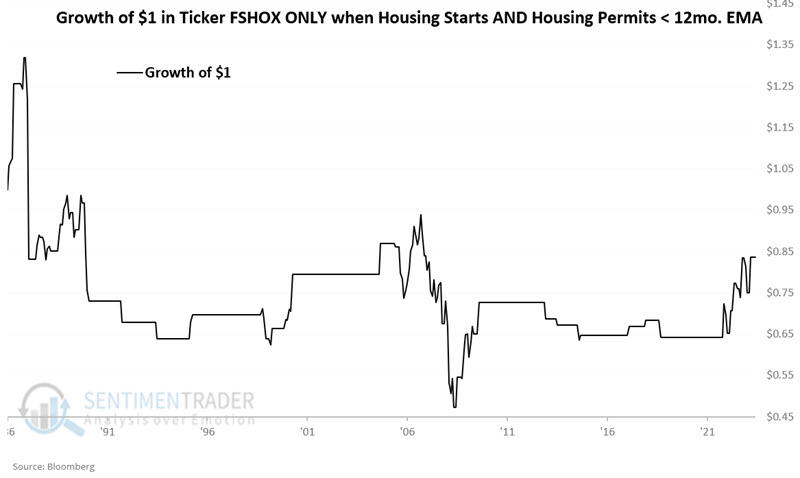
As you can see in the chart above, sometimes FSHOX manages to work its way higher (including during the last year), even if both indicators are unfavorable. However, the bulk of historical bearish activity in this sector - including the Crash of 1987 and the bear markets in 1990 and 2008 unfolded when these indicators were signaling trouble.
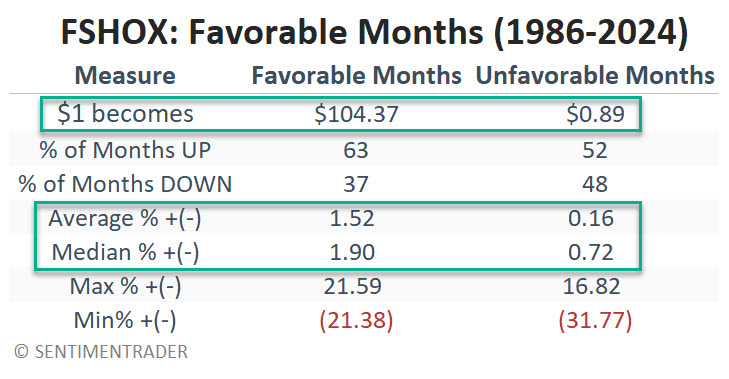
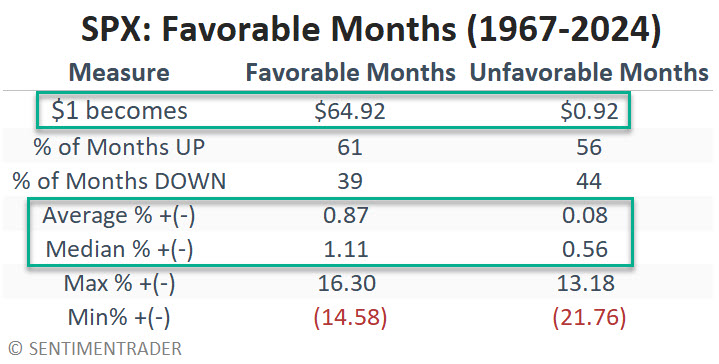
To sum up, the trend is deemed favorable if either Housing Starts or Housing Permits are above their respective 12-month EMA at the end of a given month. The trend is considered unfavorable if BOTH Housing Starts and Housing Permits are below their respective 12-month EMA at the end of a given month. The table below summarizes FSHOX performance during favorable and unfavorable months.
With both Starts and Permits below their 12-month EMAs, May 2024 will be deemed "unfavorable" for homebuilders. This does not mean that homebuilder stocks are doomed to decline. It simply means that the probabilities will shift to unfavorable.
A longer-term look at the broader market
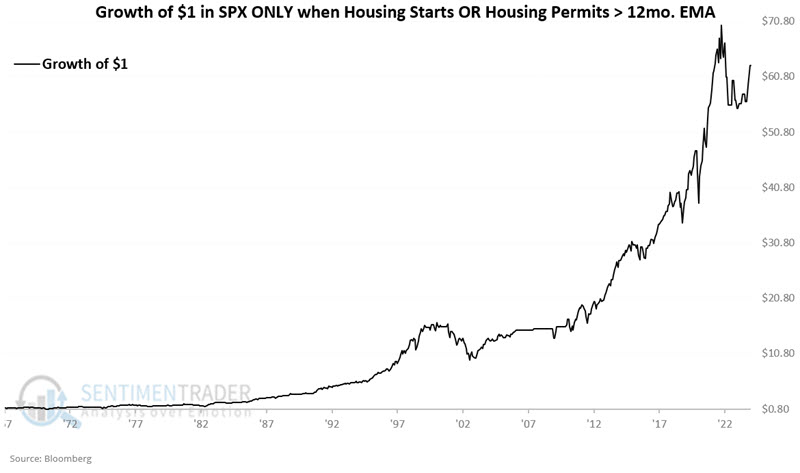
For this test, we will use the S&P 500 Index versus Housing Starts and Housing Permits data from 1967. The chart below displays the hypothetical growth of $1 invested in SPX only when one or both indicators were favorable. $2 invested in this manner since 1967 grew to $62.94.
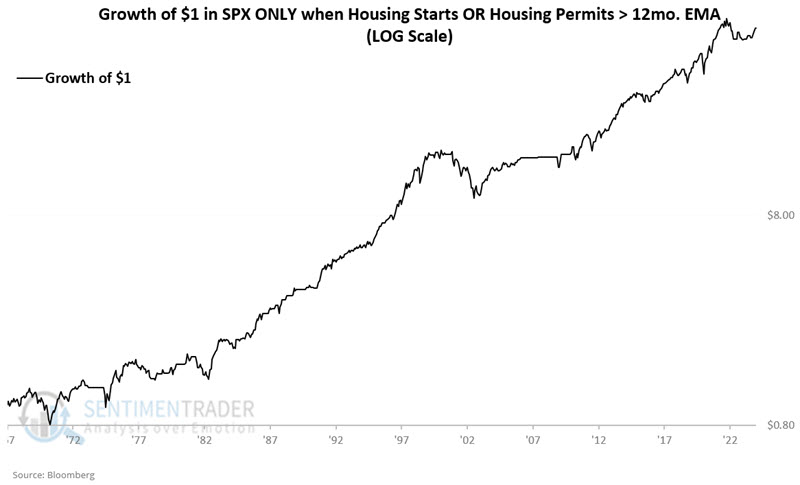
The chart below displays the same information on a logarithmic scale.
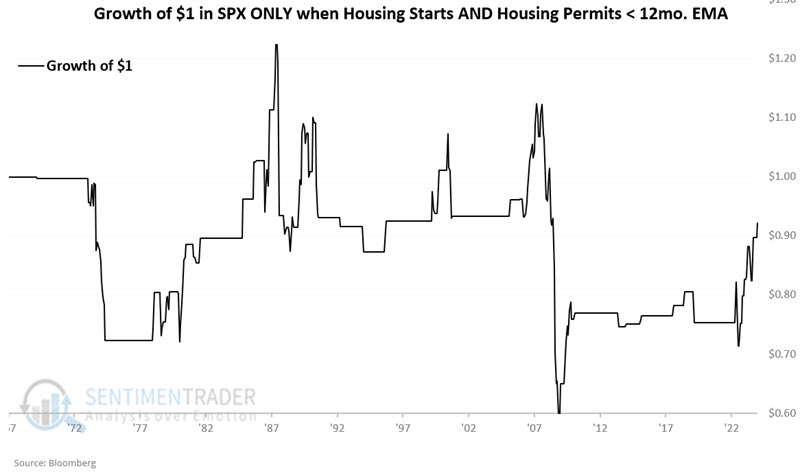
The chart below displays the growth of $1 invested in SPX only when both housing indicators were unfavorable.
The table below summarizes S&P 500 performance based on the status of the two housing indicators.
What the research tells us…
Housing Starts and Housing Permits dropped below their respective 12-month EMAs in the latest monthly data release. We look at this data on a month-end basis. Based on this action, both data series are deemed unfavorable. As a result, the rudimentary model highlighted in the text above is considered unfavorable as of the end of April 2024. Does this mean the homebuilder sector and the broader market will decline during May and possibly beyond? Not at all. Many factors influence the overall market and any individual sector. These results do, however, remove one item from the bullish side of the weight of the evidence ledger and move it to the unfavorable side.