
Hold the line with energy stocks

Key points:
- A trading model that uses the RSI indicator for absolute and relative trends triggered a new buy signal
- Integrated Oil & Gas stocks have rallied 70% of the time after other signals
- If I conclude a trend filter, Integrated Oil & Gas stocks have rallied 79% of the time after other signals
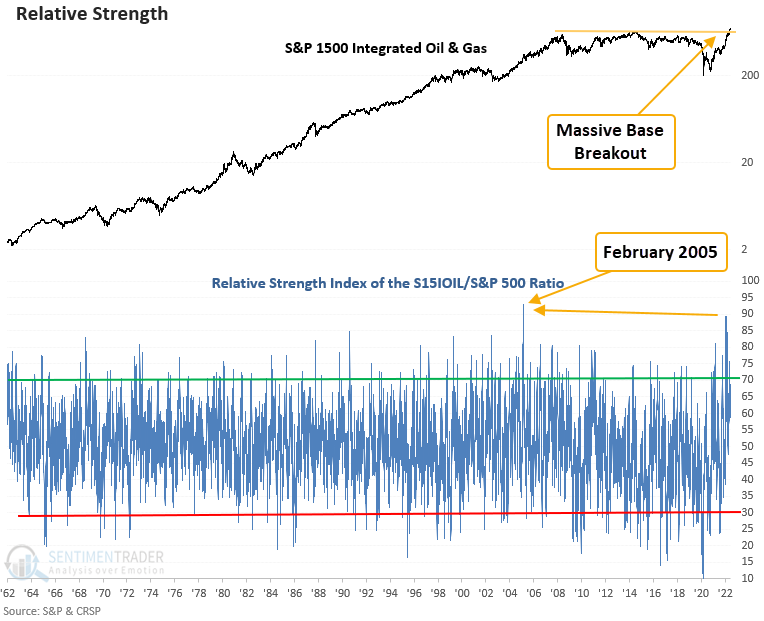
The Relative Strength Index (RSI) indicator
The relative strength index (RSI), developed by J. Welles Wilder Jr., measures price momentum for stocks, indexes, or other assets. However, one can apply the indicator to almost any time series. I like to use the RSI indicator on the ratio between two securities to identify relative strength trends. When the RSI ratio exceeds 70, the relative momentum trend is positive. Conversely, the relative momentum trend is negative when the RSI ratio falls below 30. I view an overbought signal as a positive development, which runs counter to conventional wisdom amongst most traders. i.e., positive momentum begets more positive momentum.
The RSI ratio indicator for Integrated Oil & Gas surged to the second-highest level in history in January 2022 and continues to maintain a bullish trend range.
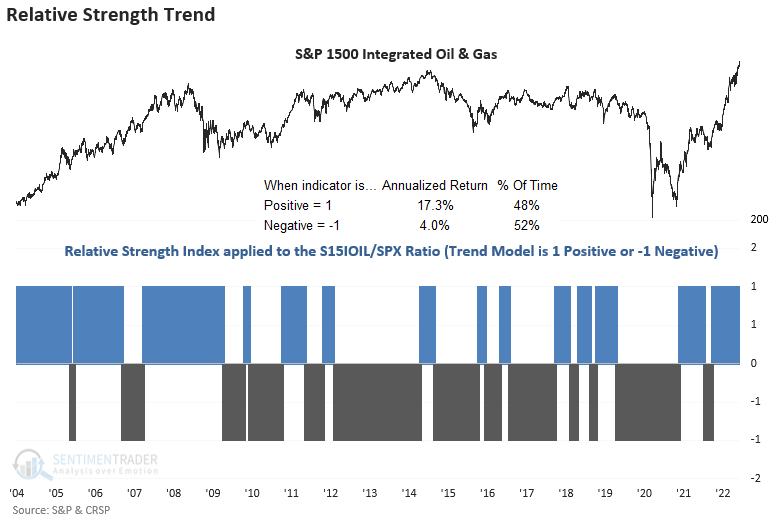
The Relative Strength Index (RSI) ratio trend for Integrated Oil & Gas
The 2004-22 bull and bear cycles for energy stocks highlight the importance of relative strength. Favorable RSI ratio trend conditions show significantly higher annualized returns for the Integrated Oil & Gas industry, with a return of 17.3%. In contrast, when the RSI ratio trend is negative, the industry annualizes at 4.0%.
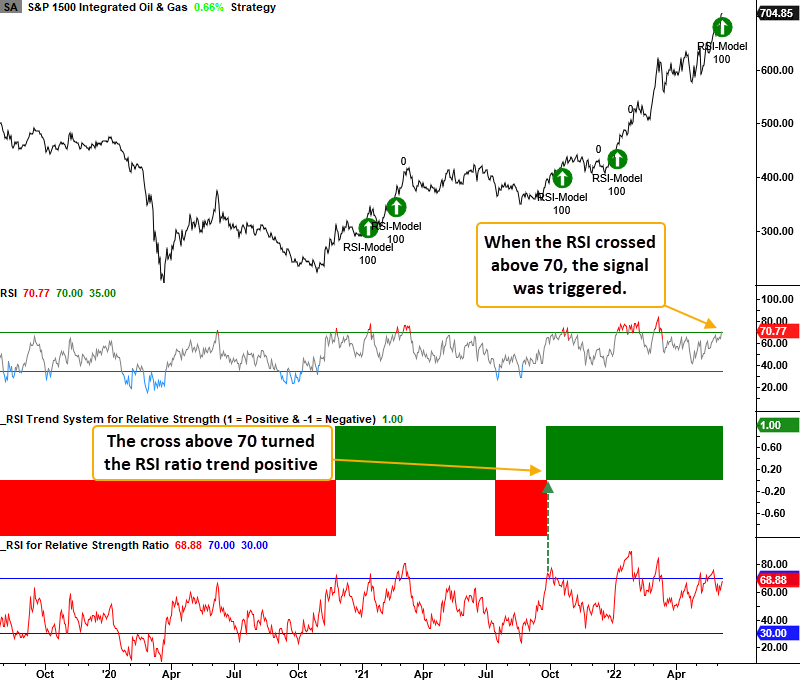
How the trading model works
The RSI trading model is simple. When the RSI ratio trend is positive, the model generates a new buy signal when the RSI indicator for the underlying stock, index, or ETF crosses above 70. At the same time, the 5-day rate of change must be positive. I use a reset to screen out duplicate signals by requiring the RSI to fall below a user-defined level before a new alert can trigger again. The RSI condition ensures that we buy solid absolute and relative trends. I want to avoid buying the best house in a lousy neighborhood. i.e., relative winners in protracted downtrends.
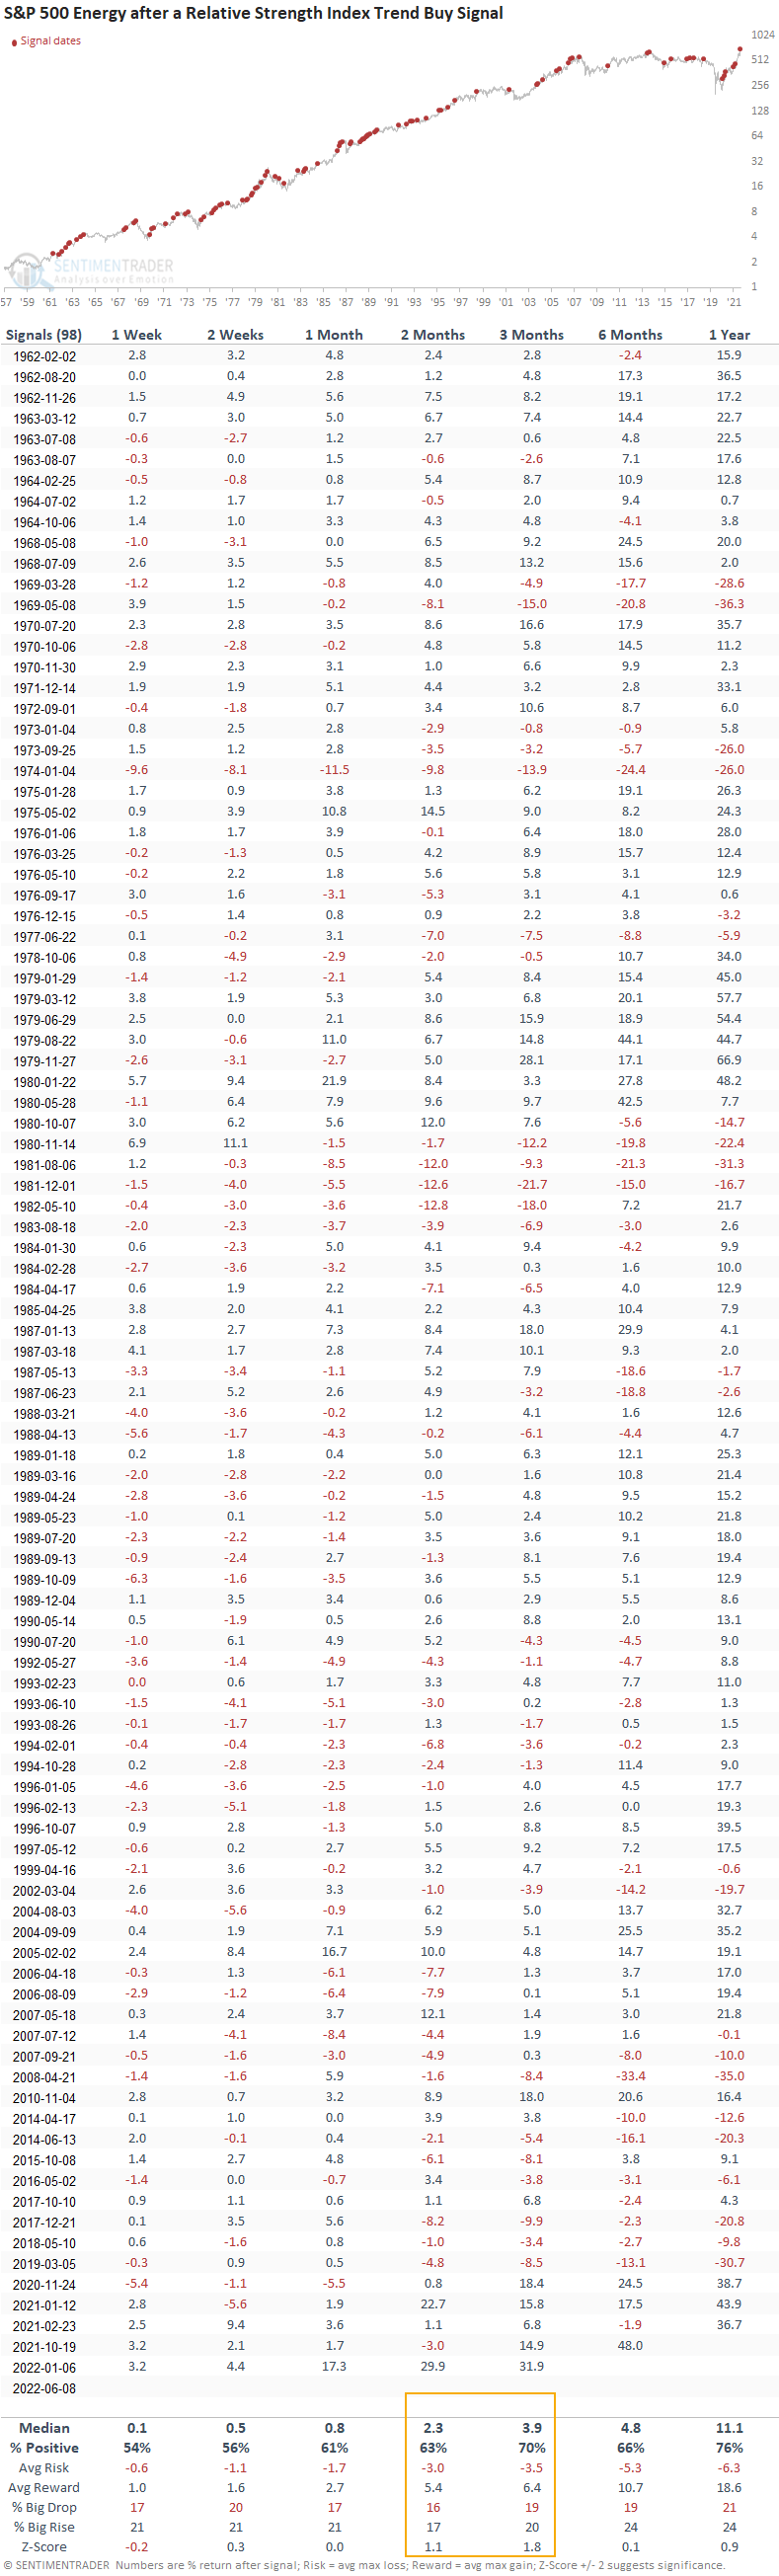
Similar relative strength signals have preceded gains 70% of the time
This signal occurred 98 other times over the past 60 years. After the others, Integrated Oil & Gas stocks' future returns, win rates, and risk/reward profiles were solid across medium and long-term time frames. Since 2008, the model shows a positive return at some point in the first 2 months for 15 consecutive signals.
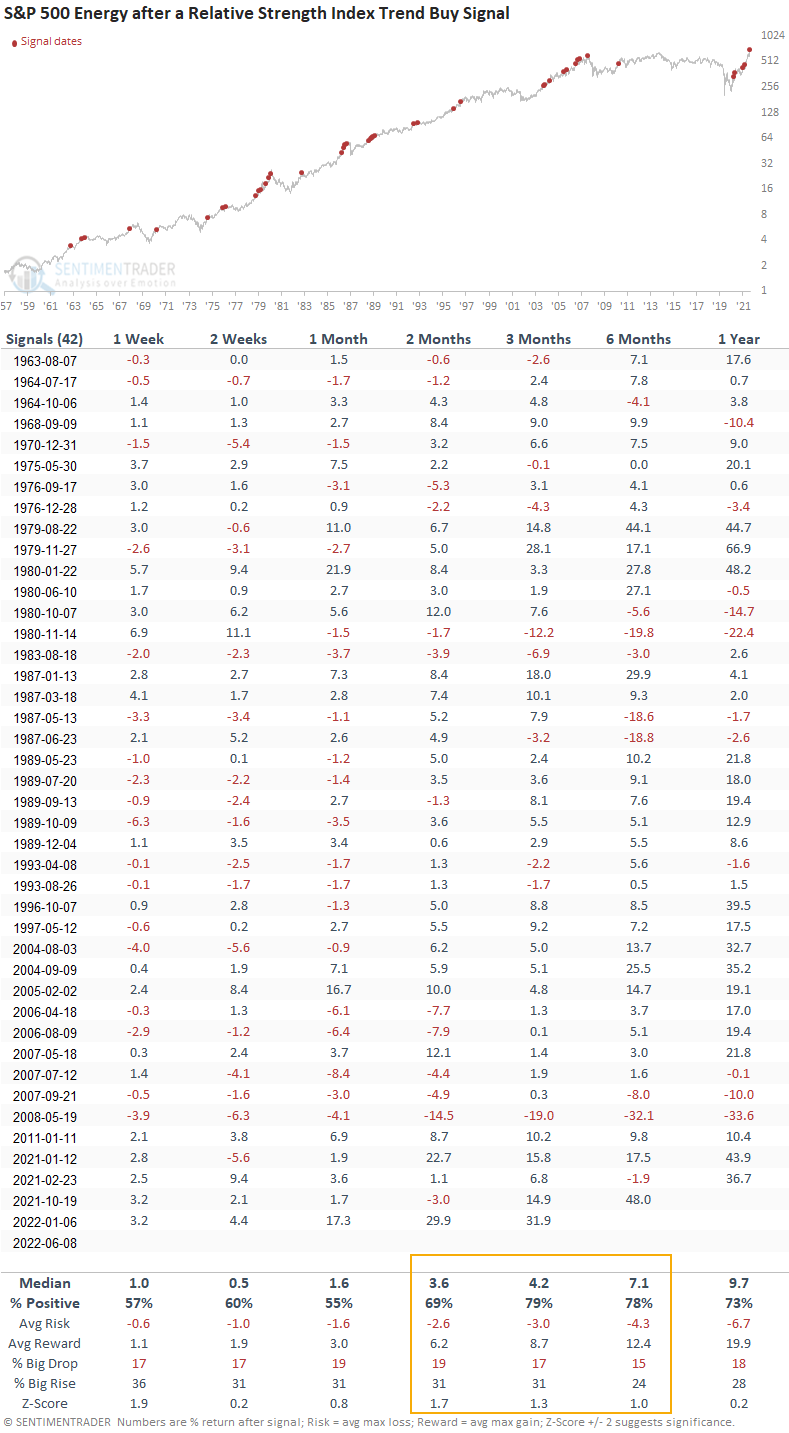
Similar relative strength signals have preceded gains 79% of the time
Let's add some context to the signal. I will now require 90% or more of S&P 500 energy members to have a rising 200-day moving average at the time of an alert. The trend filter signals occurred 42 other times over the past 59 years. After the others, Integrated Oil & Gas stocks' future returns, win rates, and risk/reward profiles were solid across medium-term time frames. Consistency in the 3 and 6-month windows is excellent.
Energy stock momentum begets more momentum
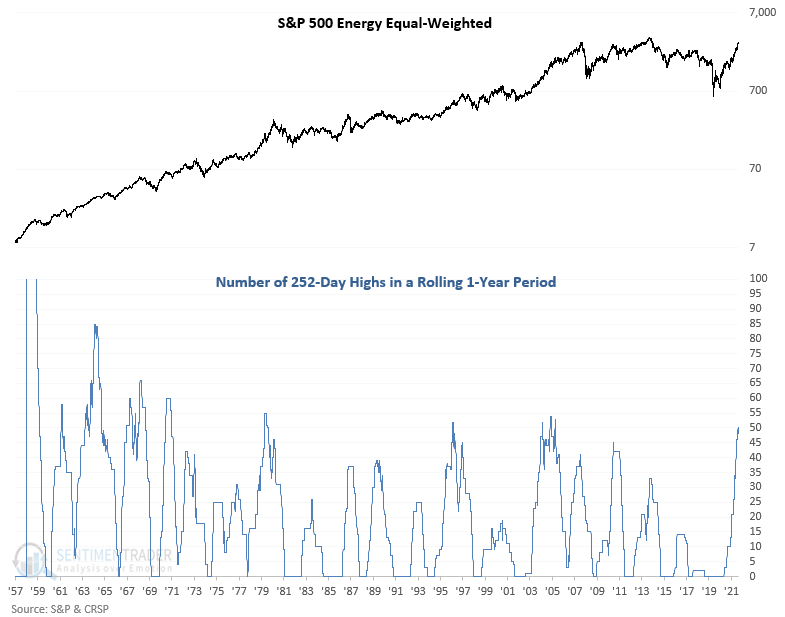
The number of 252-days highs in the trailing 1-year period for the equal-weighted S&P 500 energy sector recently crossed above 50. The prior first cross above 50 occurred near the outset of the last energy bull market in November 2004. Let's assess the outlook for energy stocks after similar signals.
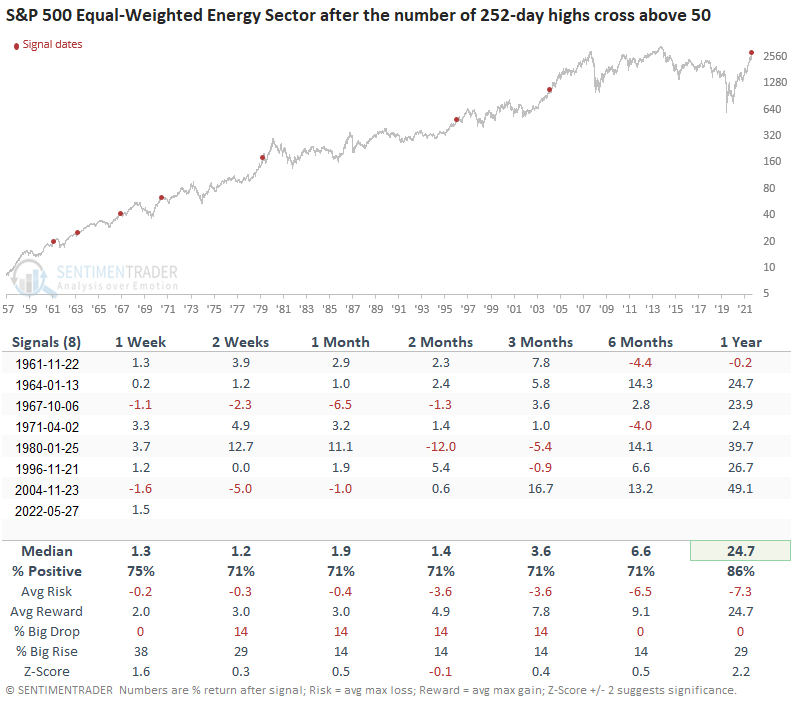
A high level of 252-day highs is bullish for energy stocks
When the number of 252-day highs for the equal-weighted energy sector cross above 50, the bullish trend backdrop continues. A year later, the sector was higher in 7 out of 8 cases. The lone loss in 1961 was minuscule, and one had ample time to make a profit based on the 3-month return.
What the research tells us...
When my RSI ratio trend model is positive, and the RSI indicator crosses above 70, absolute and relative price momentum begets more momentum. Similar setups to what we're seeing now have preceded rising prices for Integrated Oil & Gas stocks, especially on a medium-term basis. If you're worried that energy stocks have come too far too fast, which may be the case in the near term, the 252-day high study should provide some comfort concerning the long-term structural bull cycle.