
History suggests commodities may be due for a breather

Key Points
- Commodities have been red-hot in 2022, with most "basket of commodities" ETFs up anywhere from 22% to over 40% for the year
- The annual seasonal pattern for the CRB Commodity Index suggests that the rest of the year will see more tepid results
- Energies and grains have been primary drivers for commodity gains so far this year
- The seasonal trends for most grains and energies are about to become much less favorable
Commodities on a tear in 2022
Through May 23rd, the Bloomberg Commodities Spot Price Index was up +33% for the year. These results were fueled primarily by huge gains in the energy and grain sectors. Unfortunately, the components of these sectors are about to enter less favorable seasonal periods. Given that seasonality is "climate, not weather", these markets may continue to move to the upside. But the charts below suggest that commodity traders adjust their expectations for the remainder of the year.
Let's look at our seasonality charts to get a sense of how outsized the gains so far this year have been - and to get a glimpse of why things may cool off as the year progresses.
2022: Outsized gains compared to normal
Below you will find two charts for each of the following markets - crude oil, unleaded gas, natural gas, corn, soybeans, and wheat.
The top chart in each pair displays the annual seasonal trend for that commodity and a red box highlighting a period of typical seasonal weakness. The bottom chart shows the same blue line (annual seasonal trend) but also overlays the actual performance this year - to highlight the far above average nature of this year's action.
Crude Oil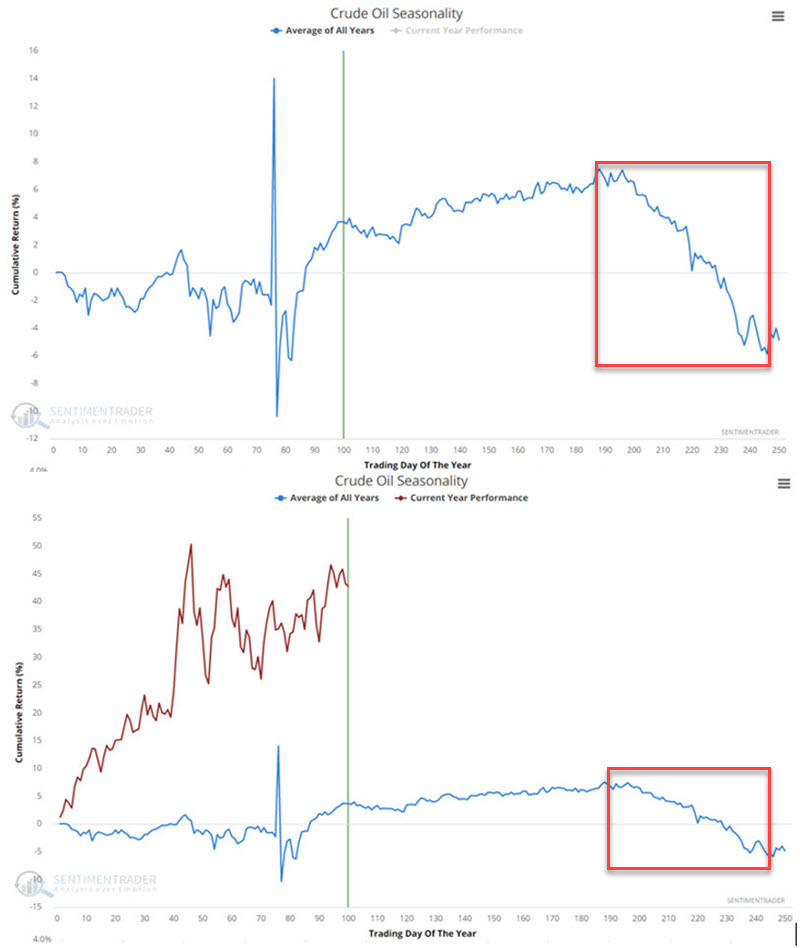
Unleaded Gas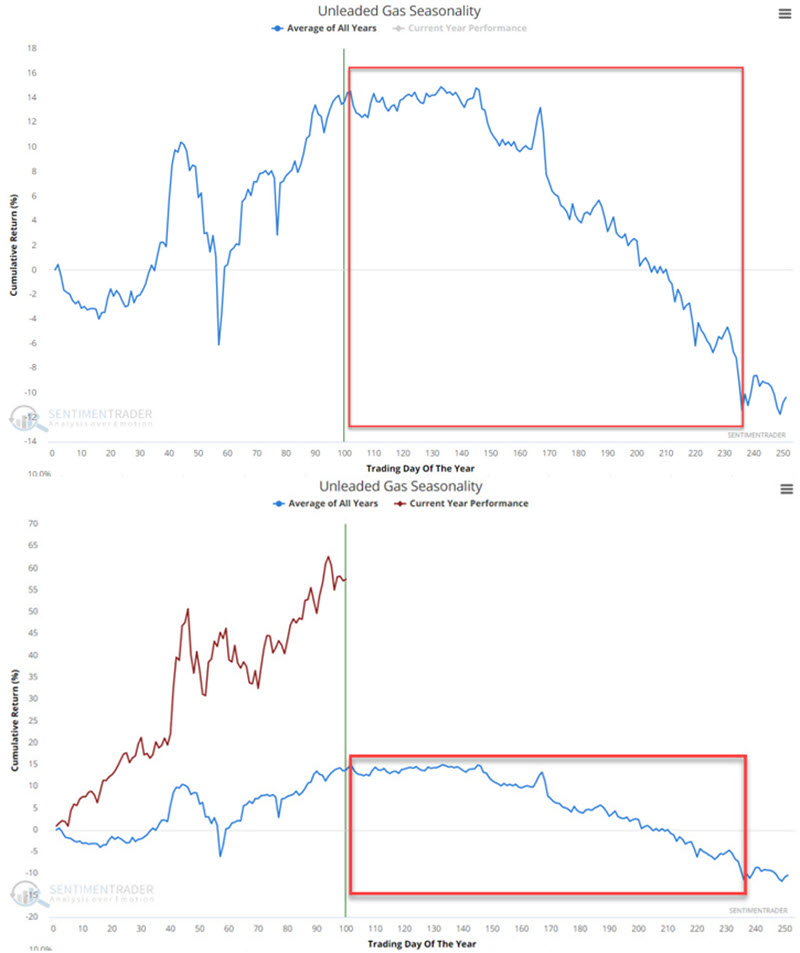
Natural Gas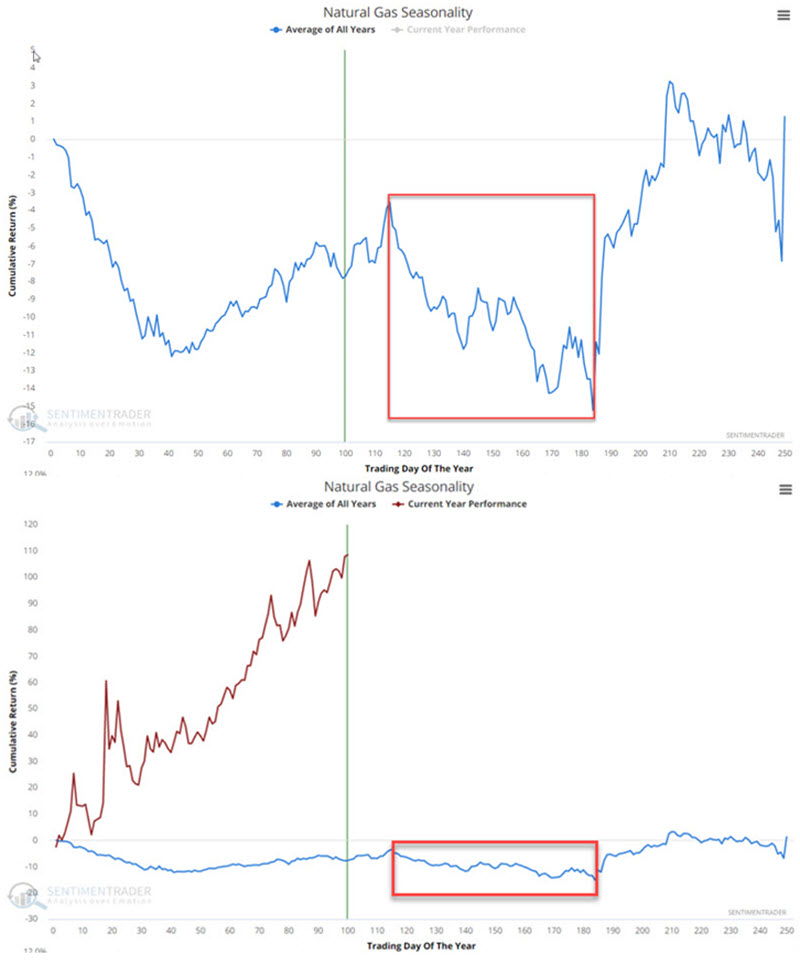 Corn
Corn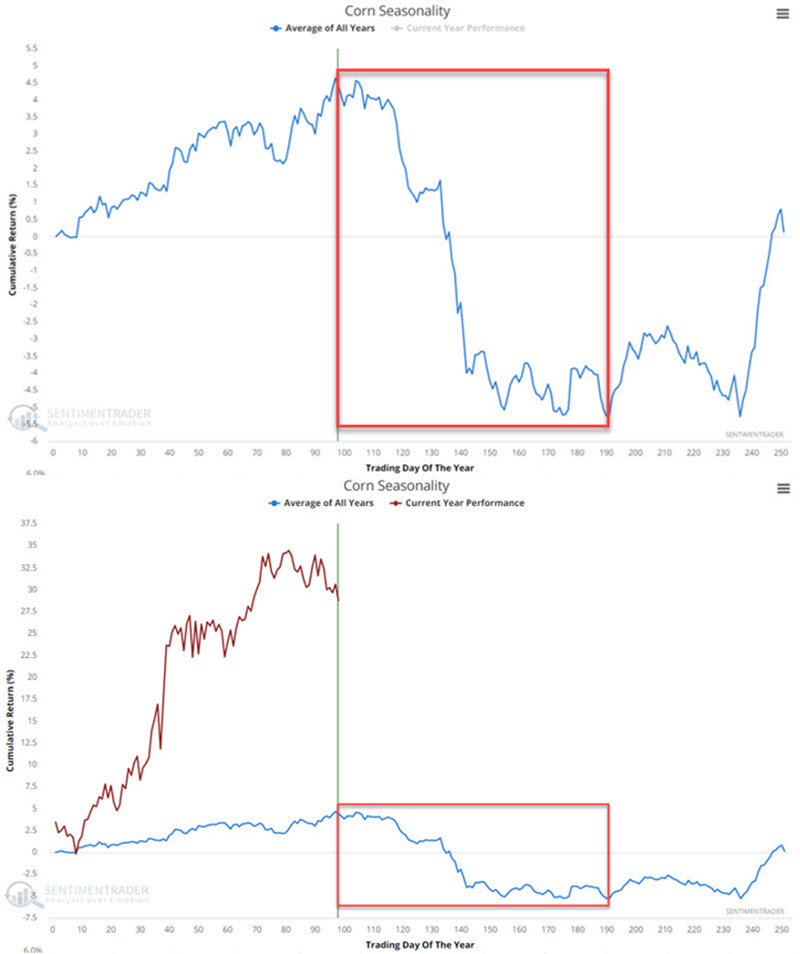 Soybeans
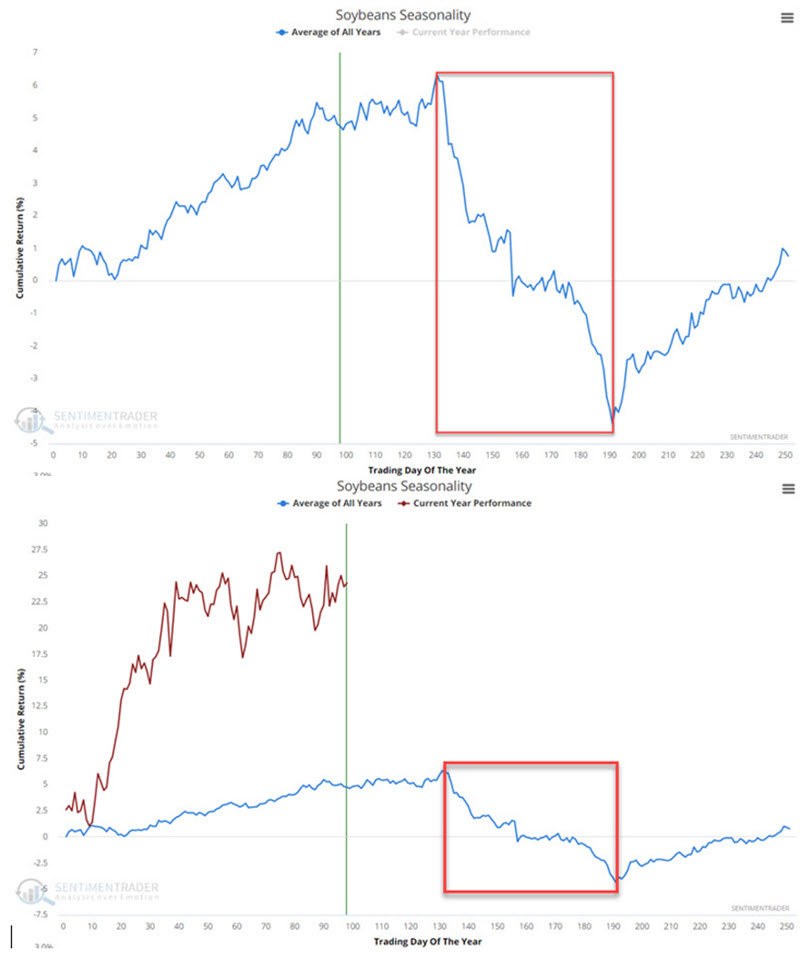 Wheat
Wheat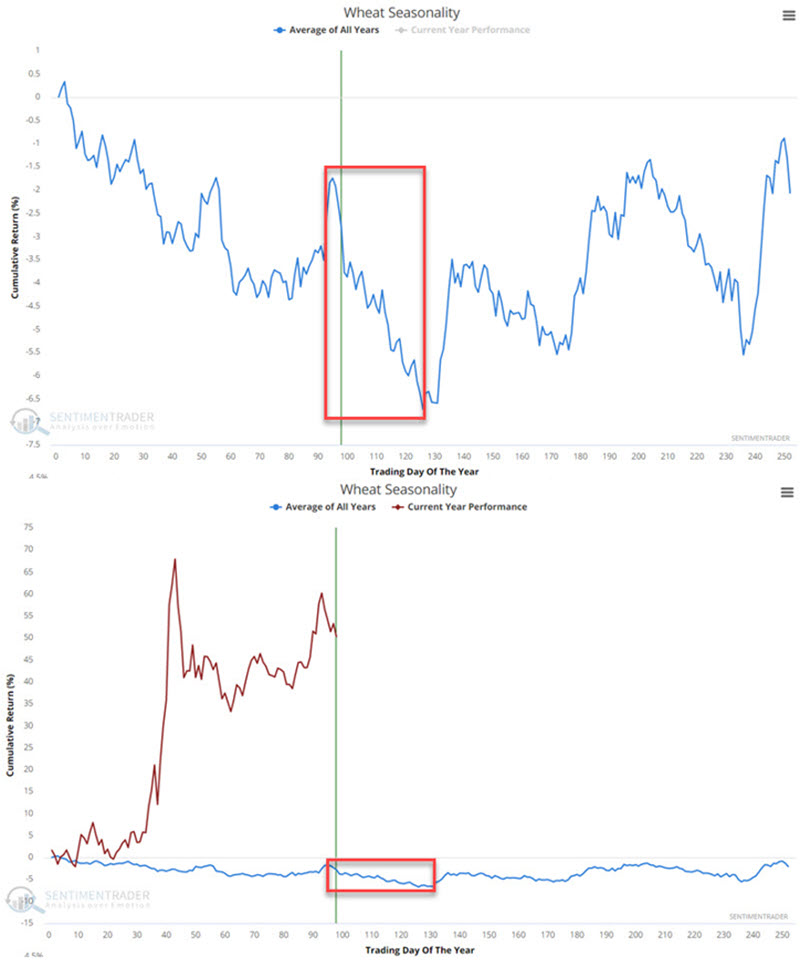 Commodities as an asset class
Investors who want to participate in commodities as an asset class can now do so via various ETFs and ETNs, rather than having to trade commodity futures. Some choices include tickers PDBC, DBC, GSG, DJP, and GCC.
Let's look at overall commodity performance when considered as an asset class. The chart below displays the annual seasonal trend for the CRB Index. 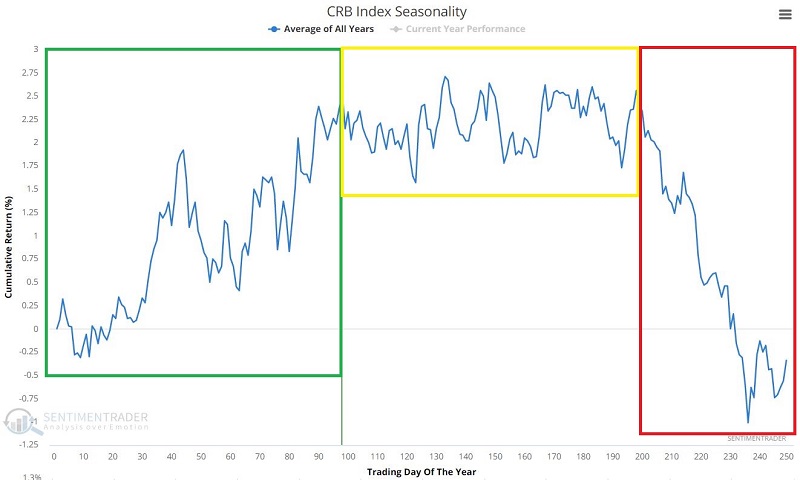
Note the tendency for:
- Strength during the first part of the year
- Choppy market action during the middle of the year
- Significant weakness late in the year
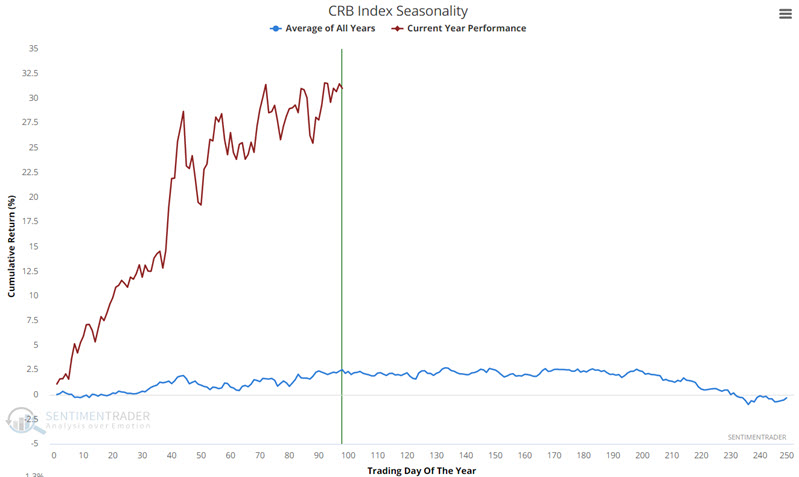
Commodities have indeed exhibited strength during the first part of 2022. To get a sense of just how strong they have been compared to normal, the chart below displays the same blue line as the chart above (annual seasonal trend) as the actual performance of the CRB Index so far this year (red line). A tendency for strength, indeed.
Through the years
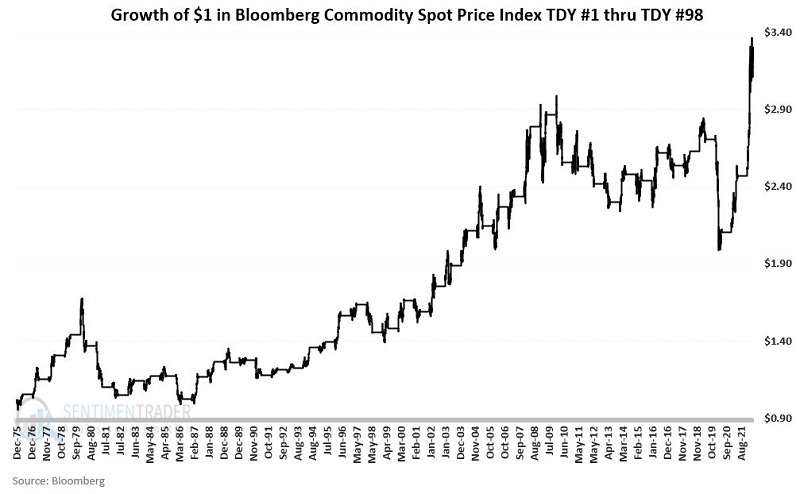
Let's look individually at each of the three parts of the year highlighted earlier. The chart below displays the hypothetical growth of $1 invested in the CRB Index only during the first 98 trading days of the year each year, starting in 1976.
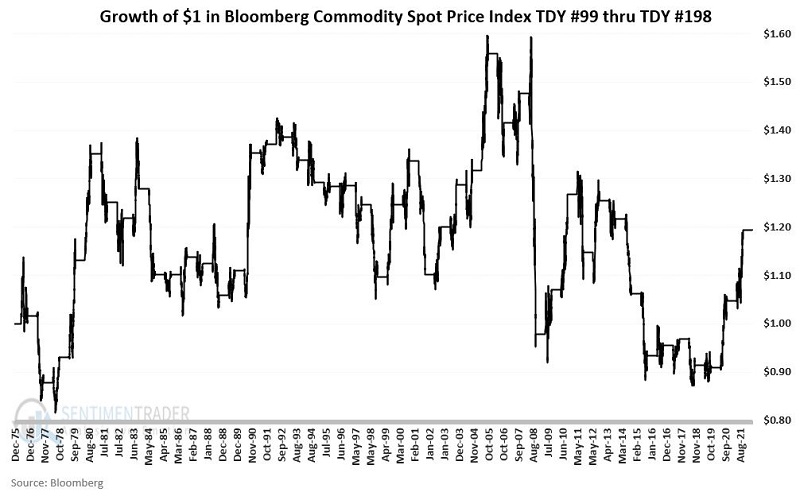
The chart below displays the hypothetical growth of $1 invested in the CRB Index only during trading day of the year #99 through trading day of the year #198 each year starting in 1976.
The chart below displays the hypothetical growth of $1 invested in the CRB Index only during trading day of the year #199 through the end of the year.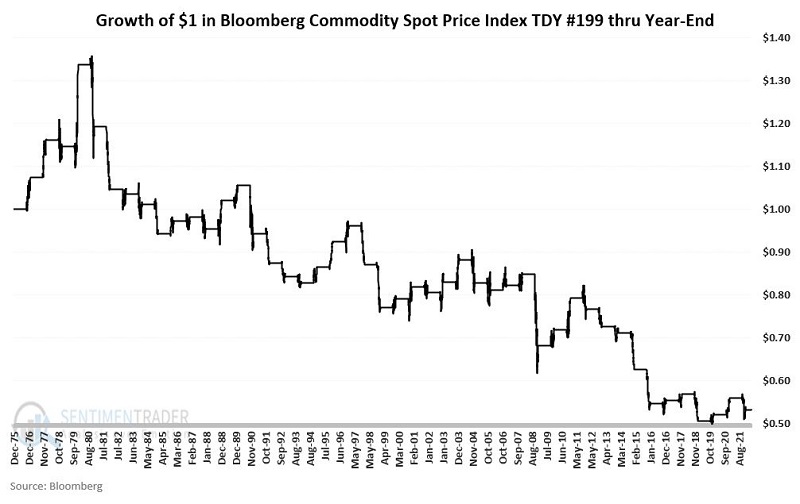
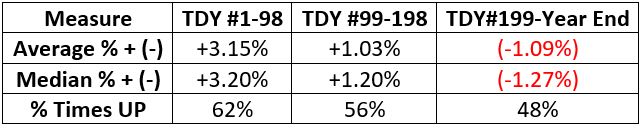
The table below displays a summary of CRB Index performance across each intra-year period since 1976.
What the research shows…
Seasonal tendencies can be pretty persistent in the commodities markets. That said, each year is still its own "roll of the dice." The commodities markets have enjoyed significantly well above average returns during the first part of 2022. Given the current level of inflation - a primary driver of the price of many physical commodities - it is possible that further price strength lies ahead. But if the normal seasonal tendencies play out, commodity investors may need to adjust their expectations as the rest of 2022 unfolds.