
Historic Internal Rotation

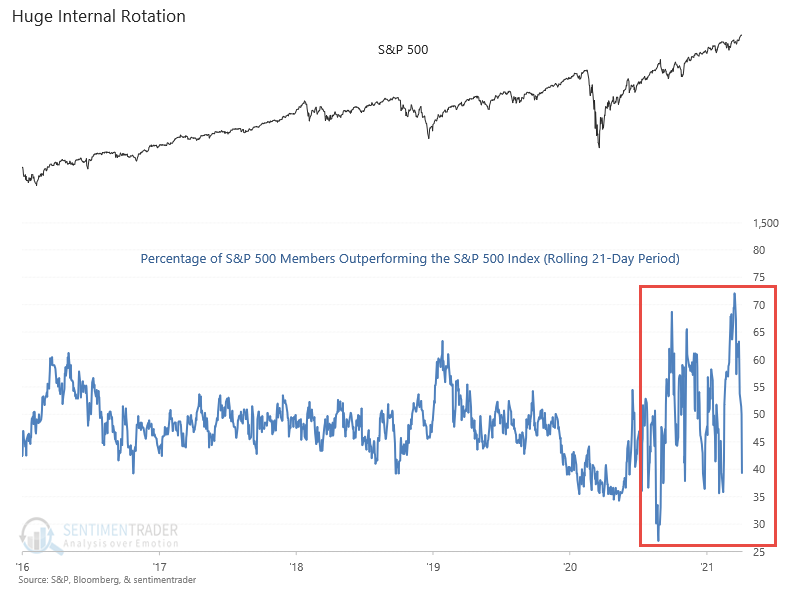
In a note on 1/27/21, I discussed the massive gyrations in the percentage of S&P 500 members outperforming the Index on a rolling 21-day basis. The swings have continued as value-oriented sectors like financials and energy battle the growth-dominated technology sector for leadership status. The battle has become so fierce that the 13-day net change in the percentage of S&P 500 members outperforming the Index just registered the most significant drop in history as the value sectors retreated in an unprecedented manner.
Current Day Chart
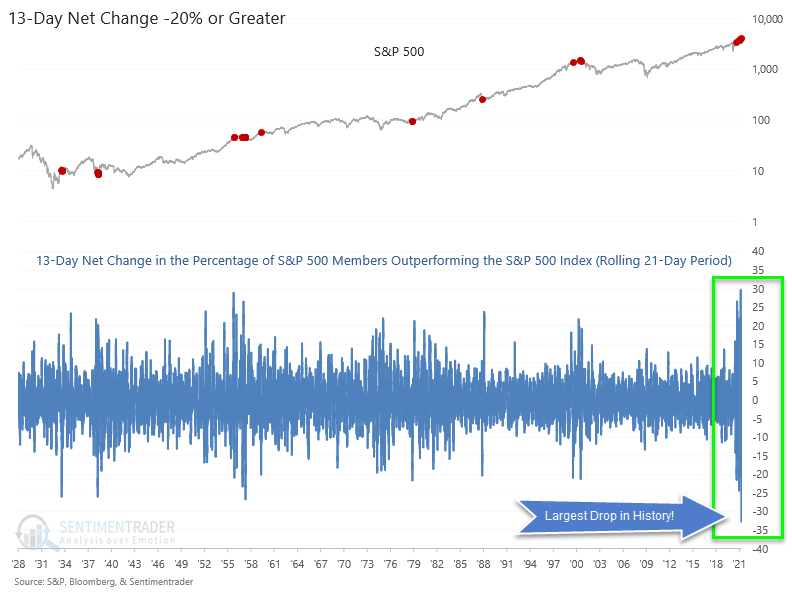
Historical Chart
As the chart below shows, the 13-day net change in the percentage of members outperforming the Index just recorded the most significant drop in history. Massive swings in the indicator almost always occur at important market turning points. The turning point could be from bull to bear or bear to bull.
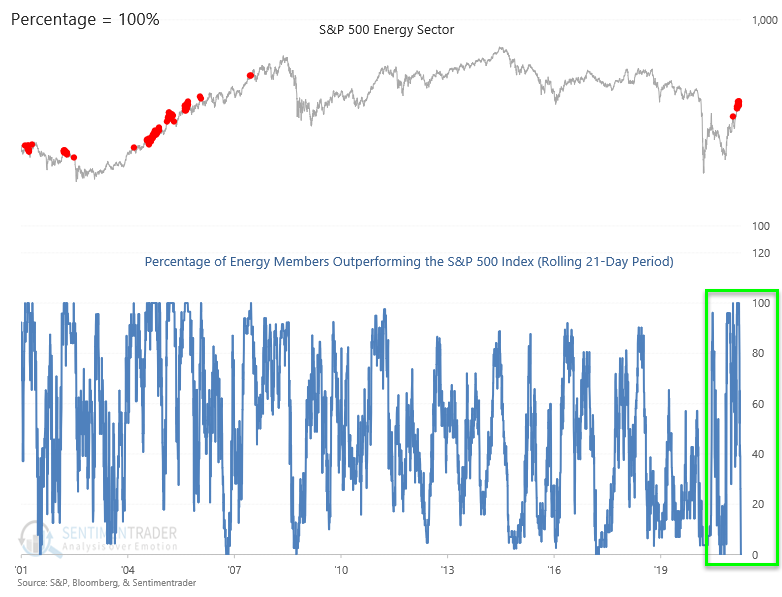
Energy Chart
The chart below highlights how the percentage of energy sector members outperforming the S&P 500 recently completed a swing from 100% to 0% in 12 trading days. If I relax the parameters, I find only one other comparable instance in history when it dropped from greater than 90% to less than 15% in 15 days or less. That instance occurred in July 2000.
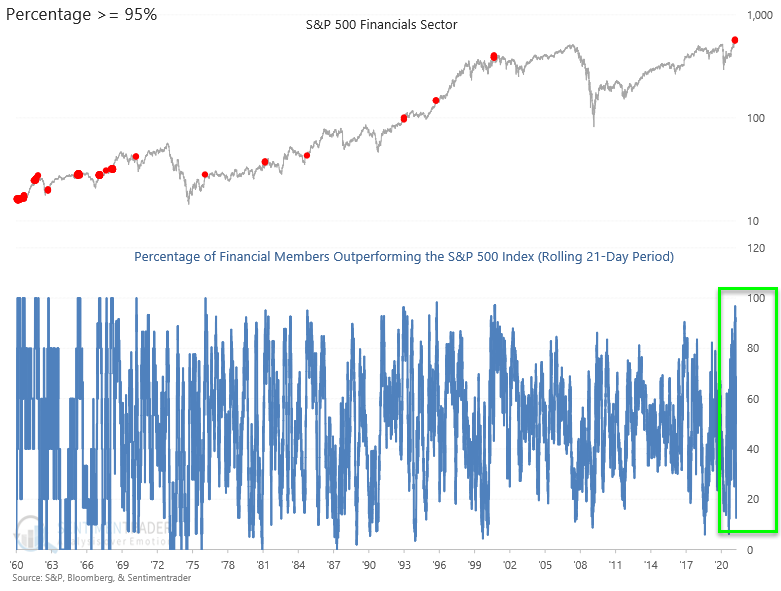
Financials Chart
The financials sector just completed a reversal similar to the energy one, whereby the percentage of members outperforming the S&P 500 Index swung from 95.31% to 12.5% in 20 trading days. When I searched for that pattern using parameters of > 90% to < 15% in 20 days or less, I found zero instances in 60 years of data.
Conclusion: The gyrations in the percentage of members outperforming the S&P 500 have been unprecedented since August 2020. While a reversal in investor positioning is typical at significant bull or bear inflection points, the speed of the most recent swings will test any investor's confidence.