
Hindenburg Omen Reappears in Nasdaq

Key Points
- The Nasdaq market has recently triggered the "Hindenburg Omen" signal
- In the 3 to 6 months following the emergence of such signal clusters, the Nasdaq Index and Russell 2000 Index have a relatively high probability of negative returns
Latest Observations on the Nasdaq Hindenburg Omen
According to the latest market data, the Nasdaq Composite Index triggered the "Hindenburg Omen" again on February 2, 2026. This is a technical indicator designed to monitor the internal health of the market, with its core logic being to capture the market's "split" state - that is, while the index remains at a high level or rises, the number of stocks hitting 52-week highs and 52-week lows increases significantly at the same time.
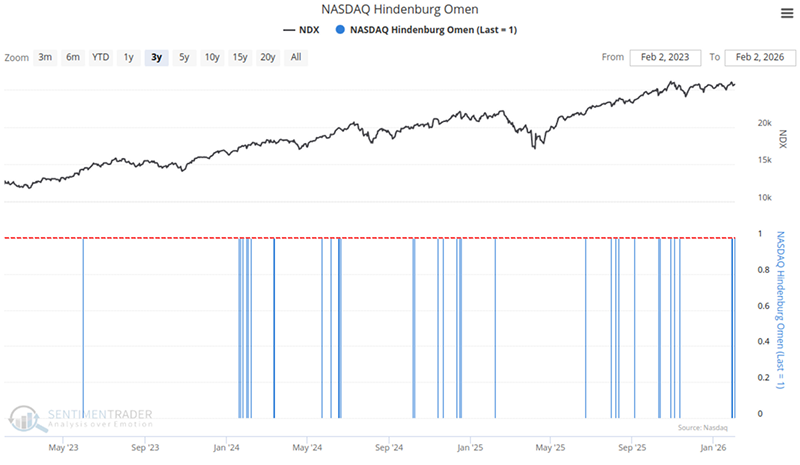
A single occurrence of the "Hindenburg Omen" is usually of little significance. However, over the past week, we have observed a clustering of this signal, which was triggered 3 times in just 4 trading days. The Nasdaq 100 Index tends to perform weakly in the following 3 to 6 months. This means that the forces of bulls and bears are engaged in intense tug-of-war, and the market lacks a unified driving force.
Statistical Backtesting of Historical Data
Based on the historical performance of 29 similar signals in the past, we can statistically assess the potential risks ahead, but it should be noted that historical data does not represent an absolute prediction of the future.Related Backtest Click Here.
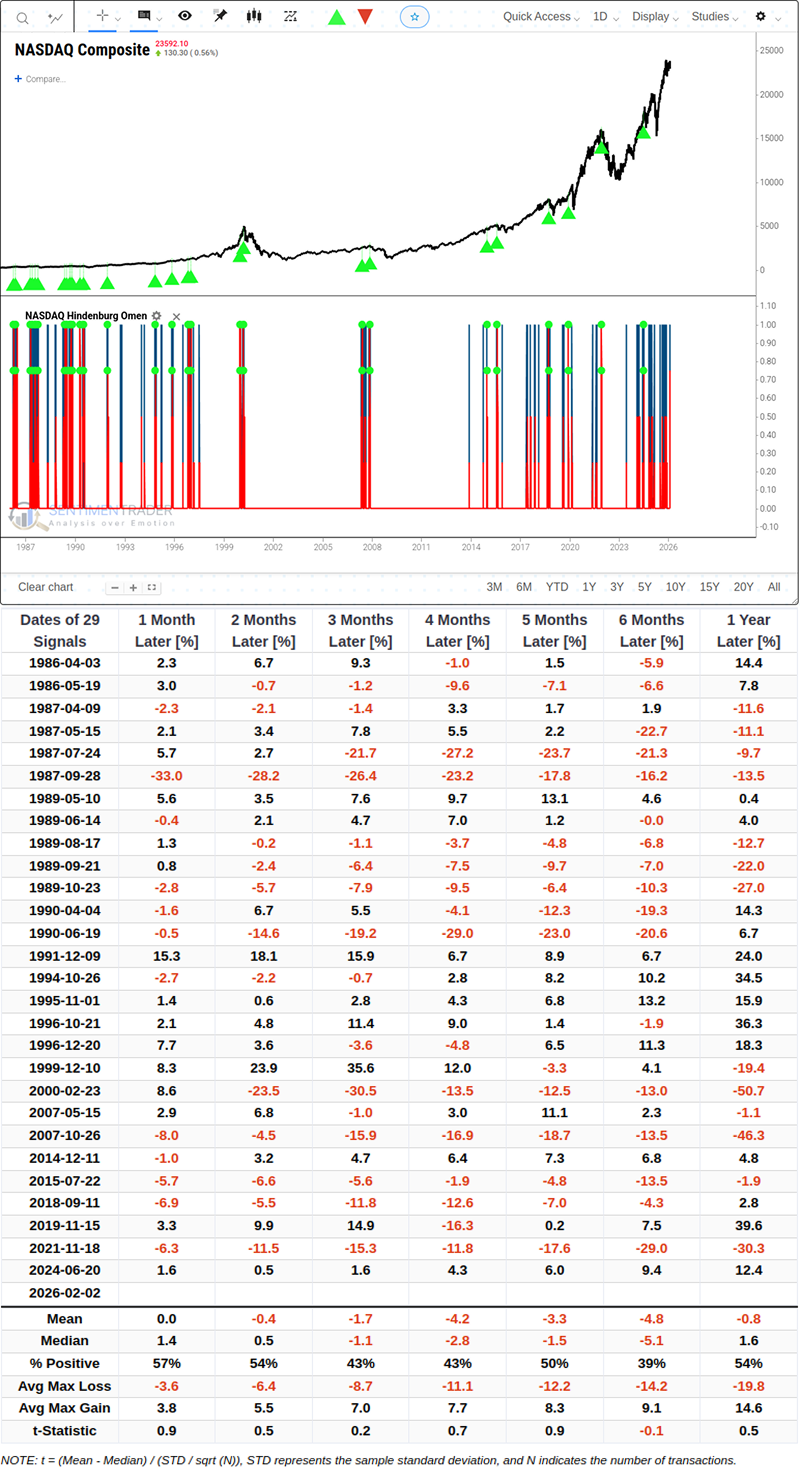
According to backtesting statistics, after the emergence of such signal clusters, for the NASDAQ Composite, the average return of the index turns negative in the 2nd to 6th months after the signal appears. Specifically, the average return after 2 months is -0.4%, and the average return after 6 months is -4.8%. Notably, within the 6-month time window, the probability of positive returns is only 39%.
Let's look at the performance of other sectors.
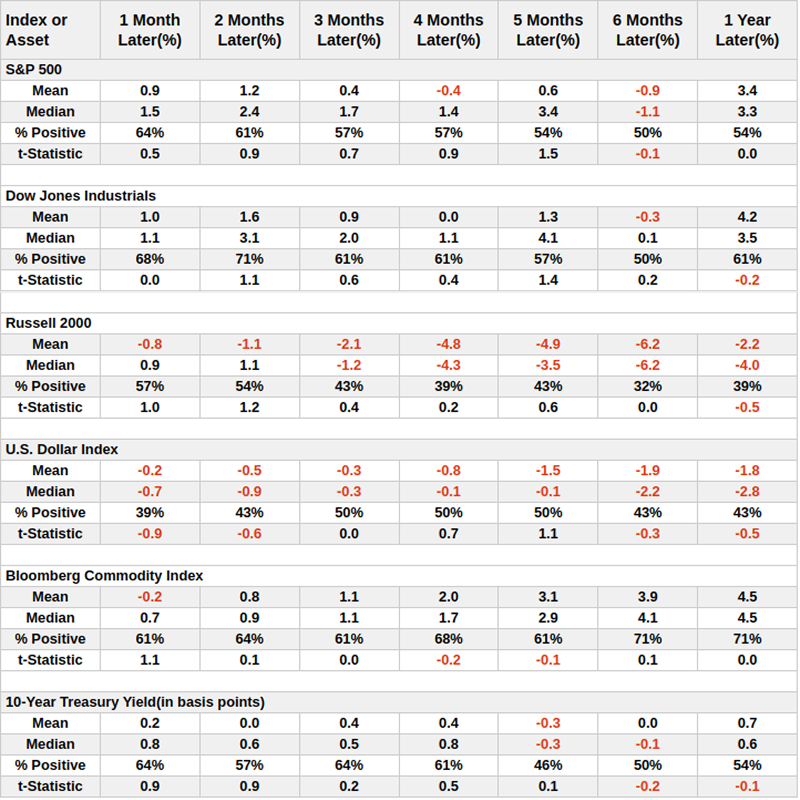
Among them, small-cap stocks are more sensitive to this signal. Historical data shows that 6 months after the signal appears, the average decline of the index reaches 6.2%, and the probability of positive returns drops to 32%.
Corresponding large-cap stocks show relatively stronger resilience, but their average return also slightly fell by 0.9% after 6 months.
How to Create and Detect the Signal
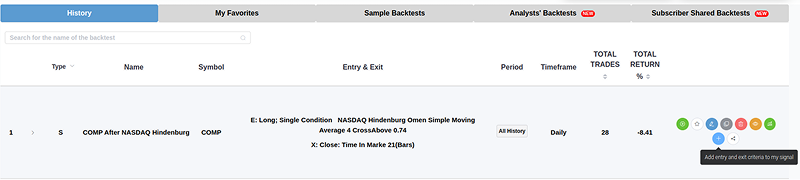
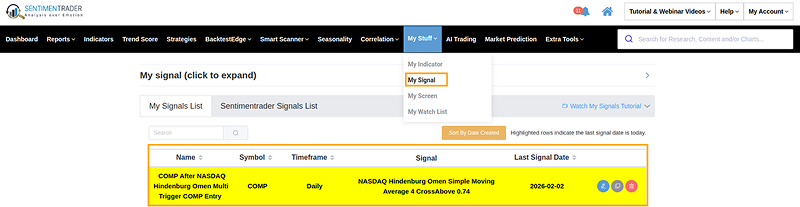
You can set signal conditions according to the following steps to observe such 0-1 trigger signal indicators (e.g., the number of triggers in the last n trading days - in this case, it is 3/4 with a value of 0.75, so set the condition to CrossAbove 0.74).
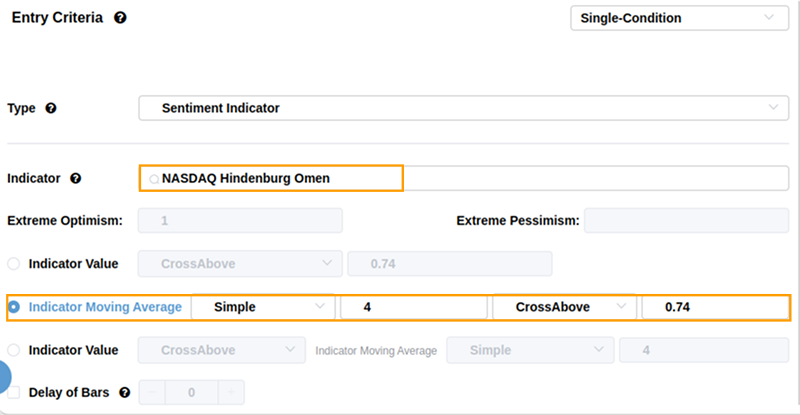
Consistent with the method mentioned earlier, you can add this condition to My signal in the backtesting list to detect whether the daily signal is triggered.
What the Research Tells Us
The combination of this signal and data does not necessarily point to a market crash, nor does it mean an immediate arrival of a bear market. It is more of a reminder of a shift in market conditions.
Historical statistics indicate that in the 3 to 6 months after the signal is triggered, the probability of the market entering "Rougher Seas" increases. During this phase, the previous one-way upward, low-volatility "tailwind environment" may be difficult to sustain. For investors, this means that simple Beta strategies may face challenges, while refined stock selection and risk control will become more critical.
Although we cannot make trading decisions based solely on a single indicator, the tendency of the data suggests that investors should remain rational and objective. While paying attention to key indicators such as the upcoming non-farm payroll data, they should also appropriately review the risk exposure of their investment portfolios to cope with potential market volatility in the future.