
Hindenburg and Titanic Signals Are Clustering

Key points:
- A cluster of classic market warning signals has triggered, even as the Nasdaq hovers near new highs.
- The Nasdaq Titanic Syndrome and Hindenburg Omen have flashed a combined six times in the last five trading sessions.
- Historically, when these signals have clustered this intensely, the Nasdaq Composite's forward returns have been consistently poor, with a one-year win rate of only 40%.
- The performance of the tech-heavy Nasdaq 100 has been similarly weak, while the S&P 500 has also historically struggled.
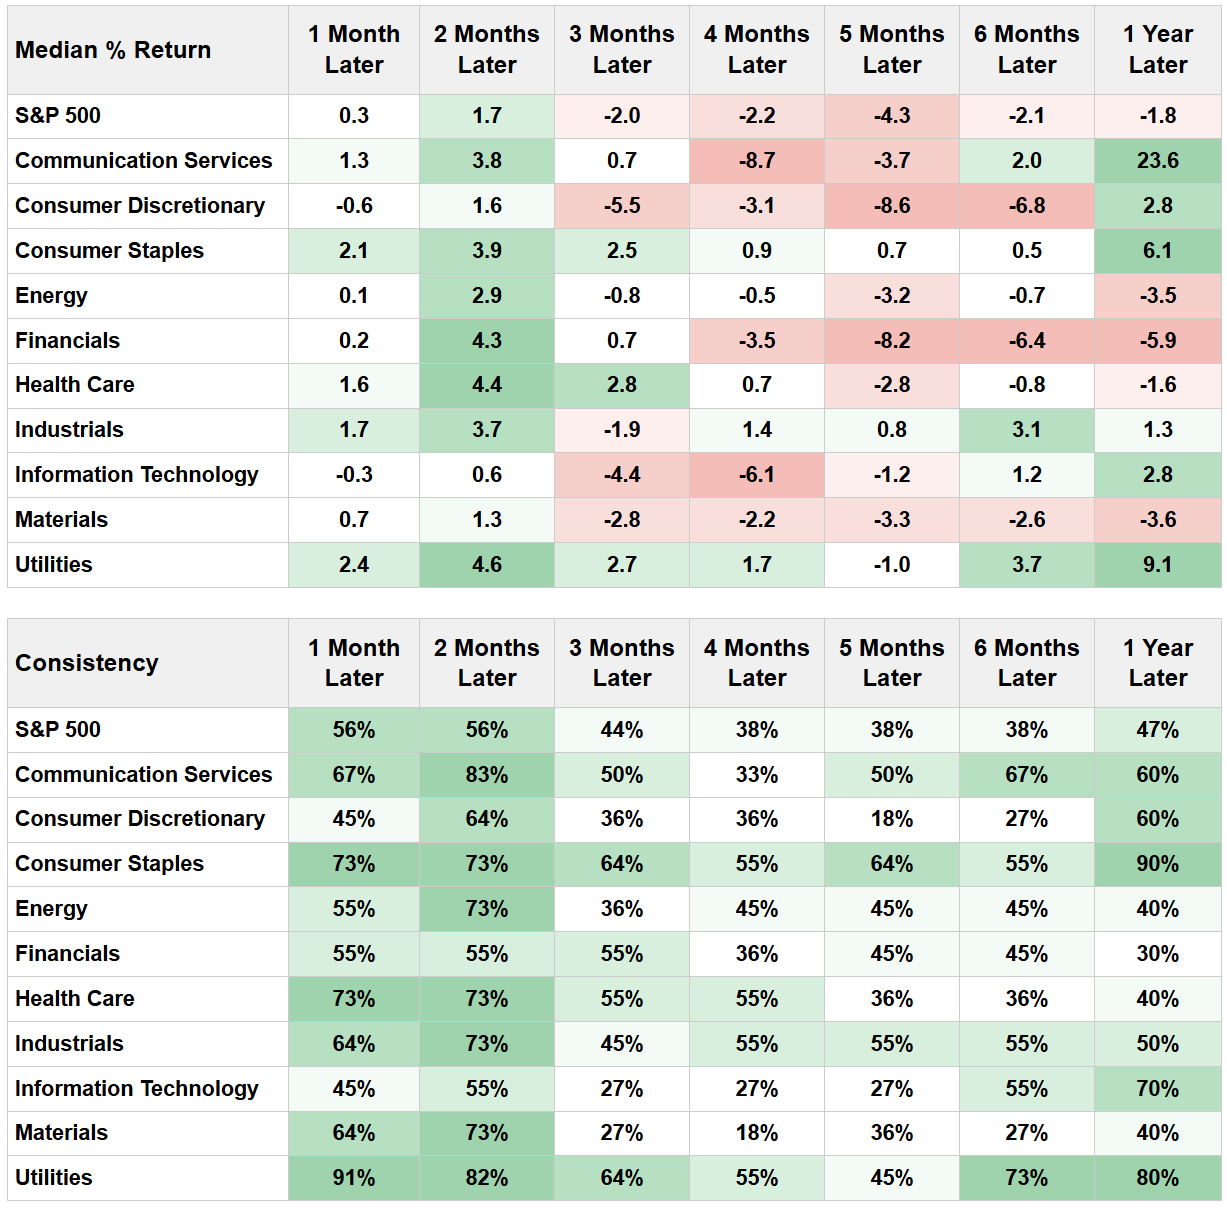
- Sector performance following this cluster shows a clear risk-off rotation into defensive sectors.
A Flurry of Warning Signs Appear Beneath the Surface
While the Nasdaq Composite remains near its all-time highs, the market's internal health has shown signs of significant deterioration. This creates a potentially dangerous divergence, where the headline index is held up by a few names while broad participation crumbles.
One of the classic indicators for identifying this type of "top-heavy" market is the Nasdaq Titanic Syndrome. This signal is designed to spot a lack of confirmation for new highs, triggering when new 52-week lows are greater than new 52-week highs while the index itself is near a peak. This is an alarming scenario, as it shows more stocks are breaking down than breaking out, even as the index appears strong. This warning sign flashed four times in five days.
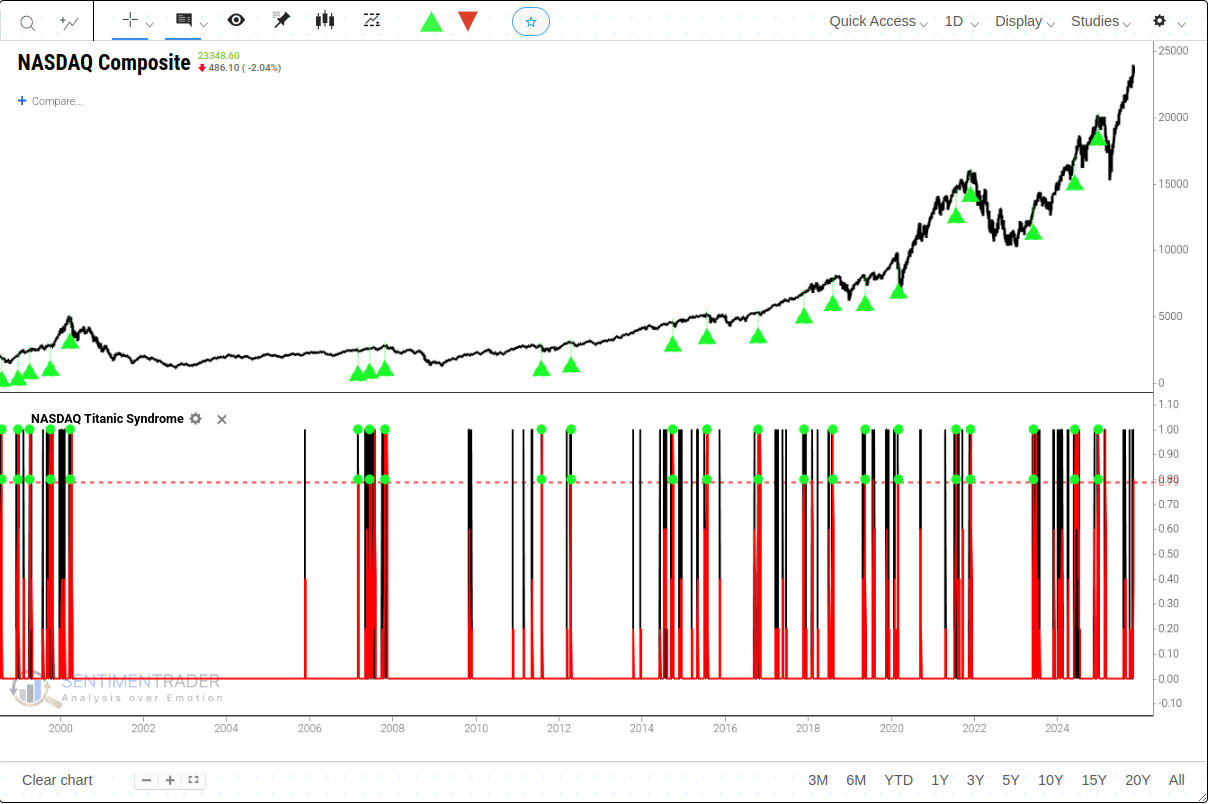
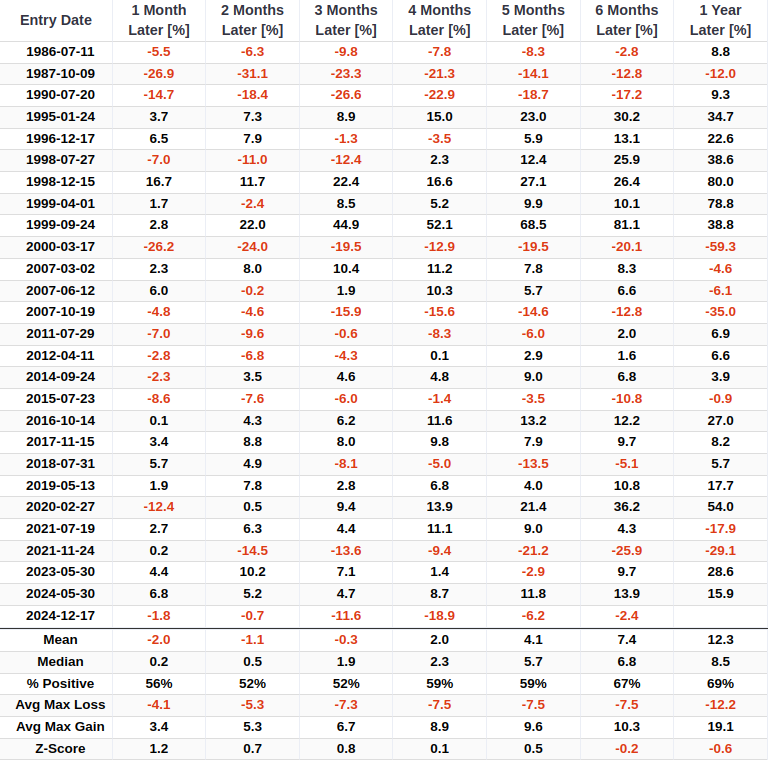
Historically, when the Nasdaq Titanic Syndrome signal has triggered, the forward returns for the Nasdaq Composite have been challenging, particularly over the short-to-medium term.
Another classic breadth warning signal, the Hindenburg Omen, has also been active. This indicator identifies periods of extreme internal divergence and market fractionation. A new signal triggered just two trading days ago, adding to the recent cluster.
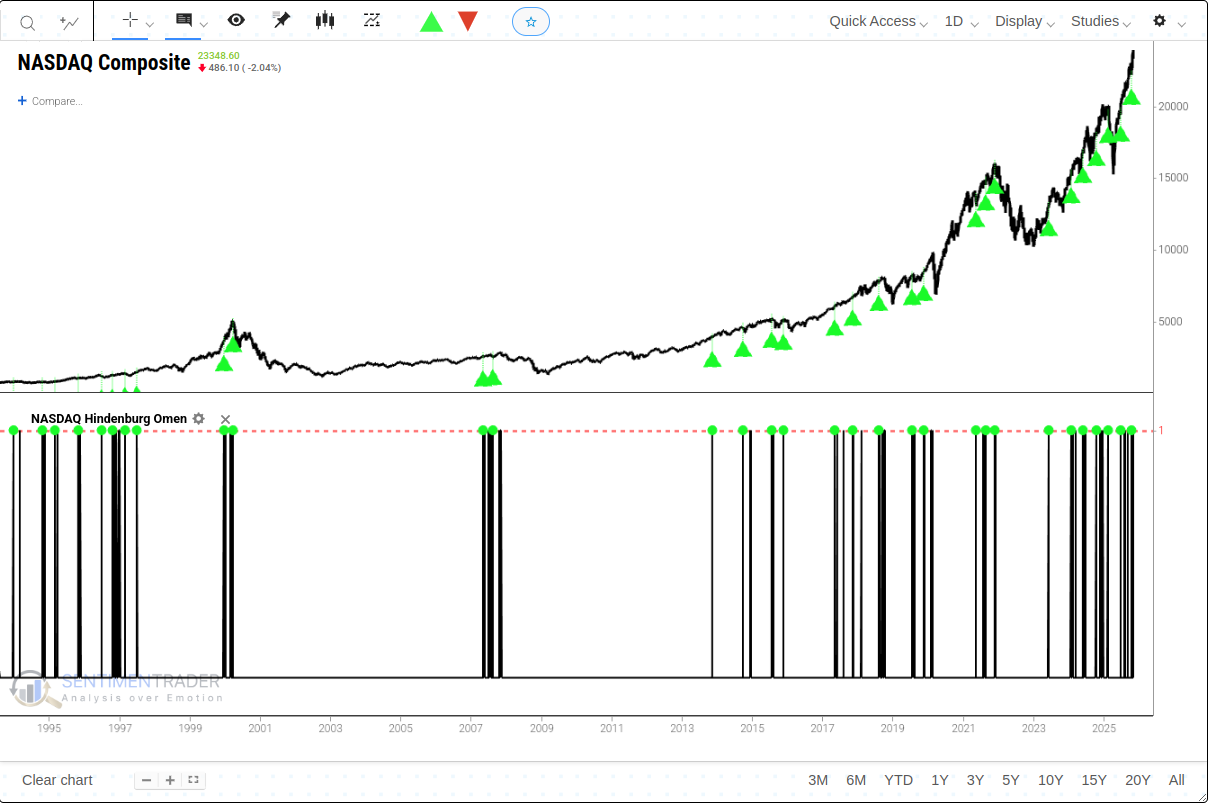
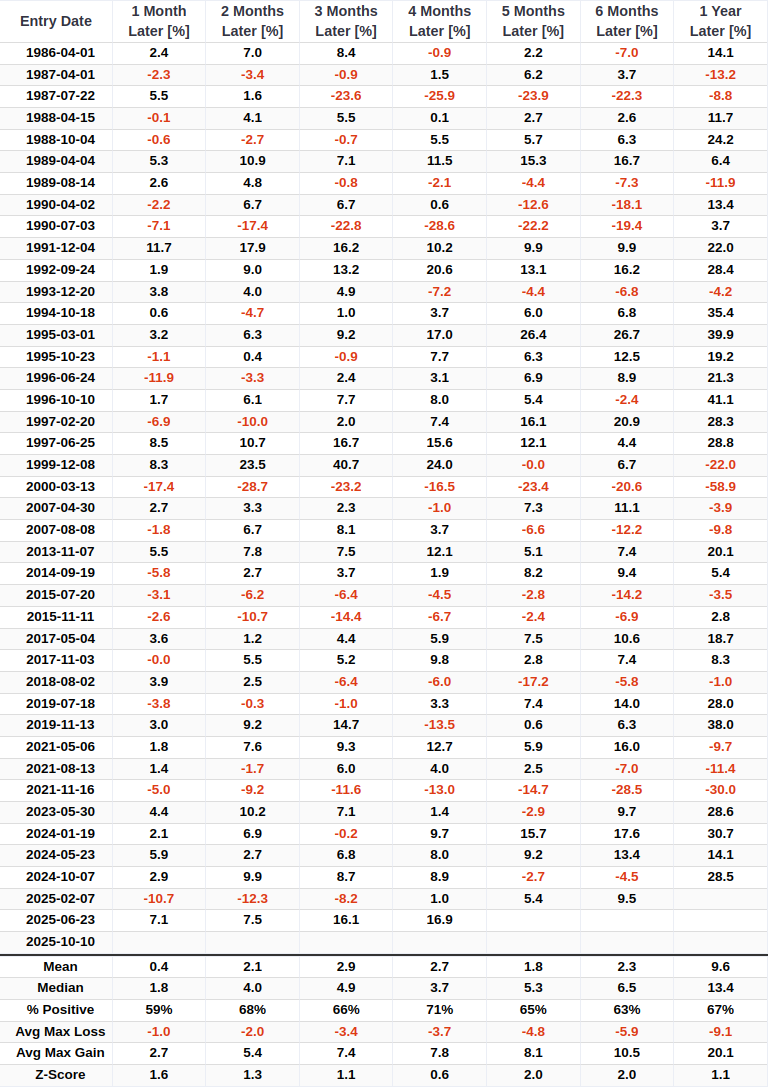
The historical precedent for the Hindenburg Omen is similarly noteworthy. Following the signal, the Nasdaq's forward performance has been inconsistent.
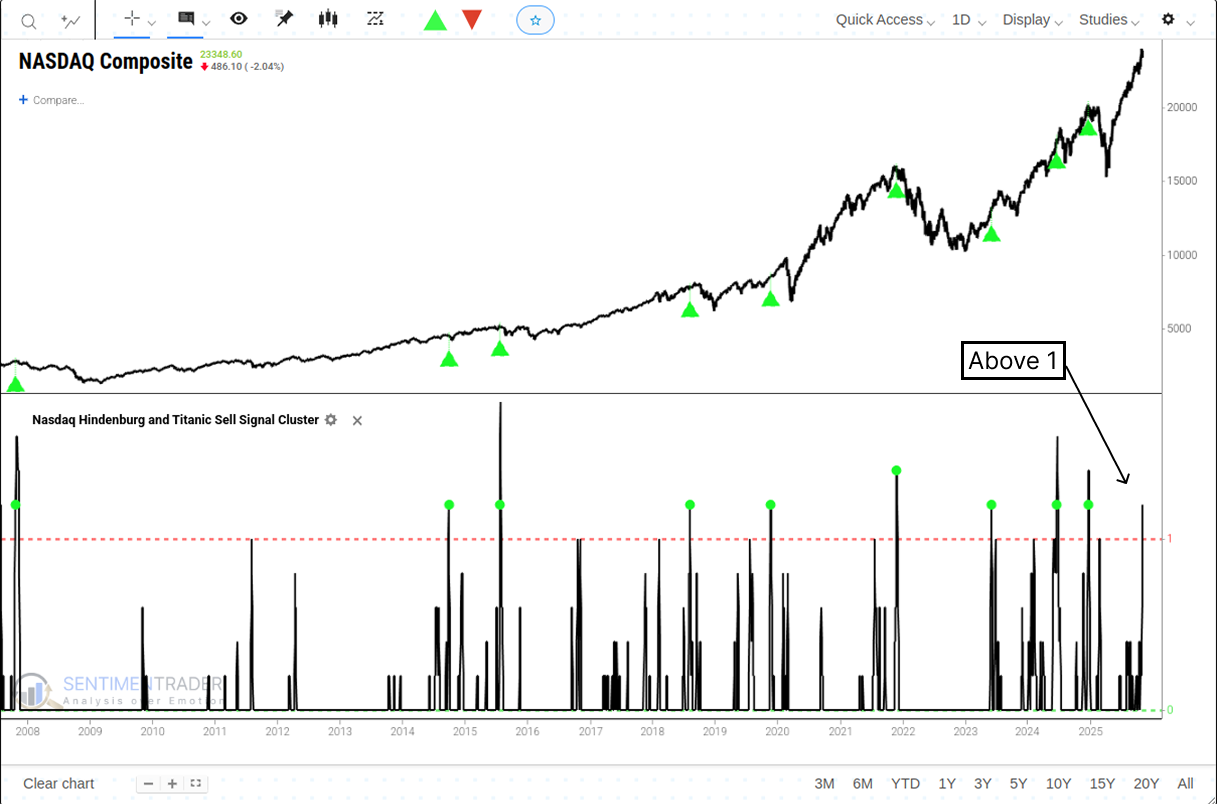
A Titanic Syndrome and Hindenburg Omen Signal Cluster
Individually, these signals are not particularly noticeable. However, when they trigger together in a tight cluster, the warning becomes far more potent. To quantify this, we can create a combined signal that counts the total number of Hindenburg Omen and Titanic Syndrome signals over the past five days. With four Titanic signals and two Hindenburg signals recently, this count has now exceeded 5, triggering our cluster model.
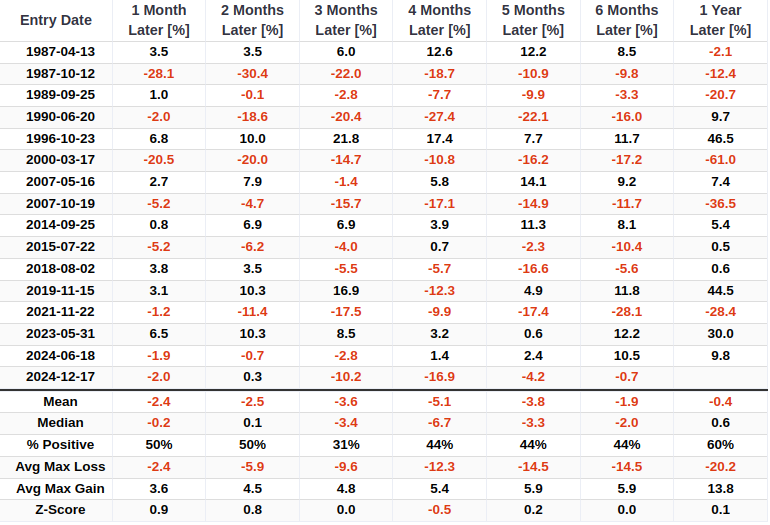
When this rare cluster of signals has occurred, the forward returns for the Nasdaq Composite have been decidedly poor. The median return has been negative across all time frames from one month to one year.
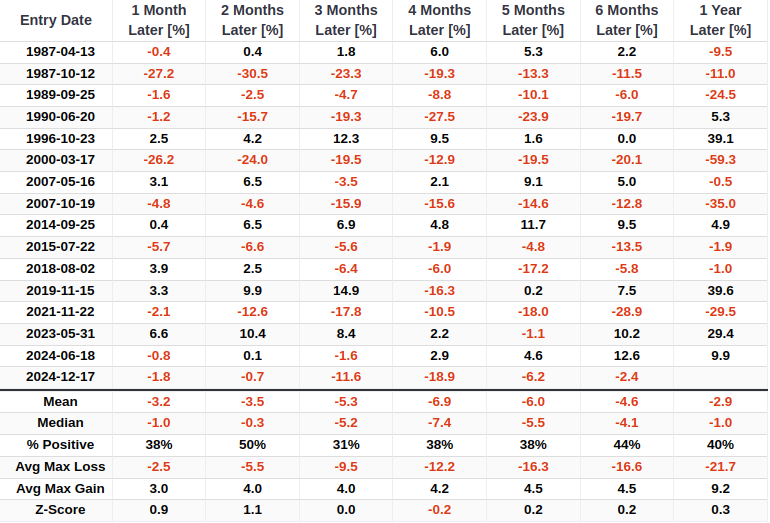
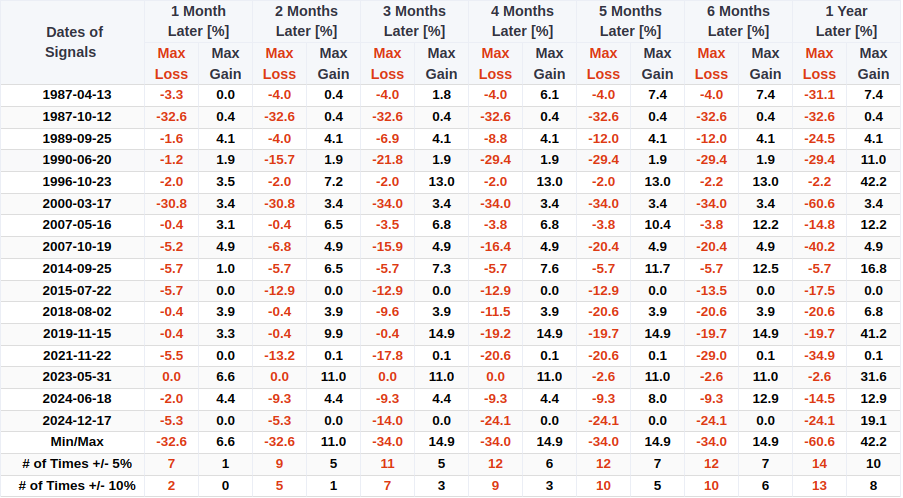
The median maximum loss over the subsequent six months was -4.1%, but the full range of outcomes includes a staggering max loss of -60.6% (during the 2000 crash) and -34.9% (2022).
The sector-level performance following these signal clusters shows a clear "risk-off" pattern.
How about Nasdaq 100 and the S&P 500?
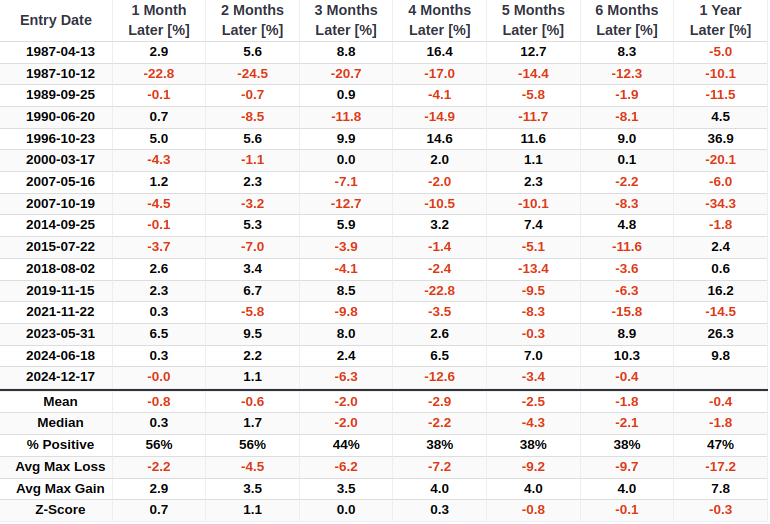
As the performance table below shows, the precedent for Nasdaq 100 is just as challenging as it is for the broader Nasdaq Composite. Following this rare signal cluster, Nasdaq 100's mean returns were also negative across all time frames from one month to one year.
The S&P 500 has not been immune either. The historical precedent for the broad market is similarly weak, with median returns negative at the three, six, and one-year marks, and a one-year win rate of only 47%.
What the research tells us...
Despite the Nasdaq Composite Index hovering near historic highs, a series of potent internal warning signals-the Titanic Syndrome and the Hindenburg Omen-have simultaneously triggered. Individually, these signals merely point to market volatility. However, when they appear together in such a rare, concentrated pattern, historical precedents reveal a distinctly unfavorable outlook: the median returns for the Nasdaq Composite, Nasdaq 100, and even the S&P 500 have turned negative in most time periods.
In this environment, further gains may prove unsustainable. Such signal clusters often prove more reliable than individual trading days, but close monitoring remains essential in the coming weeks. The more trading days that trigger this omen, the greater the likelihood of a reversal in the uptrend.