Products
SentimenTrader Trading Tools
‍
Backtest Engine
My Trading Toolkit
Correlation Analysis
Seasonality
Market Prediction
Indicators & Data API
‍
Proprietary Indicators & Charts
Market Data API
Strategies & Scanner
‍
50+ Trading Strategies
Smart Stock Scanner
Smart Option Scanner
Research Reports
‍
Research Solutions
Reports Library
Free Resources
Simple Backtest Calculator
Simple Seasonality Calculator
The Kelly Criterion Calculator
Sentiment Geo Map
Public Research Reports
Education
Sentiment Indicators
Technical Indicators
Pricing
Company
About
In the News
Testimonials
Client Success Stories
Contact
Log inLoginSign up
< BACK TO ALL REPORTS

Highly Correlated Markets; Non-Recessionary Bear Markets

Jason Goepfert
2019-01-24
null

This is an abridged version of our Daily Report.

Highly correlated

Over the past 50 days, markets have been closely following each other. The moves in the S&P 500 have been tight with commodities, yields, and overseas stocks.

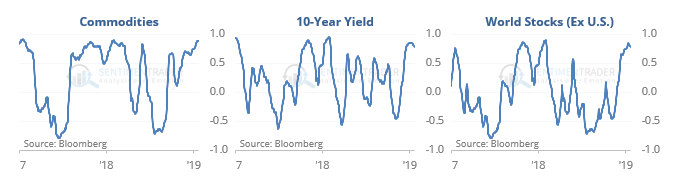
This has usually happened during times of stress, and long-term returns in stocks were excellent following similar conditions, as it often occurred near inflection points. One year later, the S&P showed a positive return each time. Commodities and world stocks also tended to rally, though to a lesser degree.

Non-recessionary bear markets

The path in the S&P 500 since the September peak has a high correlation with bear markets that occurred during times when there was no recession in the next year. Looking at all non-recessionary bear markets, we've closely followed the median path, as well as many individual precedents.

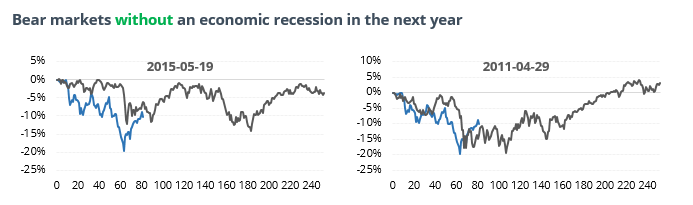
It has not closely followed the path of bear markets when there was a recession.

Loving financials

The 10-day Optimism Index for XLF is above 75 while the fund itself is below its 200-day average. According to the Backtest Engine, there have been 13 days in its history when this happened and over the next week it managed to add to its gains only 3 times.

Ebbing momentum

The McClellan Oscillator is nearing the end of a streak of more than two weeks above 50, an extraordinary display of momentum. When occurring while the S&P 500 is below its 200-day average, the ends of these streaks led to mostly in-line returns over the short- to medium-term.

PRODUCTS
SentimenTrader
Trading Tools
Indicators & Data API
‍
Strategies & Scanner
‍
Research Reports
FREE
RESOUrCES
Simple Backtest
Calculator
Simple Seasonality
Calculator
The Kelly Criterion
Calculator
Sentiment Geo Map
‍
Public Research Reports
‍
Education
Sentiment Indicators
‍
Technical Indicators
‍
Pricing
Bundle pricing
‍
FAQ
‍
Announcements
‍
COMPANY
‍
About
‍
In the News
‍
Testimonials
‍
Client Success Stories
CONTACT
‍
General Inquiries
‍
Media Inquiries
‍
Financial Professionals Inquiries
‍
© 2026 Sundial Capital Research Inc. All rights reserved.
Setsail Marketing
TermsPrivacyAffiliate Program
Risk Disclosure: The information and tools provided are for research and analytical purposes only and are not intended as investment advice. Market analysis involves uncertainty, and outcomes may differ from expectations. Users should conduct their own due diligence and consider their individual circumstances before making any financial decisions. Past performance is not necessarily indicative of future results.

Hypothetical Performance Disclosure: Hypothetical performance results have many inherent limitations, some of which are described below. No representation is being made that any account will or is likely to achieve profits or losses similar to those shown; in fact, there are frequently sharp differences between hypothetical performance results and the actual results subsequently achieved by any particular trading program. One of the limitations of hypothetical performance results is that they are generally prepared with the benefit of hindsight. In addition, hypothetical trading does not involve financial risk, and no hypothetical trading record can completely account for the impact of financial risk of actual trading. for example, the ability to withstand losses or to adhere to a particular trading program in spite of trading losses are material points which can also adversely affect actual trading results. There are numerous other factors related to the markets in general or to the implementation of any specific trading program which cannot be fully accounted for in the preparation of hypothetical performance results and all which can adversely affect trading results.

Testimonial Disclosure: Testimonials appearing on this website may not be representative of other clients or customers and is not a guarantee of future performance or success.