
Higher-Than-Expected Government Borrowing and Fiscal Concerns

Based on News: Government borrowing for October higher than expected
Source Link: bbc_business
Related Symbol: [BND (Total Bond (BND)), dollar (US Dollar), JNK (High Yield Bonds (JNK)), TLT (20-Year Treasuries (TLT)), LQD (Investment Grade (LQD))]
Key Points
- October's higher-than-expected government borrowing signals fiscal strain, raising concerns over debt sustainability and market stability.
- Historical backtests show mixed asset performance: bonds (BND, TLT) generally positive, high yield (JNK) volatile, dollar uncertain with extreme swings.
- Short-term risks include bond market volatility and dollar fluctuations; long-term outlook hinges on fiscal adjustments and investor confidence.
Current Market Focus
The UK government's October borrowing exceeded forecasts, indicating a higher-than-anticipated budget deficit due to increased public spending and lower tax receipts. This fiscal imbalance raises concerns about debt sustainability and potential crowding out effects in the bond market. Historical parallels, such as Greece's 2010 debt crisis and Japan's 2014 fiscal challenges under Abenomics, suggest similar events have led to significant market reactions. This report examines how key assets have historically performed under comparable fiscal stress scenarios.
The immediate market reaction has been cautious, with investors scrutinizing the implications of higher borrowing on bond yields and currency stability. Sentiment has shifted towards a risk-off stance, particularly in high-yield bonds and long-duration treasuries. The following analysis explores the historical performance of identified symbols (BND, dollar, JNK, TLT, LQD) around similar fiscal events, using backtest summaries to gauge potential market trajectories and risks.
Historical Event References (Event & Date)
- BOE Pledges Unlimited Bond-Buying to Avert Imminent ... Summary:The Bank of England intervened to prevent a gilt market crash by pledging unlimited long-dated bond purchases after Truss's budget caused turmoil. (Date: 2022-09-28 (Source: Bloomberg))
- EXCLUSIVE France taps public bodies to bolster cash pile amid pandemic, Brexit Summary:France took on an additional 136 billion euros in debt related to the coronavirus crisis in 2020, surpassing initial estimates. (Date: 2020-12-14 (Source: Reuters))
- This Time Is Different? For Argentina and IMF, It Had Better Be Summary:IMF revised Argentina's fiscal deficit projection to 2.6% in 2018, aiming for a balanced budget amid borrowing crisis. (Date: 2018-09-07 (Source: Bloomberg))
- Japan's Abenomics in Peril as Recession Hits Again Summary:Japan's fiscal deficit widened under Abenomics, leading to increased bond issuance to fund stimulus and social costs. (Date: 2014-11-20 (Source: Bloomberg))
- Spain borrowing costs ease at auction, relief may be brief Summary:Spain's central government bails out regions with 18 billion euros as many fail to meet debt payments. (Date: 2012-09-20 (Source: Reuters))
- Portugal, Greece risk reawakening euro zone beast Summary:Portugal's 2011 EU/IMF bailout was triggered as 10-year bond yields spiked to 8%, reflecting unsustainable borrowing costs. (Date: 2011-06-02 (Source: Reuters))
- Timeline: Greece's debt crisis Summary:Greece secured a bailout deal with the EU and IMF in 2010, requiring extra budget cuts of 30 billion euros. (Date: 2010-05-02 (Source: Reuters))
- Russia: And Now, The Pain Summary:Russia neared default on $41.3 billion in short-term government debt, with the ruble close to devaluation. (Date: 1998-07-26 (Source: Bloomberg))
BND: Stable but short-term volatility likely
Total Bond (BND) currently faces a mixed outlook amid fiscal concerns, with historical data showing resilience but short-term volatility. Historically, BND has demonstrated a tendency for positive returns over longer horizons, though immediate reactions to fiscal stress events vary. The asset's broad exposure to investment-grade bonds provides some stability, but the current fiscal imbalance could pressure yields and returns in the near term.
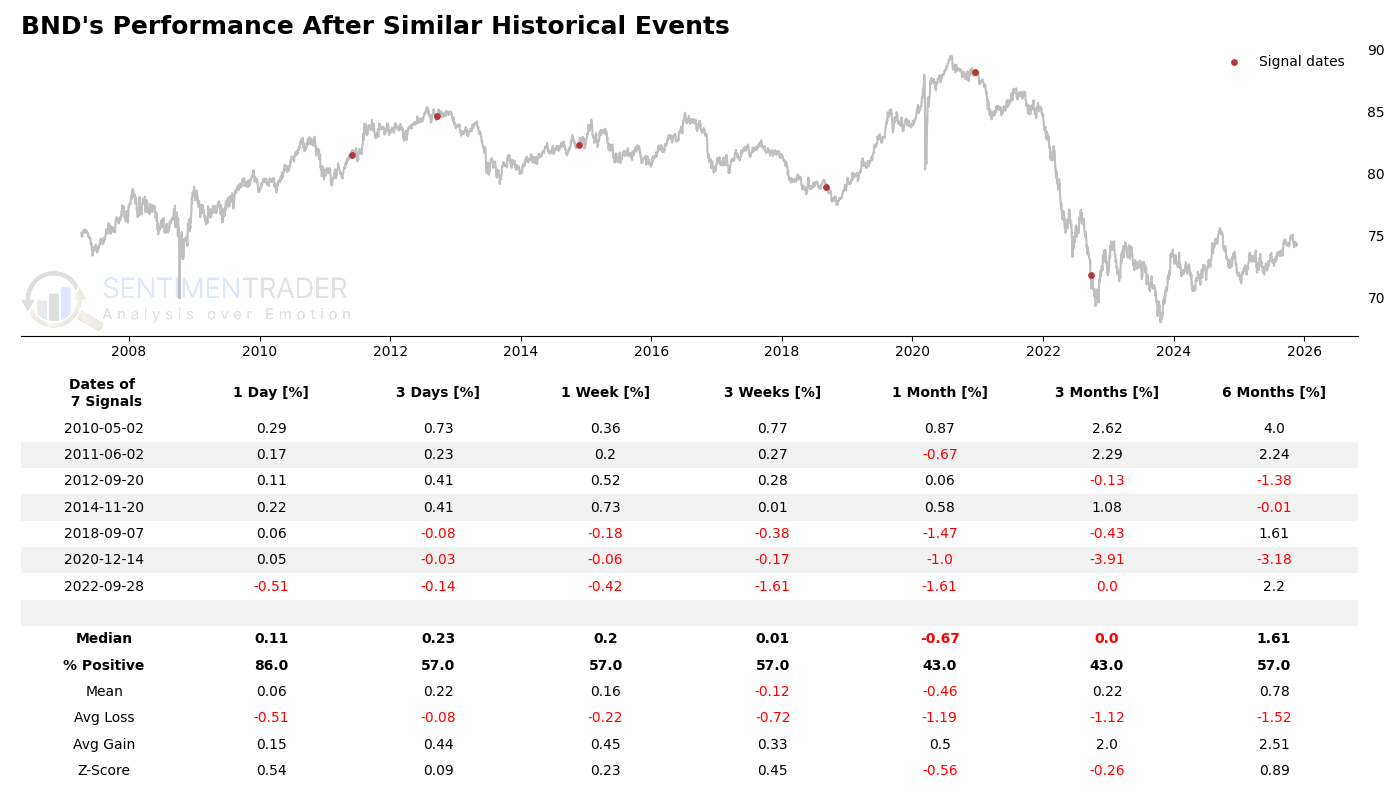
BND's backtest summary reveals a median 1-day return of 0.11% and a 1-month median return of -0.67%, indicating short-term volatility. The 86% positive 1-day return rate suggests initial stability, but the 43% positive 1-month rate highlights longer-term uncertainty. The Z-score of 0.54 for 1-day returns implies modest statistical significance, while the negative Z-score (-0.56) for 1-month returns signals potential downside risk. Notably, the 6-month median return of 1.61% and 57% positive rate suggest recovery potential. Extreme events include a -0.51% 1-day drop (2022-09-28) and a 2.62% 3-month gain (2010-05-02), illustrating the asset's range of outcomes.
Dollar: High volatility, uncertain direction
The US dollar's reaction to fiscal stress events is highly volatile, with historical performance showing no clear directional trend. The dollar's role as a safe-haven currency can lead to mixed outcomes, depending on global risk sentiment and relative fiscal health. Current concerns over US fiscal sustainability may weigh on the dollar, but historical parallels suggest significant event-driven swings.
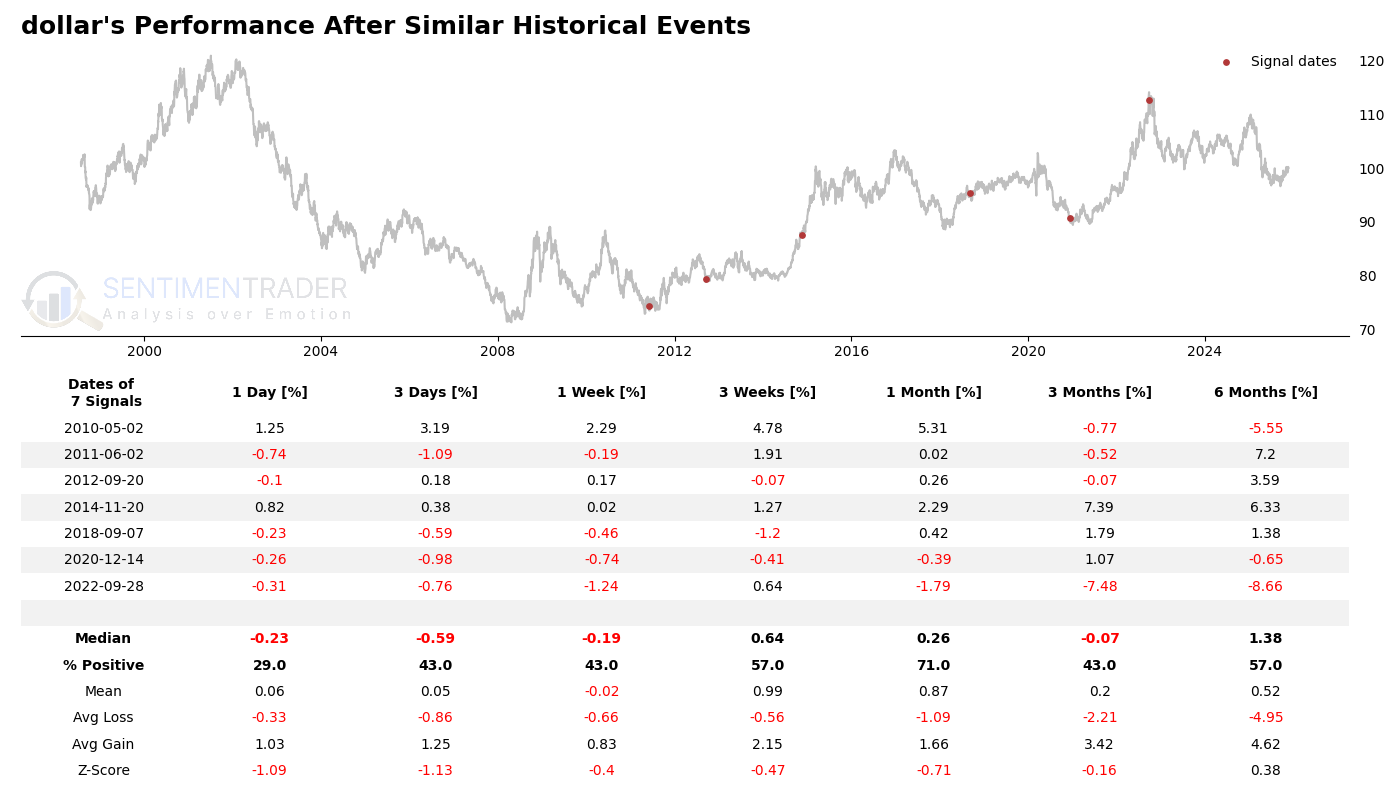
The dollar's backtest summary shows a median 1-day return of -0.24% and a 1-month median return of 0.34%, reflecting its erratic behavior. The 25% positive 1-day return rate underscores immediate uncertainty, while the 75% positive 1-month rate hints at potential stabilization. The Z-scores are negative for short-term periods (-0.88 for 1-day), indicating weak statistical significance. Extreme swings include a 1.25% 1-day gain (2010-05-02) and a -7.48% 3-month drop (2022-09-28), highlighting the dollar's susceptibility to large moves. The 6-month median return of 0.36% and 50% positive rate suggest a balanced long-term outlook.
JNK: High risk, negative short-term bias
High-yield bonds (JNK) are particularly sensitive to fiscal stress, with historical data showing pronounced short-term declines and elevated volatility. The asset's higher credit risk makes it vulnerable to widening spreads and investor risk-off sentiment. Current fiscal concerns may exacerbate these risks, though historical recoveries over longer horizons offer some optimism.
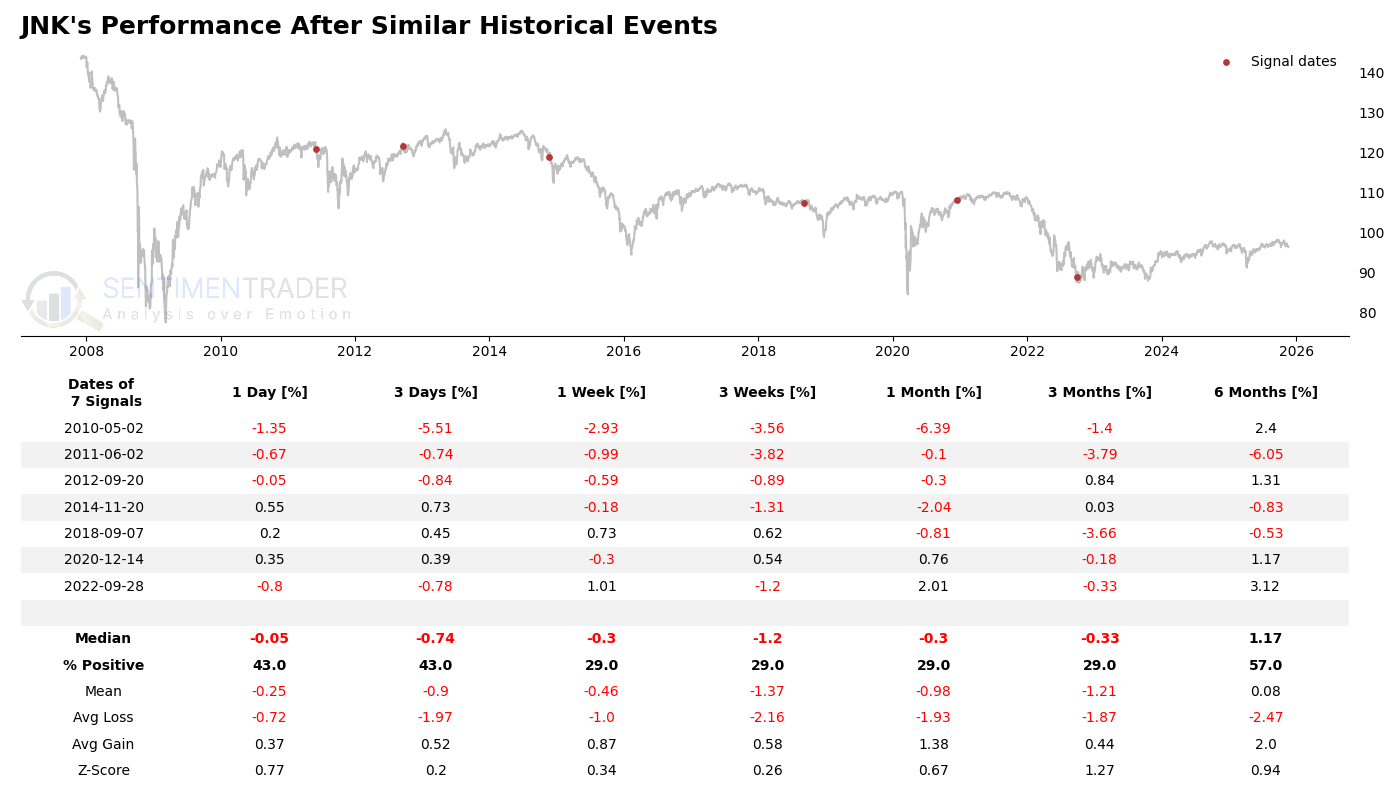
JNK's backtest summary reveals a median 1-day return of -0.05% and a 1-month median return of -0.3%, with only 29% of 1-month returns positive. The mean 1-month return of -0.98% and Z-score of 0.67 suggest a negative bias. The 6-month median return of 1.17% and 57% positive rate indicate potential recovery. Extreme events include a -5.51% 3-day drop (2010-05-02) and a 3.12% 6-month gain (2022-09-28), underscoring the asset's high-risk profile. The avg loss (-1.97% for 3-day) exceeds avg gain (0.52%), highlighting downside risks.
TLT: Strong long-term, short-term pain
20-Year Treasuries (TLT) historically benefit from flight-to-quality flows during fiscal stress, but short-term performance can be choppy. The asset's long duration makes it sensitive to yield curve shifts and inflation expectations. Current fiscal concerns may initially pressure TLT, but historical data suggests strong long-term performance as markets adjust.
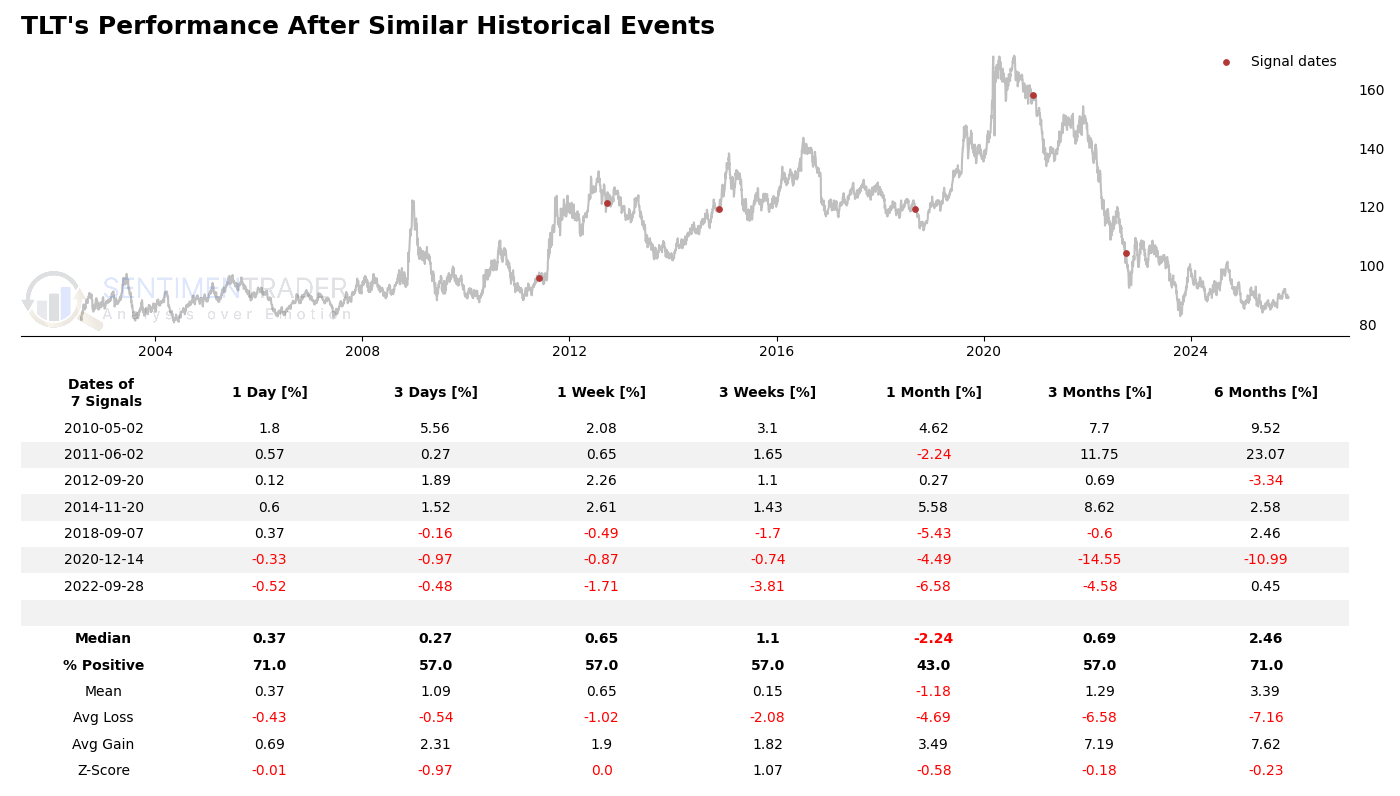
TLT's backtest summary shows a median 1-day return of 0.37% and a 1-month median return of -2.24%, with 71% of 1-day returns positive but only 43% for 1-month. The 6-month median return of 2.46% and 71% positive rate highlight its long-term appeal. Extreme events include a 5.56% 3-day gain (2010-05-02) and a -14.55% 3-month drop (2020-12-14), reflecting its volatility. The Z-score of -0.01 for 1-day returns suggests neutral statistical significance, while the -0.58 for 1-month indicates short-term risk. Avg gains (7.62% for 6-month) far exceed avg losses (-7.16%), emphasizing its asymmetric upside.
LQD: Resilient with moderate upside
Investment-grade bonds (LQD) exhibit resilience during fiscal stress, with historical data showing moderate positive returns and lower volatility compared to high-yield. The asset's credit quality provides a buffer against fiscal concerns, though short-term underperformance is possible. Current conditions favor LQD as a relative safe haven within fixed income.
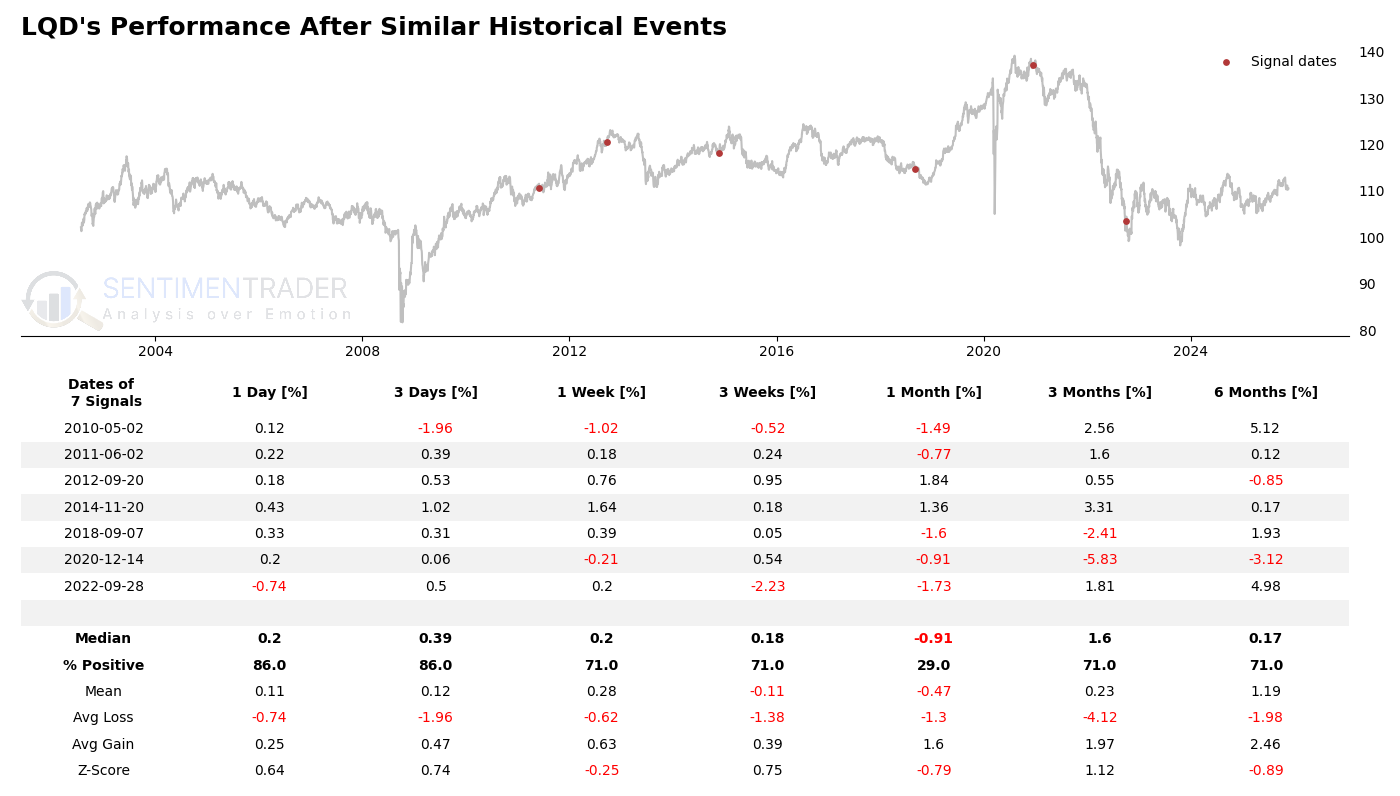
LQD's backtest summary reveals a median 1-day return of 0.2% and a 1-month median return of -0.91%, with 86% of 1-day returns positive but only 29% for 1-month. The 6-month median return of 0.17% and 71% positive rate suggest stability. Extreme events include a -1.96% 3-day drop (2010-05-02) and a 5.12% 6-month gain (same event), illustrating its recovery potential. The Z-score of 0.64 for 1-day returns indicates mild significance, while the -0.79 for 1-month signals short-term risk. Avg gains (2.46% for 6-month) outweigh avg losses (-1.98%), supporting its defensive role.
What the research tells us...
The UK's higher-than-expected borrowing underscores fiscal risks, with historical backtests suggesting mixed asset performance. Bonds (BND, TLT) show resilience over longer horizons (positive 6-month median returns, high % positive rates) but face short-term volatility (negative 1-month Z-scores). The dollar's erratic behavior (25% 1-day positive rate) and JNK's high-risk profile (negative mean returns) warrant caution. LQD emerges as a relative safe haven (71% 6-month positive rate). Key risks include prolonged fiscal strain and yield curve shifts. Investors should focus on duration management and quality bias, monitoring fiscal adjustments for directional cues. Historical extremes (e.g., TLT's +23.07% 6-month gain in 2011) remind us of potential outliers, but summary statistics favor a cautious, selective approach.
Disclaimer
This report is generated automatically based on publicly available information, SentimenTrader's proprietary finance news filter tool and Backtest Engine, with AI assistance. It should be noted that the framework and narrative of this analysis were developed through an interactive dialogue process with an AI assistant, combining data-driven insights from SentimenTrader's tools. A record of this process may be found per requesting. It is intended for informational purposes only and does not constitute financial advice or a recommendation to buy or sell any securities. Market conditions can change rapidly, and past performance is not indicative of future results. Always conduct your own thorough research and consult with a qualified financial advisor before making any investment decisions. The accuracy and completeness of the information are not guaranteed.