
High-yield bonds join the breadth thrust party

Key points:
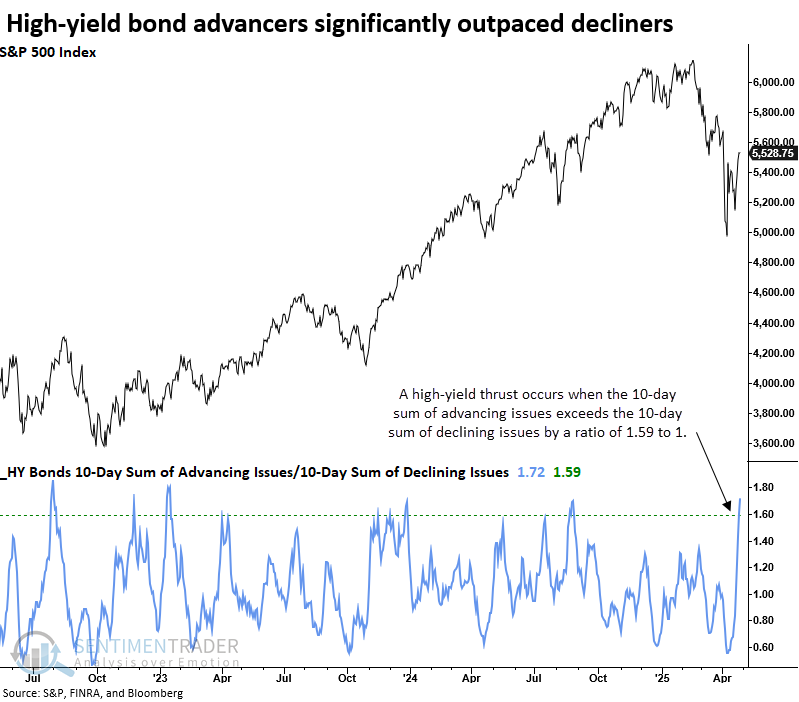
- The most risky corporate bonds, high-yield, triggered a breadth thrust
- Similar thrusts saw the S&P 500 rally 100% of the time over the following year
- A high-yield bond index rallied 100% of the time over the subsequent six and twelve months
A high-yield bond breadth thrust supports the case for a stock market trend change
Last week, I highlighted notable breadth thrusts across both NYSE and Nasdaq exchange issues, indicating a surge in market participation. What also caught my attention was that a subset of corporate bonds, specifically high-yield bonds, triggered a breadth thrust as well.
Given that high-yield debt is particularly sensitive to shifts in economic activity, a new thrust signal is an interesting development against the backdrop of gloomy business sentiment surveys.
I use the same method to identify breadth thrusts in high-yield bonds as I do for stocks. This indicator is featured on our website's breadth page, titled "10-Day A/D Ratio." The concept, often referred to as breakaway momentum, was popularized by respected market analyst Walter Deemer.
Bond breadth data from FINRA began in 2005, resulting in smaller sample sizes and limited coverage across economic cycles. Still, the market message remains valuable.
Similar thrusts preceded a bullish outlook for stocks
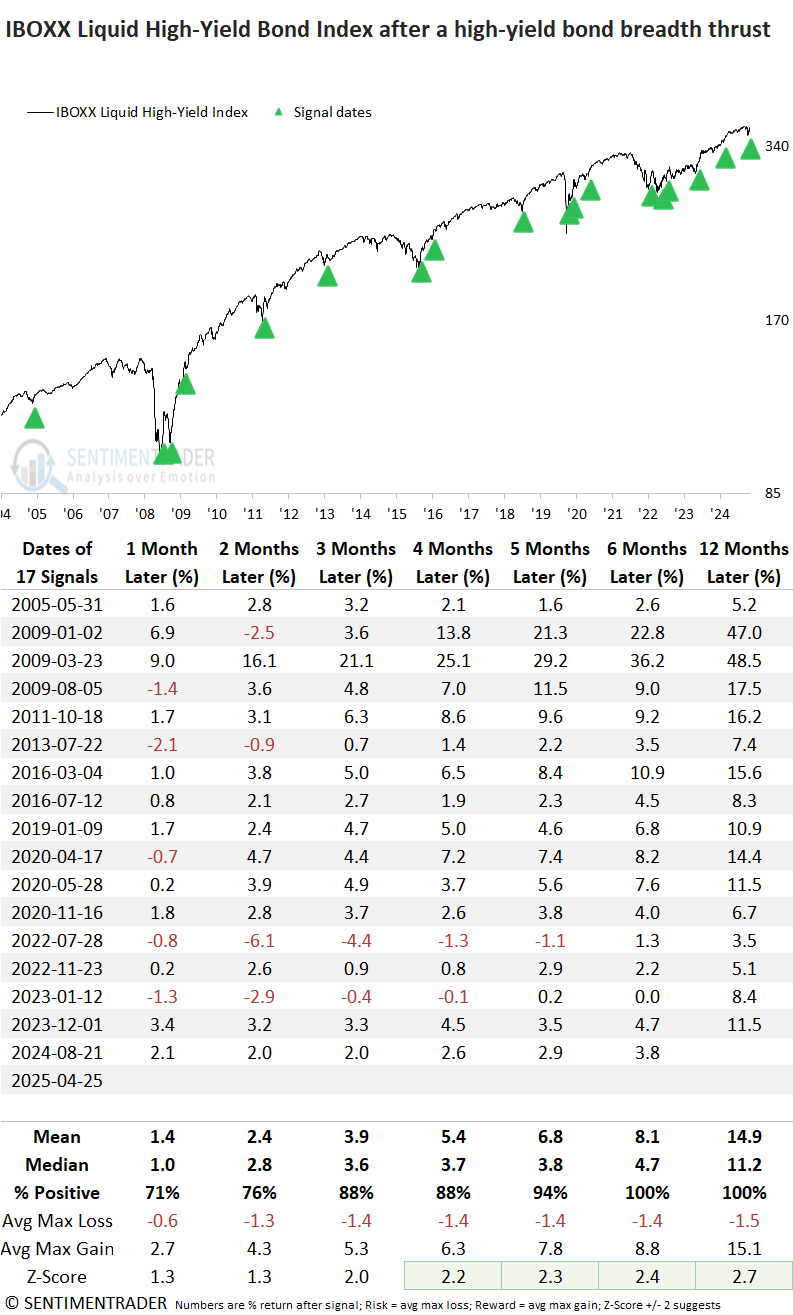
High-yield thrust signals have historically preceded robust and consistent gains in the S&P 500 over all time frames. One year later, the index rose in every instance. Moreover, returns from four to twelve months out were also statistically significant compared to random outcomes.
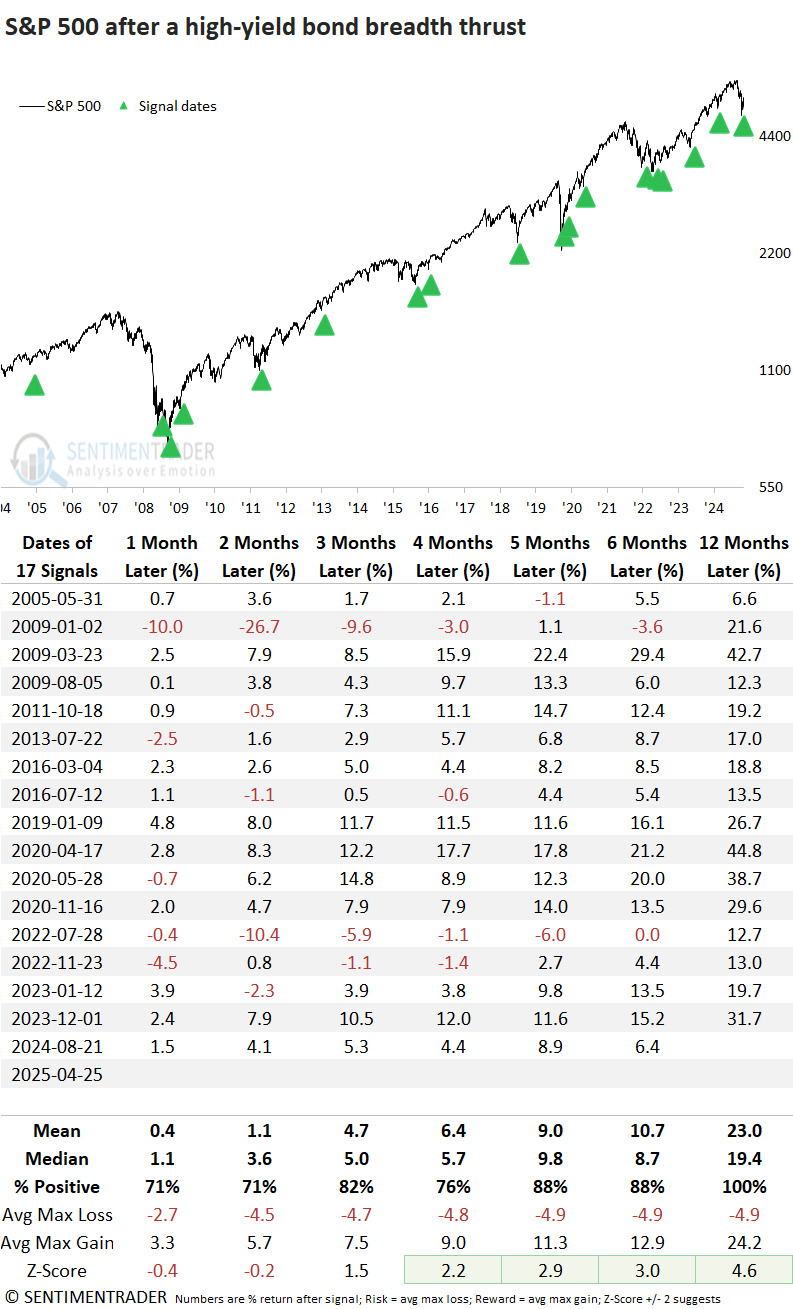
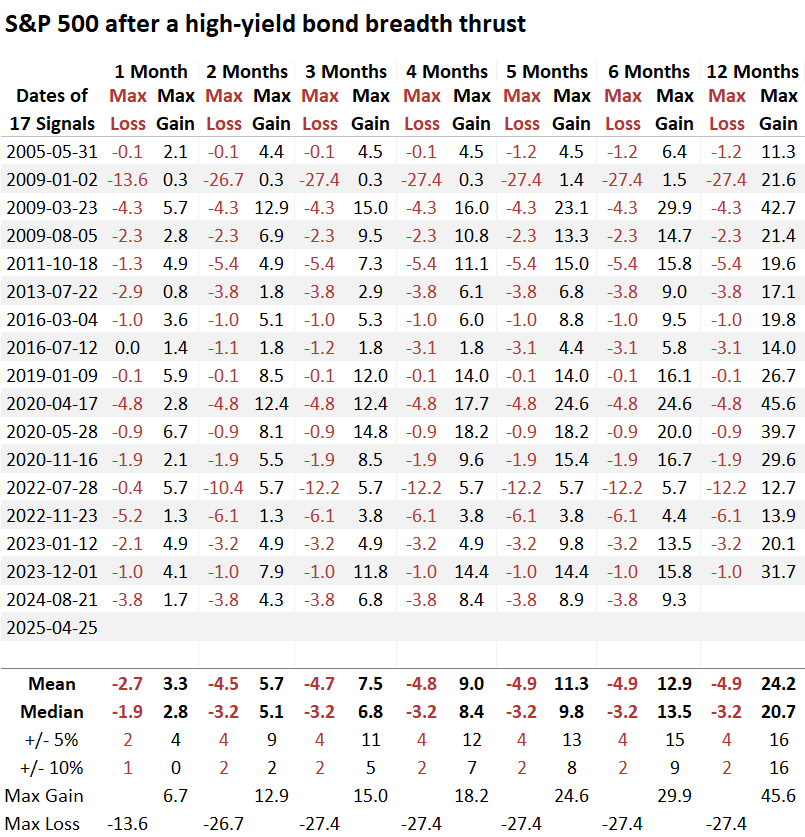
Although the signal has historically delivered substantial rewards relative to risk, the outcomes in 2009 and 2022 underscore that even high-probability setups can fail.
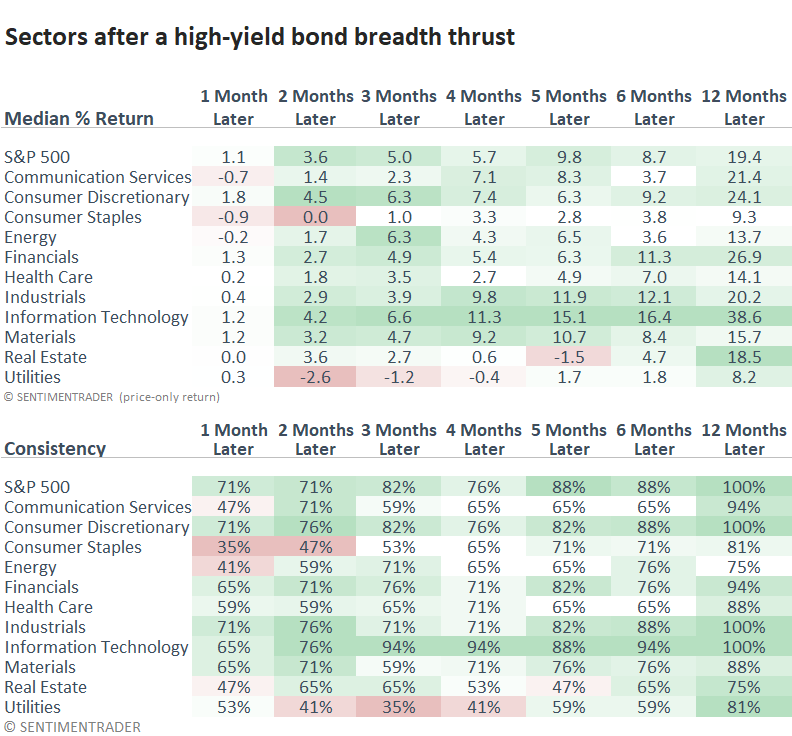
Performance in cyclical sectors significantly outpaced that of defensive-oriented groups, with technology in particular showing exceptional strength.
What about high-yield bonds?
A high-yield bond index displayed outstanding returns and consistency across all time frames, with the six and twelve-month intervals recording a gain in every instance.
TCTM Composite Thrust Model
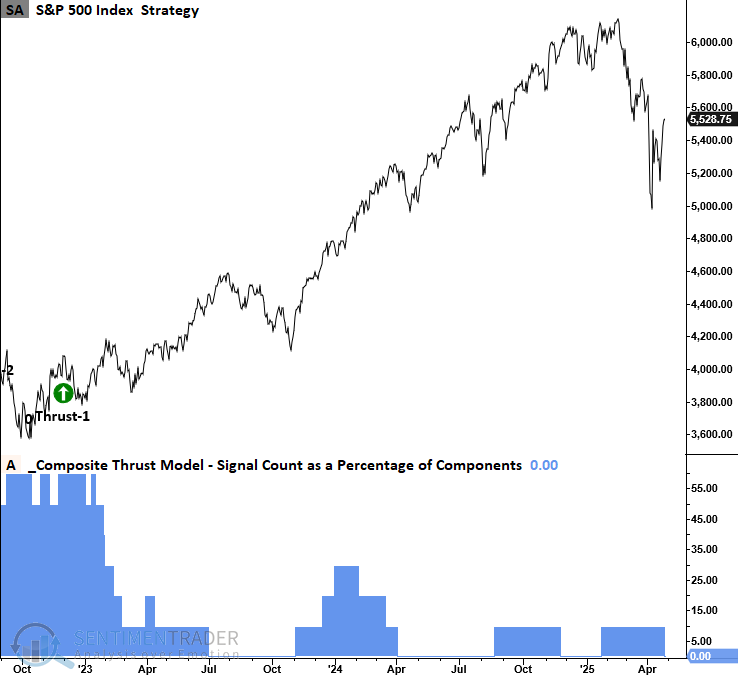
Although several short-term participation indicators (10 days or fewer) have triggered breadth thrusts, the broader TCTM Composite Thrust Model, which incorporates a blend of short- and medium-term signals, has not signaled an all-clear. The steep decline following the tariff news pulled prices well below trend-following metrics like moving averages, which now need to "catch down" to price to set up a launchpad scenario.
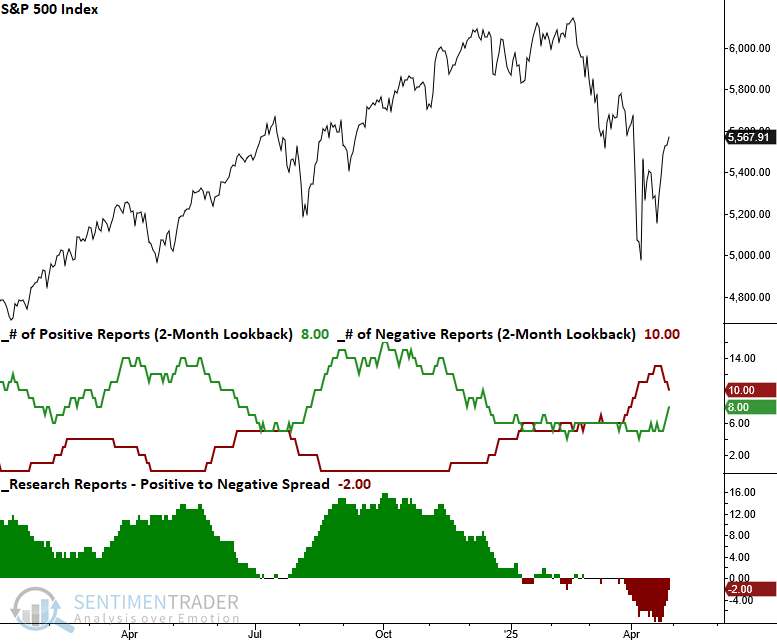
An uptick in positive research reports is beginning to narrow the spread between bullish and bearish outlooks.
What the research tells us...
Risky corporate bonds, or high-yield bonds, recently surged with such intensity that they triggered a rare breadth thrust signal-an indication of overwhelming and sudden buying pressure across the asset class. This type of thrust reflects a decisive shift in investor risk appetite, often marking the beginning of a sustained uptrend. Historically, when similar breadth thrusts occurred, both the S&P 500 and a high-yield bond index posted gains 100% of the time over the following 12 months, underscoring the signal's potential as a powerful bullish omen for risk assets.