
High-yield bonds are showing signs of weakness

Key points:
- New highs for high-yield bonds outpace new lows by a wide margin
- Longer-term breadth measures for the high-yield bond market are diverging from stocks
- There are few precedents for similar behavior, but the ones that exist suggest limited upside
The junk bond rally is running on fumes
When things get so good that it's hard to imagine anything going wrong, it's often (not always) a good time to be nervous. Reasons tend to come out of nowhere, markets rarely reward overconfidence.
One of our favorite early-warning markets is the high-yield (junk) bond market. When investors begin to worry about credit quality, it has often given a heads-up as equity investors were more focused on the upside instead of possible downside.
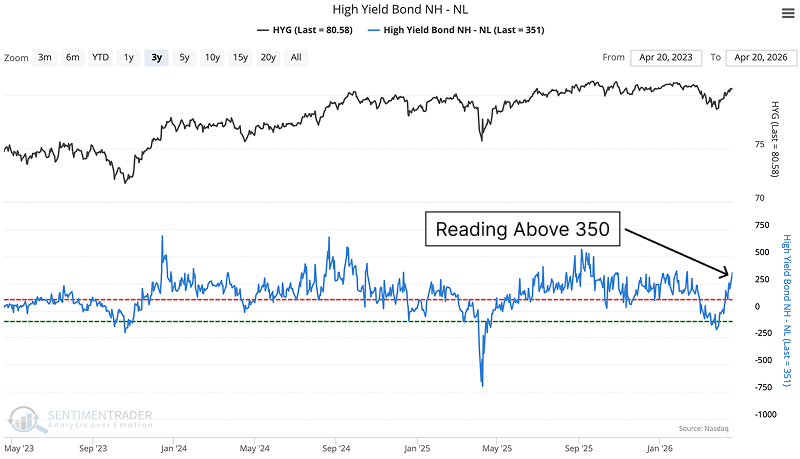
When high-yield bond new highs significantly outpace new lows-especially when breaching the 350-point threshold-it looks like a structural green light. The reality in the credit market is quite different. This extreme breadth reading is an exhaustion event for junk bonds.
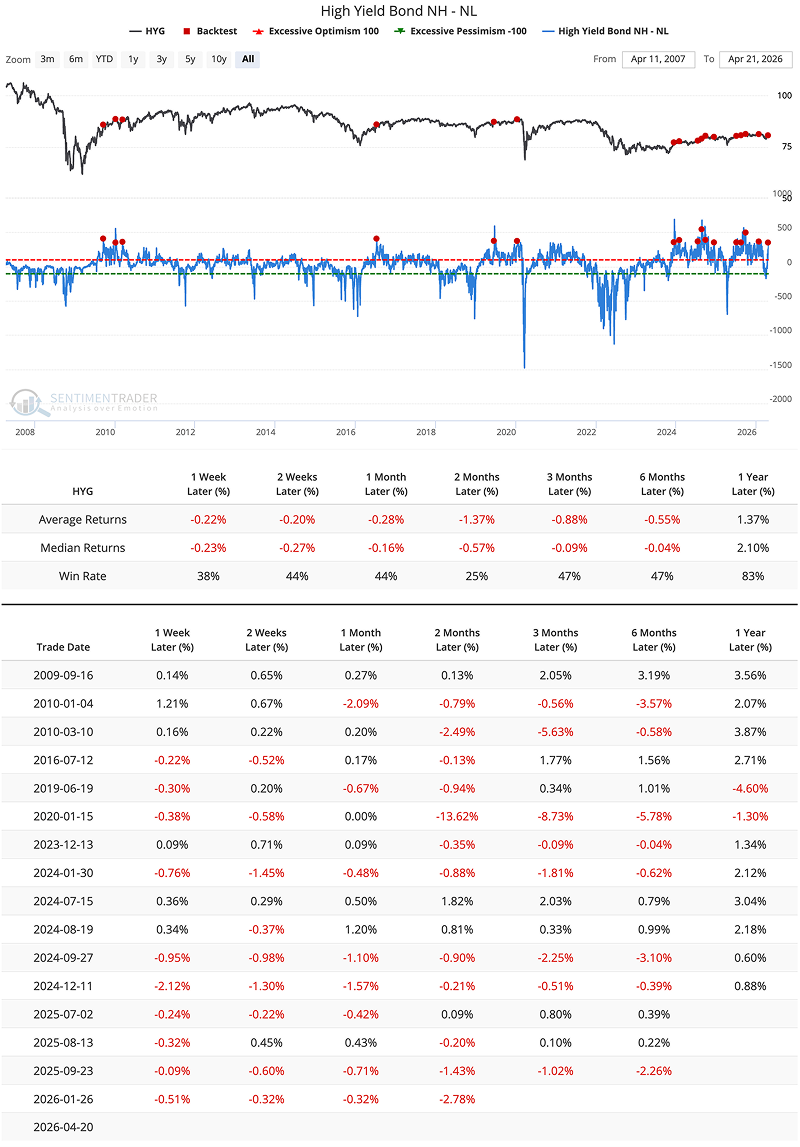
Two months after the signal, HYG has only rallied 25% of the time. The average path is negative from one week to six months out.
Stocks handle this much better. The S&P 500 does not immediately collapse just because credit breadth is overextended.
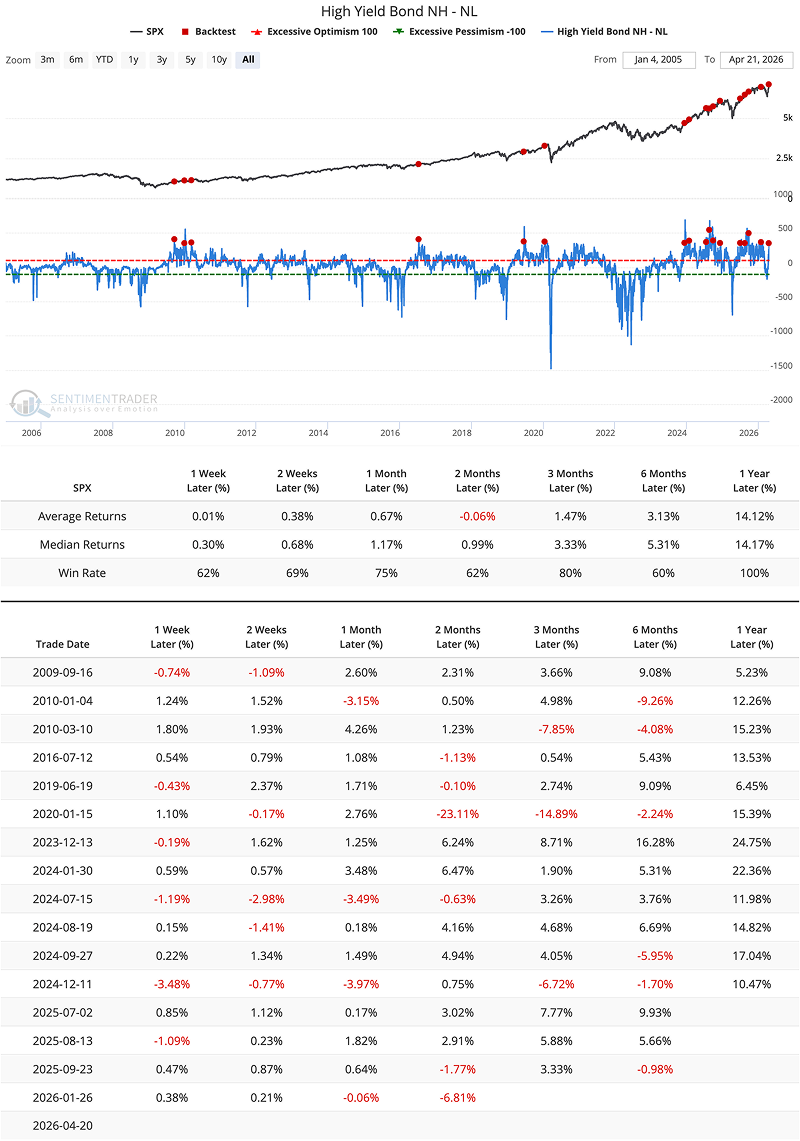
Three months after the signal, the stock index is higher 80% of the time. The key is the bumps along the way. The two-month window is usually flat, and six months out, the probability of positive returns drops to 60%. Equity momentum will eventually feel the drag of a stalling credit market, but the immediate pain is confined to the debt itself.
Under the hood, participation is stalling
The lackluster participation among high-yield bonds kept its long-term McClellan Summation Index in negative territory even when the S&P 500 was making new highs. That's what happened at the peak in 2025.
For the high-yield market itself, this divergence has historically been highly punishing. In the eight such events since 2013, HYG has experienced a steady drawdown. Three months later, the probability of a gain is only 29%. By six months, the average loss has reached 3%, with an average maximum drawdown of 5%. The one-year outlook is even worse, with average losses near 5%.
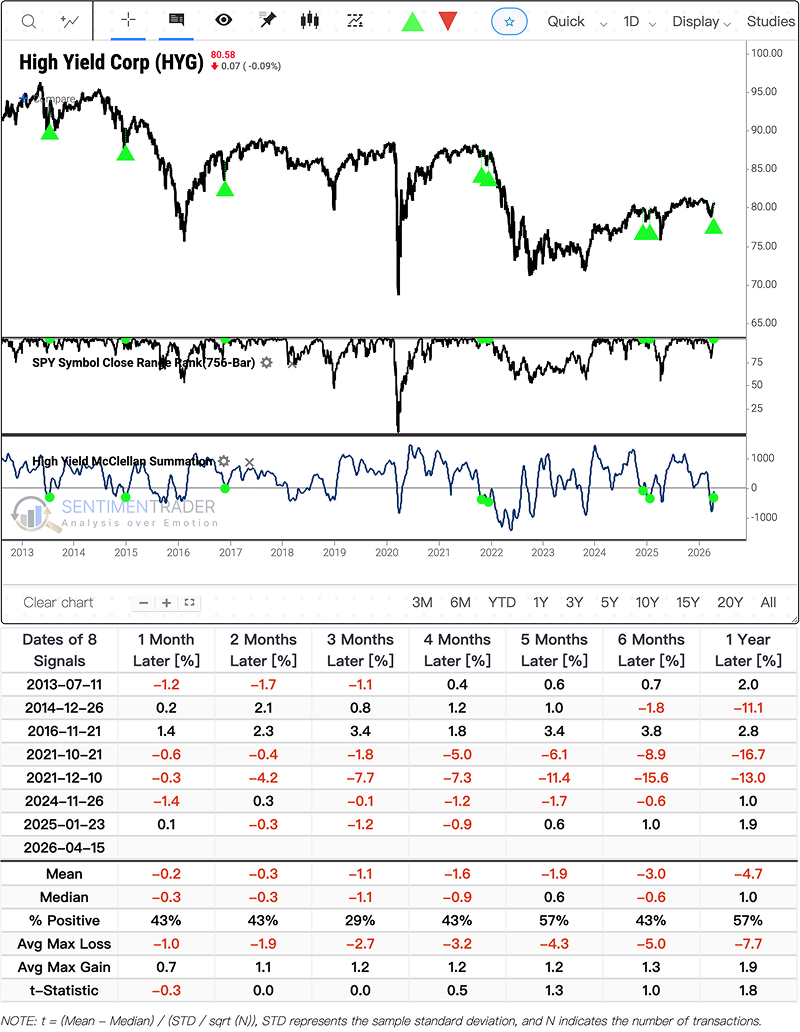
What the research tells us...
Historically, this specific divergence has been highly punitive for the debt market itself. Following similar signals, high-yield bonds (HYG) have faced steady drawdowns, with a low probability of gains and negative average returns over the subsequent three to six months. However, the data does not support an immediate bearish call on equities.
The S&P 500 has typically absorbed these credit breadth divergences well in the short term-often rising in the first three months-though its probability of positive returns tends to decay as the timeline extends to six months.