
High correlations may be a positive for these four sectors

Key points
- The heart of sentiment analysis is recognizing extremes in investor behaviour
- This concept applies to sectors, i.e., when investors sour en masse on a given sector, it often signals opportunity
- Our Component Correlation indicator recently detected this type of activity in Material, Energy, Technology, and Consumer Discretionary
What you need to know about Component Correlation
Our component correlation indicators measure the degree of correlation in price action among members of a given index. During times of panic, investors tend to buy or sell "everything" together, no matter their individual merits, so correlation rises. The higher it goes, the more we see groupthink, which tends to happen at times of extreme pessimism, and is thus usually a positive for that sector in the future. When conditions are calm and investors become complacent, they trade stocks on their own merits, and correlation drops. That tends to lead to below-average returns for the sector going forward.
Let's look at some recent component correlation actions in various sectors.
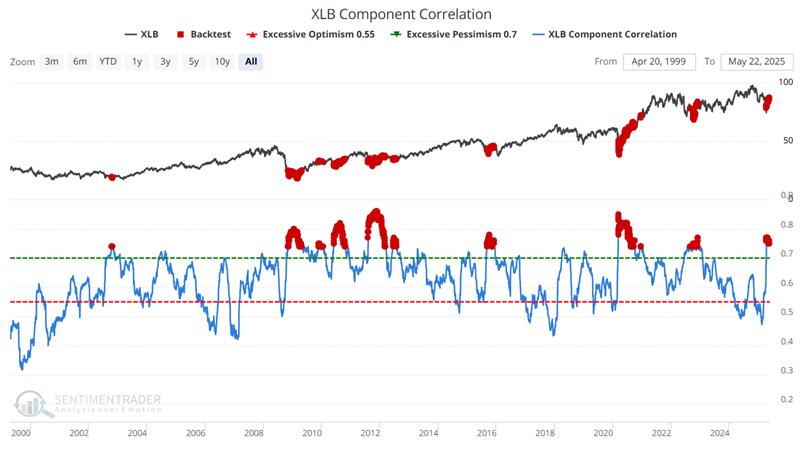
Sector #1: Materials (XLB)
The Materials Select Sector SPDR Fund (XLB) tracks the S&P 500 Materials sector. The chart below highlights all dates when the XLB Component Correlation indicator was above 0.74.
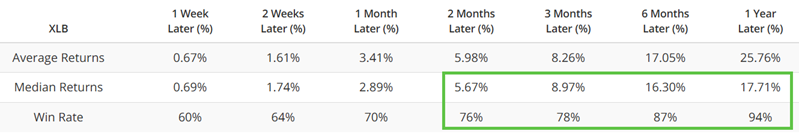
The table below summarizes subsequent XLB performance.
For comparison, the table below displays subsequent XLB performance when the XLB Component Correlation was below 0.55.
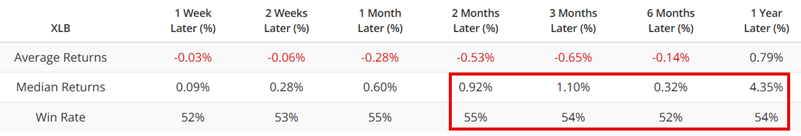
NOTE: These "lower correlation" values are NOT necessarily bearish and DO NOT imply a "Sell signal." What matters is that trading is a game of putting the odds in your favor. So, the key point here is the tendency for significantly higher Win Rates and Median Returns following higher component correlation readings and significantly lower Win Rates and Median Returns following lower component correlation readings. This comment applies to all the sectors that follow.
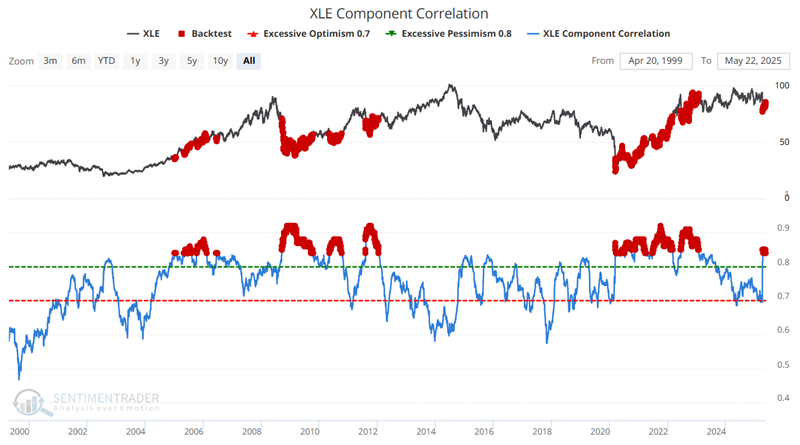
Sector #2: Materials (XLE)
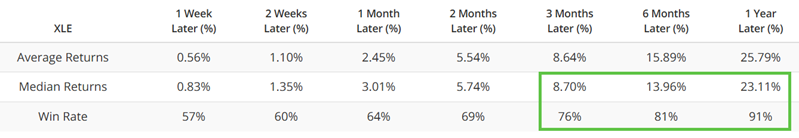
The Energy Select Sector SPDR Fund (XLE) tracks the S&P 500 Energy sector. The chart below highlights all dates when the XLE Component Correlation indicator was above 0.84.
The table below summarizes subsequent XLE performance.
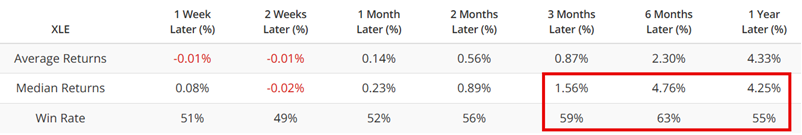
For comparison, the table below displays subsequent XLE performance when XLE Component Correlation was below 0.70.
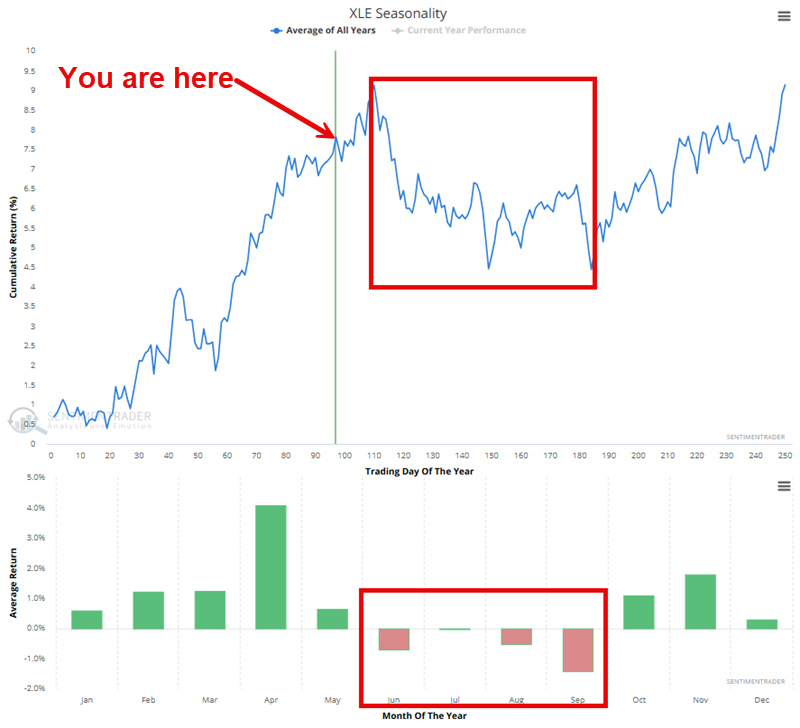
Let's add one word of caution regarding energy sector seasonality. While the data above suggests potential strength for energy in the year ahead, the Annual Seasonal Chart reminds us that energy often struggles between early June and late October. As long as price action is favorable, an investor or trader with a high conviction in energy can "stay the course." But others might want to "check back in" on energy later this year for the possibility of a strong advance in late 2025 or early 2026.
Sector #3: Technology (XLK)
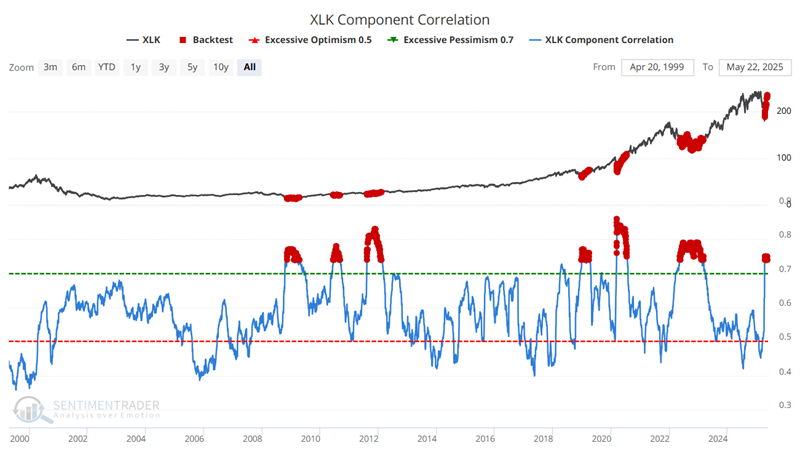
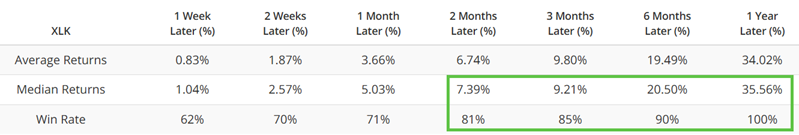
The Technology Select Sector SPDR Fund (XLK) tracks the S&P 500 Technology sector. The chart below highlights all dates when the XLK Component Correlation indicator was above 0.74.
The table below summarizes subsequent XLK performance.
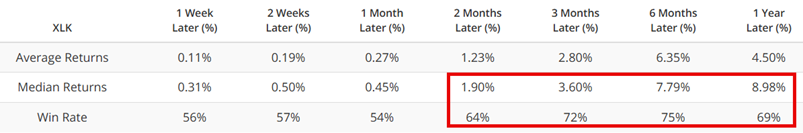
For comparison, the table below displays subsequent XLE performance when the XLK Component Correlation was below 0.50.
Sector #4: Consumer Discretionary (XLY)
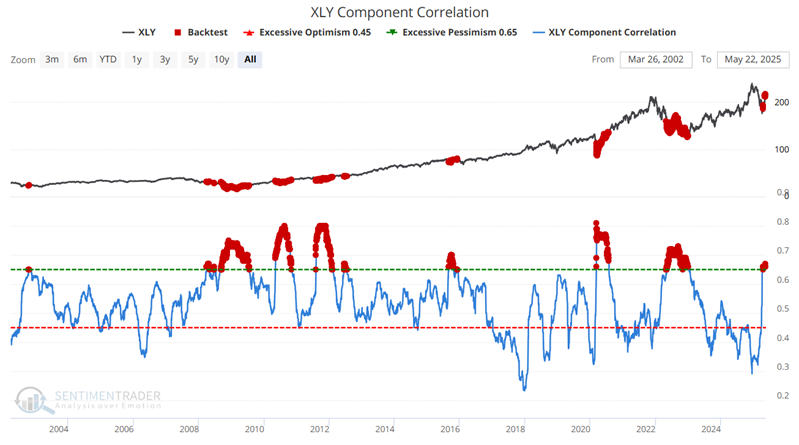
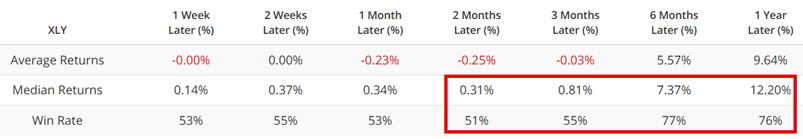
The Consumer Discretionary Select Sector SPDR Fund (XLY) tracks the S&P 500 Consumer Discretionary sector. The chart below highlights all dates when the XLY Component Correlation indicator was above 0.65.
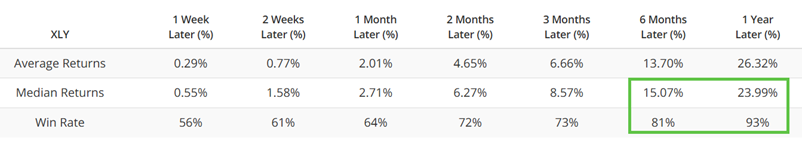
The table below summarizes subsequent XLY performance.
For comparison, the table below displays subsequent XLY performance when XLY Component Correlation was below 0.45.
What the research tells us…
Our Component Correlation indicators are merely that - indicators. They do not constitute a complete trading system, and "signals" generated should be viewed as "weight of the evidence" and not as "automatic" buy or sell signals. That said, the data detailed above adds significant weight to the favorable side of the weight of the evidence ledger for the sectors highlighted. Investors are encouraged to look for price action confirmation. At the moment, Technology (XLK) and Consumer Discretionary (XLY) are above their respective 200-day moving averages, while Materials (XLB) and Energy (XLE) are not.