Indicators &
Backtest Tools
Research
Reports
Report Solutions
Reports Library
Strategies
& Scanner
Free
Resources
Simple Backtest Calculator
Simple Seasonality Calculator
The Kelly Criterion Calculator
Sentiment Geo Map
Public Research Reports
Free Webinar
Pricing
Company
About
Meet Our Team
In the News
Testimonials
Client Success Stories
Contact
Log inLoginSign up
< BACK TO ALL REPORTS

High Beta vs. Quality Risk-On Signal

Dean Christians
2021-11-02

A trading model that compares the performance of high beta stocks to quality stocks registered a new risk-on buy signal for the S&P 500 at the close of trading on 11/1/21.

According to S&P Dow Jones, the S&P 500 high beta index contains stocks that are more sensitive to changes in market returns. In contrast, the S&P 500 quality index seeks to isolate stocks using a quality score based on return on equity, accruals, and financial leverage. 

In simple terms, we call this factor investing.

Let's assess the outlook for the S&P 500 when investors make a directional bet on the market by favoring high beta over quality.

RELATIVE RATIO RANGE SIGNAL CONCEPT

The concept I use to identify relative ratio range signals is simple. I calculate the ratio for two securities and measure the range over a lookback period in percentage terms. The range rank methodology allows one to test threshold levels between 0 and 100%. I then optimized the signal to determine the most favorable lookback period, reset and buy level thresholds.

PARAMETERS FOR HIGH BETA VS QUALITY RATIO RANGE SIGNALS

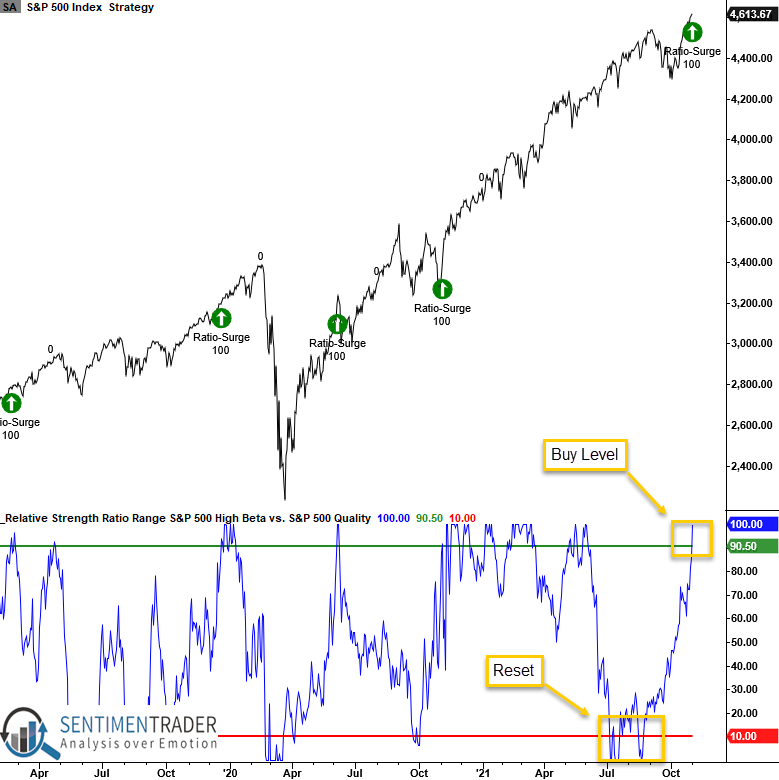
Ratio = S&P 500 High Beta Index/S&P 500 Quality Index. The range rank for the relative ratio utilizes an 84-day lookback period. 

  1. If the relative ratio range rank crosses below 10%, the reset condition is true.
  2. If the reset condition is true and the relative ratio range rank crosses above 90.5%, buy the S&P 500 index.

CURRENT DAY CHART

HOW THE SIGNALS PERFORMED

Results look good across all time frames, especially the 1-month window. And, if we exclude the 2000-02 bear market period, the 1-year performance and risk/reward profile is outstanding.

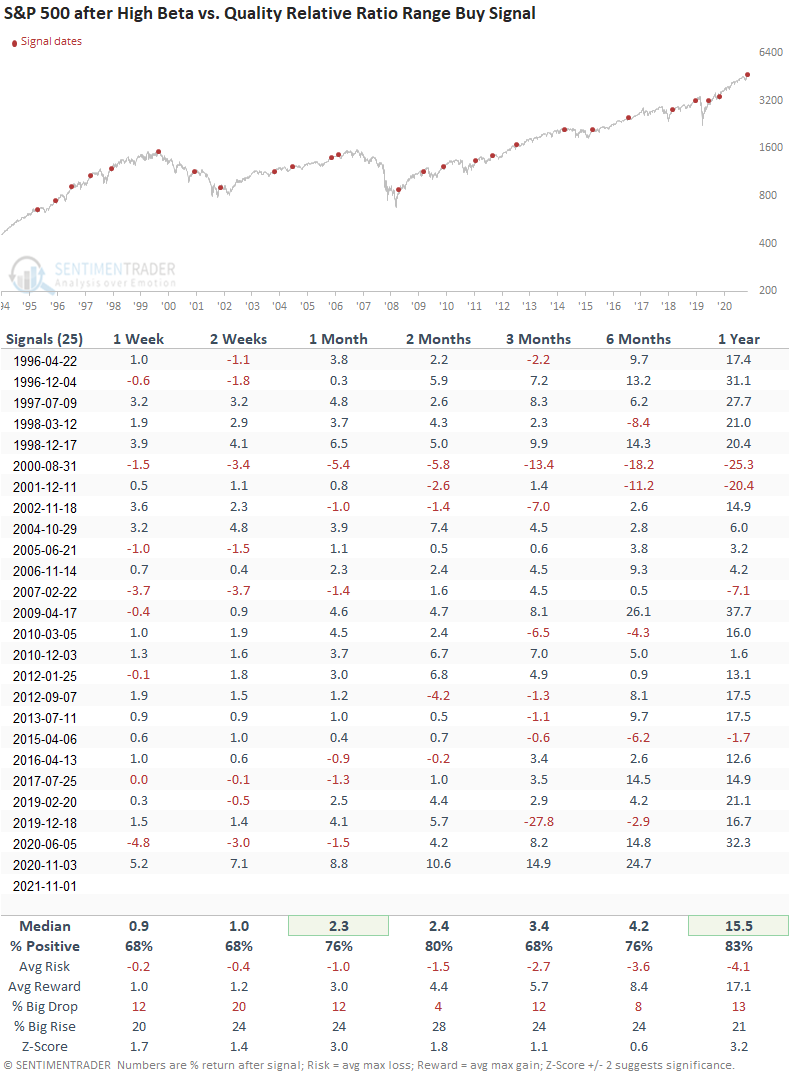
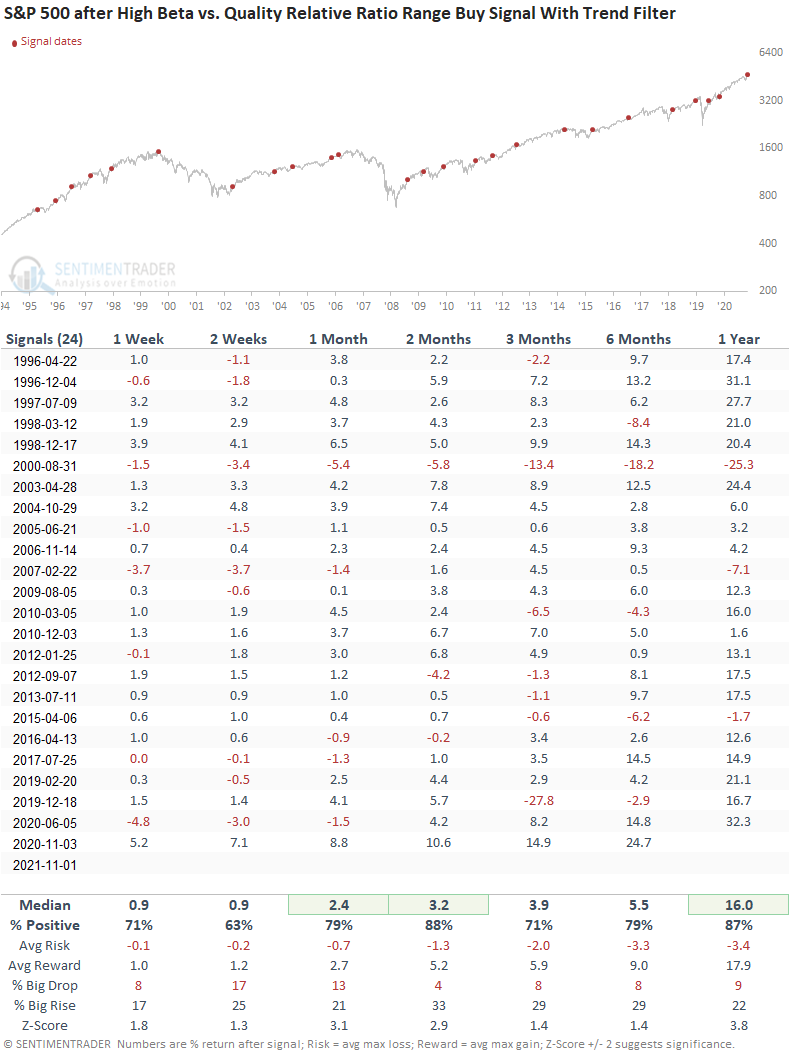
Let's add a trend filter to the study to isolate instances similar to the current one. I will keep the original study parameters but now include a condition that requires the S&P 500 Index to be trading above its respective 200-day moving average.

HOW THE SIGNALS PERFORMED

Results look solid across all time frames with several notable risk/reward profiles. The consistency and risk/reward profile in the 2-month window suggests smooth sailing for a year-end rally.

KEY TAKEAWAYS:

  • A signal occurs when high beta stocks outperform quality stocks 
  • The model has a 88% win rate over the next two months when the S&P 500 is trading above its 200-day average
  • The signal suggests the year-end rally can continue

Sorry, you don't have access to this report

Upgrade your subscription plan to get access
Go to Dasboard
Indicators & Backtest Tools
IndicatorEdge
‍
BackTestEdge
‍
Other Tools
‍
DataEdge API
RESEARCH
reports
Research Solution
‍
Reports Library
‍
Strategies & Scanner
Trading Strategies
‍
Smart Stock Scanner
‍
FREE
RESOUrCES
Simple Backtest
Calculator
Simple Seasonality
Calculator
The Kelly Criterion
Calculator
Sentiment Geo Map
‍
Public Research Reports
‍
Free Webinar
COMPANY
‍
About
‍
Meet our Team
‍
In the News
‍
Testimonials
‍
Client Success Stories
Pricing
Bundle pricing
‍
Announcements
‍
FAQ
© 2024 Sundial Capital Research Inc. All rights reserved.
Setsail Marketing
TermsPrivacyAffiliate Program
Risk Disclosure: Futures and forex trading contains substantial risk and is not for every investor. An investor could potentially lose all or more than the initial investment. Risk capital is money that can be lost without jeopardizing ones’ financial security or life style. Only risk capital should be used for trading and only those with sufficient risk capital should consider trading. Past performance is not necessarily indicative of future results.

Hypothetical Performance Disclosure: Hypothetical performance results have many inherent limitations, some of which are described below. No representation is being made that any account will or is likely to achieve profits or losses similar to those shown; in fact, there are frequently sharp differences between hypothetical performance results and the actual results subsequently achieved by any particular trading program. One of the limitations of hypothetical performance results is that they are generally prepared with the benefit of hindsight. In addition, hypothetical trading does not involve financial risk, and no hypothetical trading record can completely account for the impact of financial risk of actual trading. for example, the ability to withstand losses or to adhere to a particular trading program in spite of trading losses are material points which can also adversely affect actual trading results. There are numerous other factors related to the markets in general or to the implementation of any specific trading program which cannot be fully accounted for in the preparation of hypothetical performance results and all which can adversely affect trading results.

Testimonial Disclosure: Testimonials appearing on this website may not be representative of other clients or customers and is not a guarantee of future performance or success.