
High beta versus high quality offers a surprising clue

Key points
- As the stock market has plunged, many reliable indicators flashed "oversold" signals
- Many of these individual signals do not necessarily qualify as standalone "buy" signals, but taken together, they do suggest not giving in completely to panic and fear
- This note looks at a recent signal from our S&P High Beta / S&P High Quality Relative Ratio Rank indicator
Where we stand
The stock market contorts in large fits and starts daily as investors try to assess the likely impact of tariff threats and/or implementations. No one knows for sure what the ultimate result will be, yet most opinions are stated with nearly 100% certainty. As the stock market hates uncertainty above all else, it is reasonable to expect extreme volatility to continue-likely with further downside.
In the short term, investors' primary focus should be on deciding how to manage risk. Looking further out, the plethora of breadth, sentiment, volatility, and options-related indicators that have recently flashed "favorable" signals would seem to bode well for stocks six to twelve months out. The problem is that "favorable" is NOT the same as "bullish" or "buy stocks right now for immediate gains."
"Hope for the best, prepare for the worst" remains the operative phrase. With that in mind, let's look at one more recent favorable signal.
S&P High Beta / S&P High Quality Relative Ratio Rank reverses higher
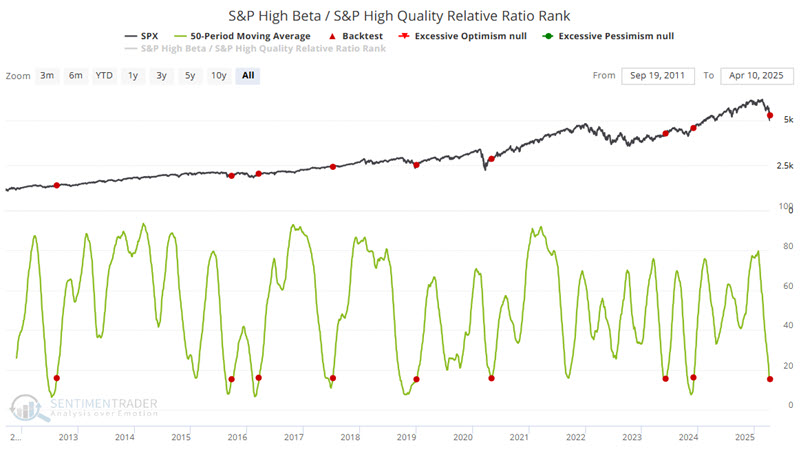
The S&P High Beta / S&P High-Quality Relative Ratio Rank indicator shows where the ratio is relative to its range over the past four months. When the relative ratio is high, investors are showing risk-on behavior. When the ratio drops to a low level, they exhibit risk-off behavior.
One useful application is looking for a slightly longer-term moving average to fall to a low level and then reverse higher. The chart below highlights those dates when this indicator's 50-day moving average crossed above 15.2.
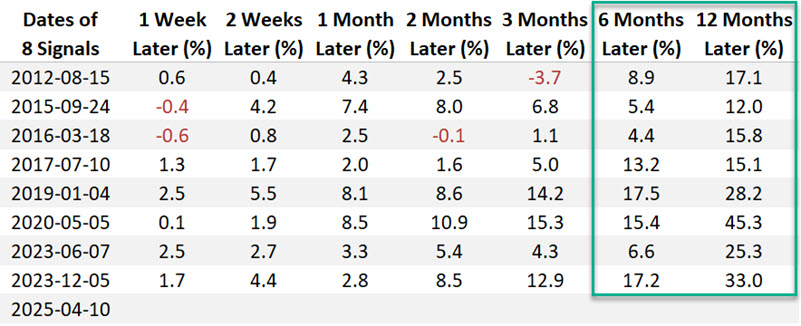
The table below displays subsequent S&P 500 performance on a signal-by-signal basis.
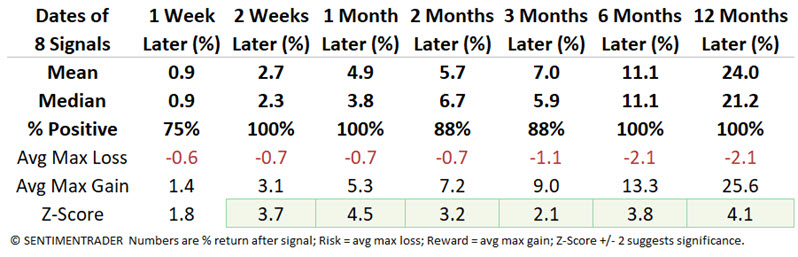
The table below summarizes S&P performance following the signals highlighted above.
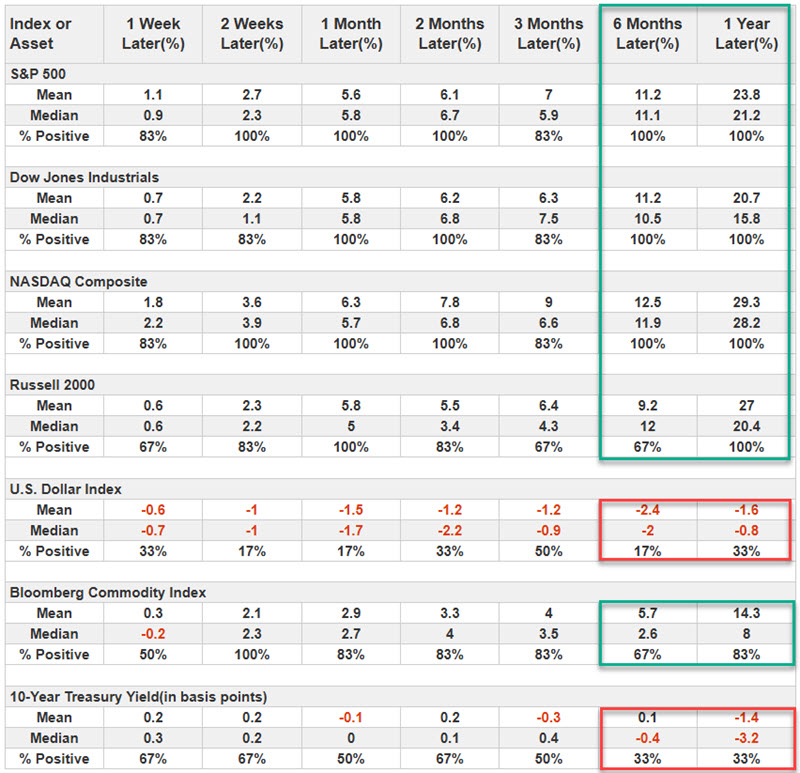
No investor should rely solely on this signal to determine their investment strategy. That said, the table below displays first-year results for various indexes. Historically, stocks and commodities have advanced while the US Dollar and bond yields have declined. Past performance is no guarantee of future results.
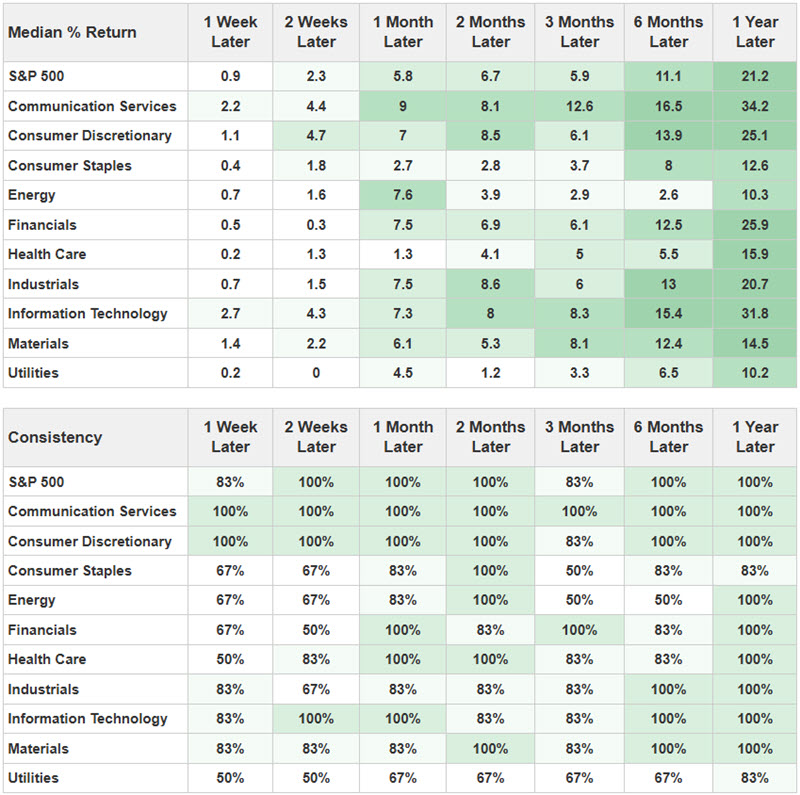
The table below summarizes the first-year performance for the S&P 500 sectors.
What the research tells us…
The fear overwhelming the markets of late is based on the concern that recent events are not "business as usual." The bearish argument at present is that the proliferation of tariffs will lead to a global trade war, which will lead to a worldwide economic slowdown, which could lead to a global depression. This outcome remains one of the possible outcomes. In light of such uncertainty, it is reasonable to be cautious and expect significant volatility to continue for some time.
Beyond that, however, traditional indicators of breadth and sentiment are lining up in abundant fashion on the favorable side of the weight of the evidence ledger. The best course of action would be a) do what you must to manage risk and keep it to a reasonable level and b) not to close your eyes to the potential for a strong rally once some of the uncertainty is alleviated.