
Here come the breadth thrust buy signals

Key points:
- A ratio between advancing and declining issues for the S&P 1500 surged higher
- The burst in participation triggered a new breadth thrust buy signal on Thursday
- The S&P 500 rallied 97% of the time over the next 12 months after other signals
- If I isolate instances that occurred in a bear market, the S&P 500 rallied 100% of the time a year later
- High yield bonds also triggered a breadth thrust buy signal
- After similar signals, stocks and high yield bonds were higher 100% of the time a year later
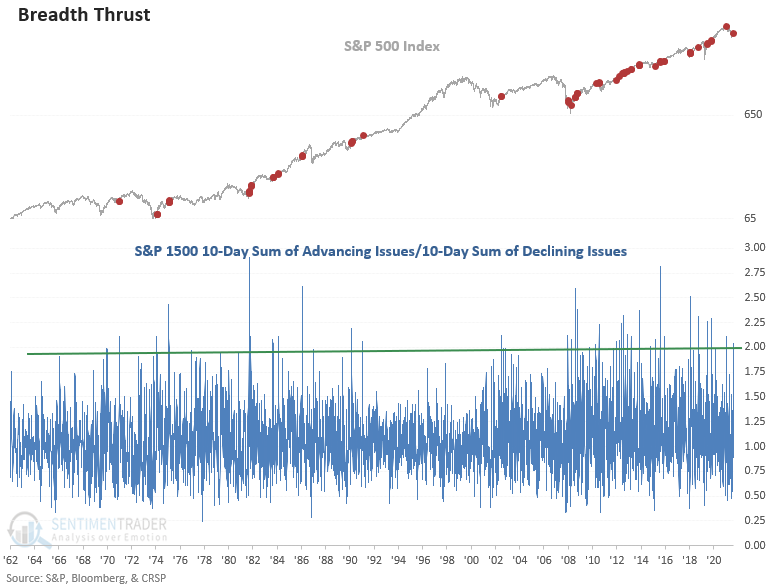
Advancing issues are outpacing declining issues, triggering a breadth thrust alert
The breadth thrust model identifies when the 10-day sum of S&P 1500 advancing issues exceeds the 10-day sum of S&P 1500 declining issues by 1.97 to 1. I use a reset condition to screen out repeats, which requires the ratio to fall below 0.8 before a new signal can trigger again.
The breadth thrust or otherwise known as breakaway momentum, was made famous by the legendary market analyst Walter Deemer. The original concept used NYSE issues, which did not trigger a signal on Thursday.
It's important to note that the new signal from a basket of stocks across all market capitalizations coincided with a thrust from members in the more economically sensitive S&P 400 and 600 indexes. i.e., mid and small-cap stocks. If you were wondering, the S&P 500 narrowly missed a signal on Thursday.
Due to the limited history of the all-cap index, I apply the S&P 1500 signals to the S&P 500 index.
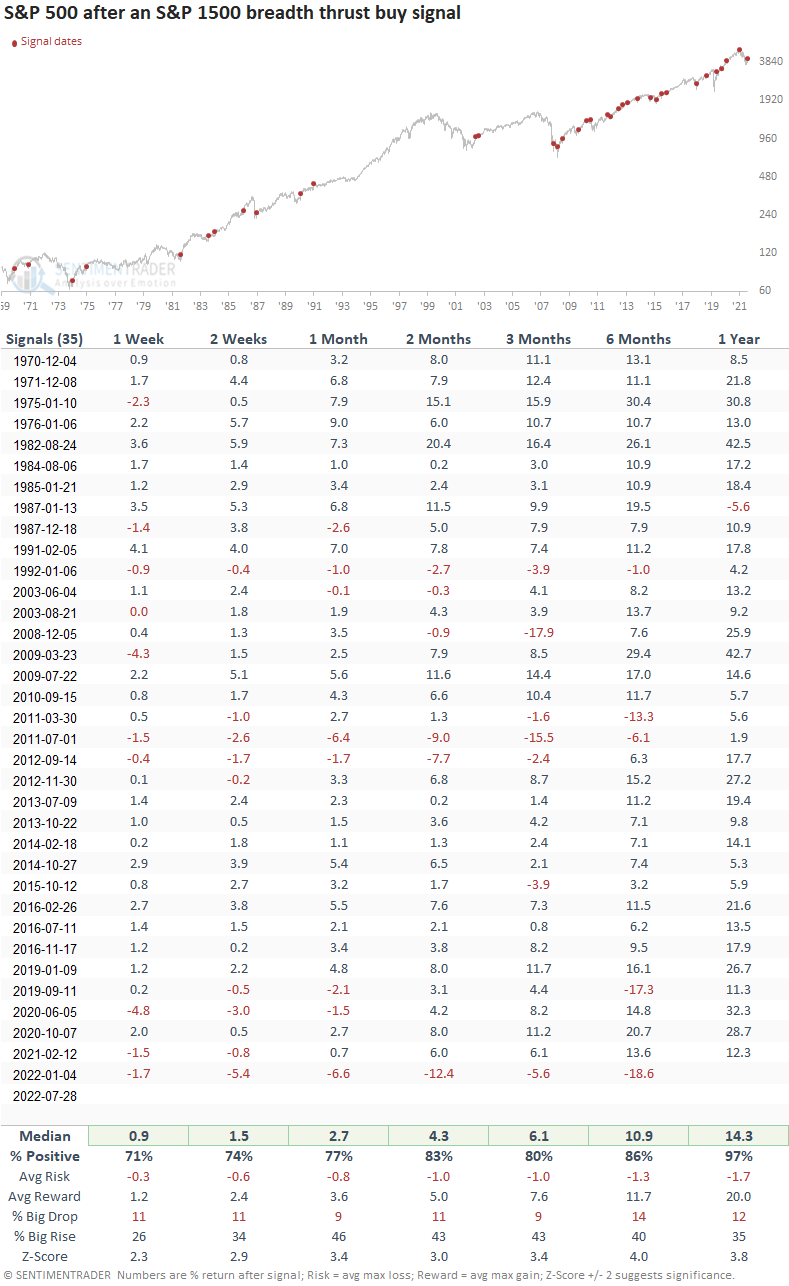
Similar surges in participation preceded gains 97% of the time
This model generated a signal 35 other times over the past 52 years. After the others, S&P 500 future returns, win rates, and z-scores were excellent across all time frames. A year later, large-cap stocks were higher 97% of the time. And, the one drawdown in that period was -5.6%. However, the most recent signal on 1/4/22 is a good reminder that no single indicator is infallible, especially when Federal Reserve policy is unfriendly.
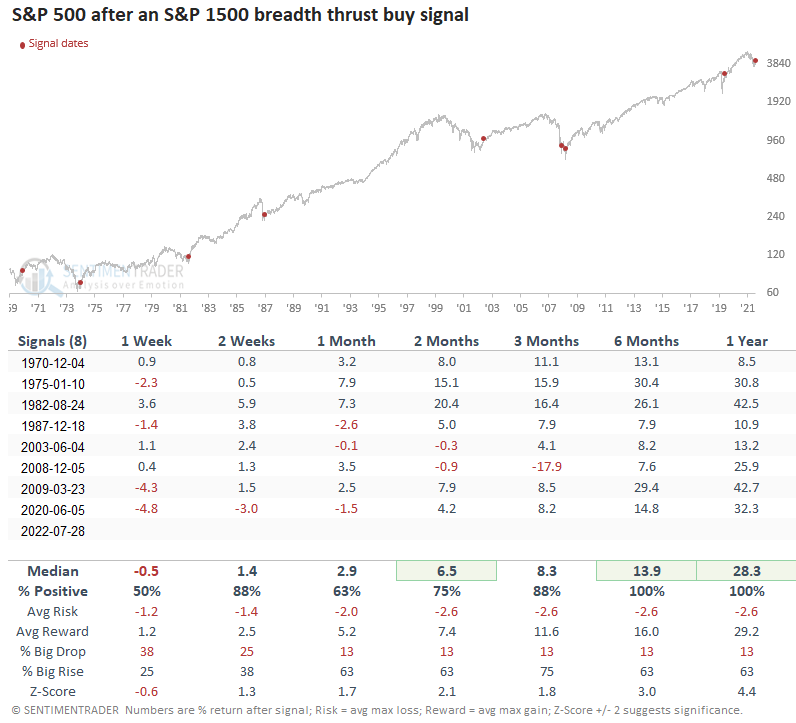
Signals associated with a bear market
If I isolate instances that occurred after the S&P 500 closed down 20% from a high, the model triggered a signal 8 other times in the last 52 years. After the others, S&P 500 future returns, win rates, and z-scores were excellent across all time frames. The signal has a perfect record 6 & 12 months later. However, the alert in December 2008 is a good reminder that the path to higher stock prices is not always smooth.
High yield bond breadth thrust signals
I use the same breadth thrust model/concept for high-yield bonds. However, the threshold level for a signal is 1.59/1.
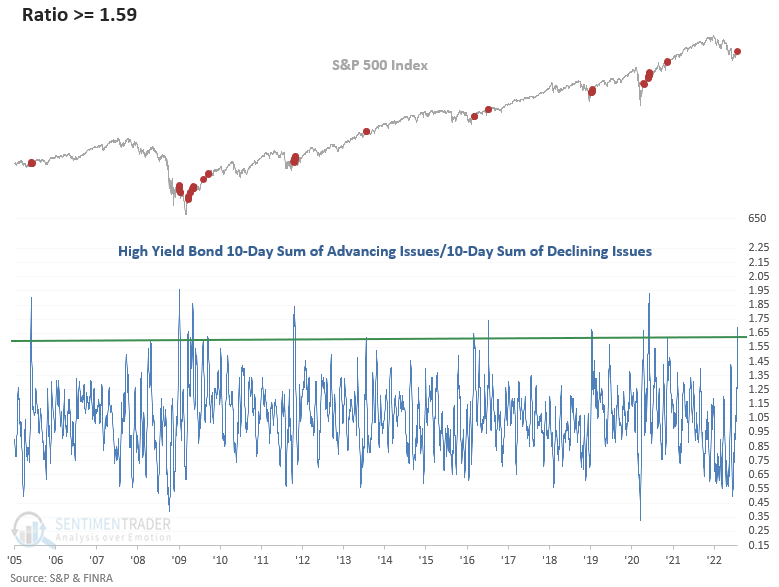
Similar surges in participation preceded gains 100% of the time for stocks
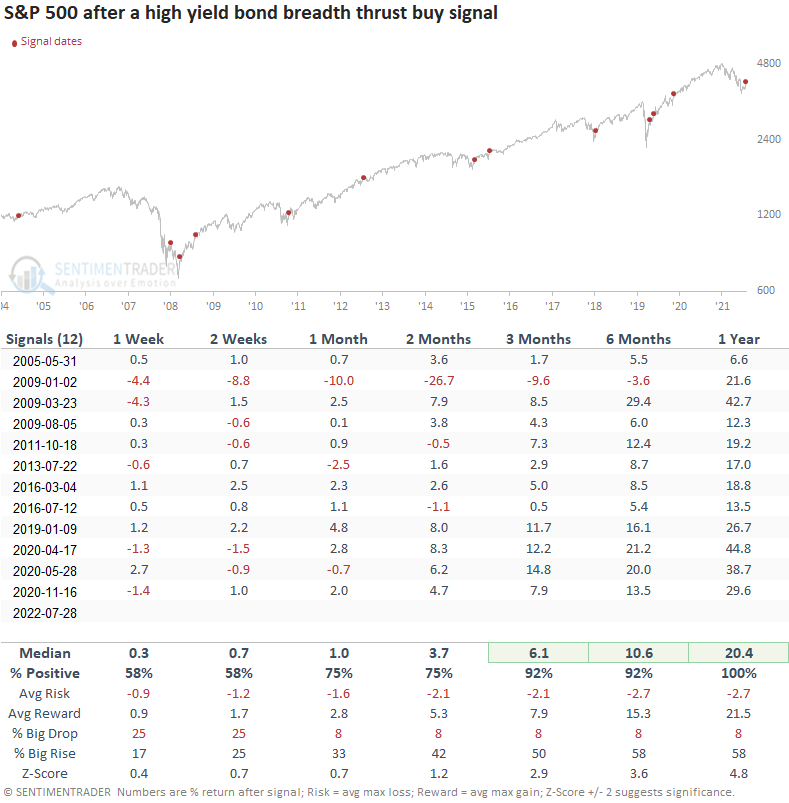
This model generated a signal 12 other times over the past 18 years. After the others, S&P 500 future returns, win rates, and z-scores were excellent across all time frames. A year later, large-cap stocks were higher 100% of the time. However, the signal on 1/2/09 acts as a good reminder that alerts can trigger during a big bear market bounce.
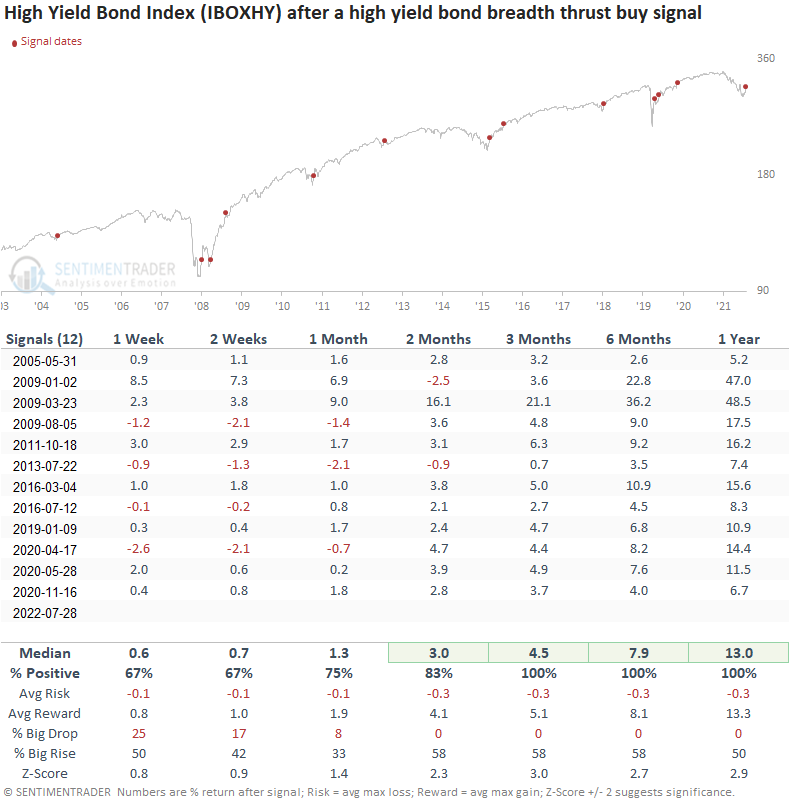
Similar surges in participation preceded gains 100% of the time for high-yield bonds
High bonds performed exceptionally well with a 100% win rate across the 3, 6, and 12-month periods. And the January 2009 signal, which was unfavorable for equities, experienced a relatively mild drawdown 2 months later. I would keep a close eye on the high-yield bond market, especially if you're in the recession camp.
What the research tells us...
When the ratio between advancing and declining issues surges in favor of advancing issues, the burst in participation provides a new energy source for the market. Similar setups to what we're seeing now have preceded rising S&P 500 prices across every time frame, with notable long-term results. The high yield bond market joined the party with a breadth thrust buy signal that suggests higher stock and high yield bond prices, especially a year later. While the market breadth backdrop for stocks and high yield bonds looks more constructive, we must remember that a rocky road lies ahead as long as inflation and the Fed remain unfriendly.