
Here and there: from France to gold stocks

Key Points
- The French stock market may be in the process of setting up for better days ahead - however, history suggests that things may get worse before they get better
- While gold stocks give the appearance of being poised to explode, there is reason to remain cautious until a clearly bullish trend is established
- In today's volatile environment, both of these ideas could be confirmed - or blown out of the water - in reasonably short order
France
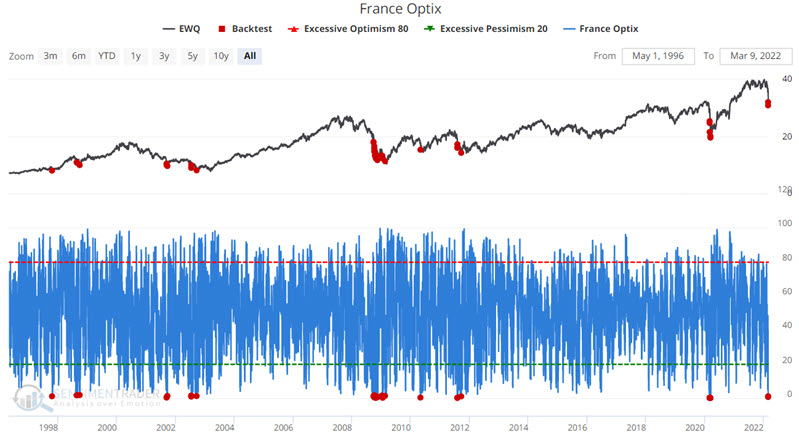
The chart below displays all days since 1996 when France Optix was below 2. A reading this low signals an absurdly washed-out level of bullishness (essentially, there is 2% bullish sentiment and 98% bearish sentiment). You can run this test in the Backtest Engine.
1-day readings are pretty volatile, and we typically like to smooth things out with a moving average. But consider the performance for EWQ (iShares France ETF) following previous single day readings below two, as shown in the table below.
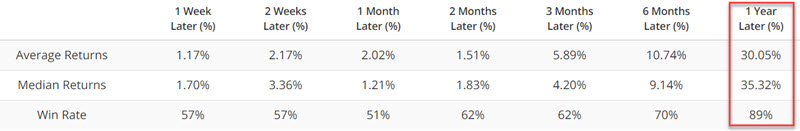
Results are generally positive - albeit not overwhelmingly so - through 6 months. But the 12-month returns are extremely robust - higher almost 90% of the time with a Median Return of a whopping +35%. The most recent readings below 2 occurred on 3/4/2022 and 3/7/2022.
Does this mean the bottom is in for French stocks and that the next 12 months will be smooth sailing? Not at all. EWQ suffered 12-month losses of over -15% following the September 2001 signals. Also, a closer look at the signal chart above shows a clear tendency for this signal to be early. Following most previous signals (see the red dots in the chart above), EWQ continued lower - sometimes precipitously - before finally bottoming out.
So, when might be the time to take a closer look at EWQ? The chart below displays the annual seasonal trend for EWQ. Note that it is still in an unfavorable period. However, note also that a favorable seasonal period extends from Trading Day of the Year (TDY) #56 through TDY #83.
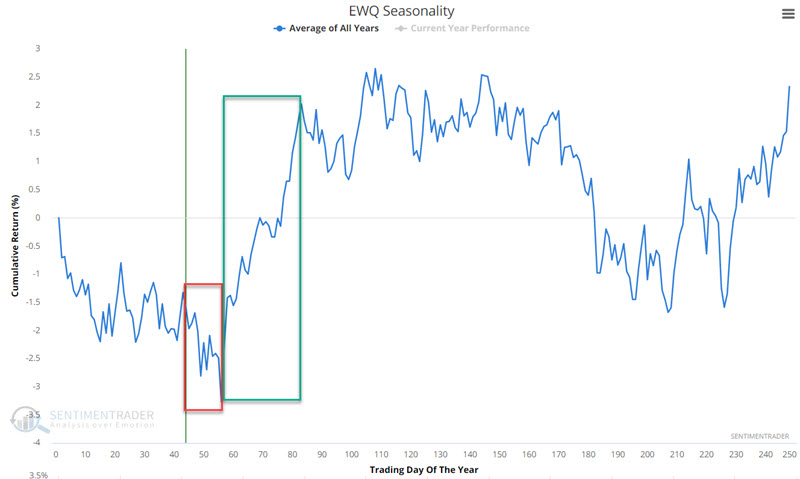
For 2022, the unfavorable period extends through 3/23. The favorable period extends from 3/23 through 5/2. The bottom line: if EWQ stages another decline into late March, it may well prove to be a buying opportunity.
Gold stocks
Gold, gold stocks - and everything inflation-related - appeared to be headed for the moon this week. But borrowing a scan from Jason leads us to caution that gold stocks are at a key "make or break" crossroads.
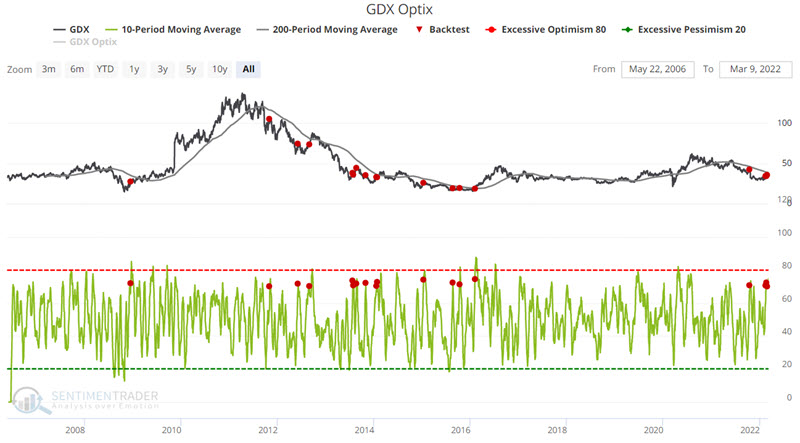
The chart below displays all days when the GDX Optix 10-day moving average exceeded 70 while GDX was still below its 200-day moving average. In other words, extremely bullish sentiment in a technical downtrend. You can run this test in the Backtest Engine.
The table below displays a summary of performance results following previous signals.
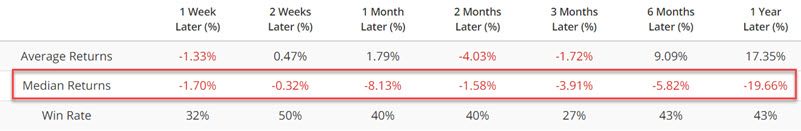
As you can see in the table above, Median Returns are negative across all time frames. Win Rates are below 50% for all time frames except two weeks after a signal.
Recent signals occurred on 2/18, 2/23, 2/25, and 3/1. Does this mean that gold stocks are doomed to fall? Not at all. If gold stocks follow through to the upside soon, it can negate the supposedly bearish message sent by this recent cluster of signals. But the, history does suggest that traders wait for some bullish confirmation before piling in.
What the research tells us…
When sharp trends develop quickly, it is only natural for traders to extrapolate those moves and assume that they will persist. This is often a mistake. That said, attempting to pick tops and bottoms is an exercise that is fraught with peril. Typically the best approach is to go with the trend until there is some objective reason to believe that a reversal is imminent or has already taken place.
EWQ plunged -22% in just over three weeks, so traders have become particularly bearish. But both sentiment and seasonality are pointing toward the potential for a reversal of fortune, potentially starting in late March. Conversely, gold stocks appear to have blasted off, soaring over 30% in roughly five weeks. Add in all of the inflation concerns, and - again - it is easy to assume that this trend persists. But Jason's twist on GDX Optix suggests that traders be alert to the potential for a sharp reversal.