
Hedging NVDA with an options collar - Updated

NOTE: The original email version of this article contained an incorrect chart. This version has been corrected. Sorry for any confusion. JK
Key Points
- Last week, we highlighted an options strategy known as a "collar," which is typically used to hedge an existing position
- We highlighted two different examples using NVDA
- This piece revisits those examples to see how they worked out following NVDA's blowout earnings return and subsequent surge
A quick review of the Collar strategy
The "classic" approach to a collar is to sell an out-of-the-money call option for every 100 shares held long and buy an equal number of put options. There are many choices regarding which option strike prices to buy and sell and which expiration to use.
We looked at two variations in the original article, updated below. In the original piece, we assumed that:
- An investor owned 500 shares of NVDA (presumably with a nice open profit)
- They were concerned about the potential for a disappointing earnings announcement to knock the stock down
- They wanted to hedge against this possibility
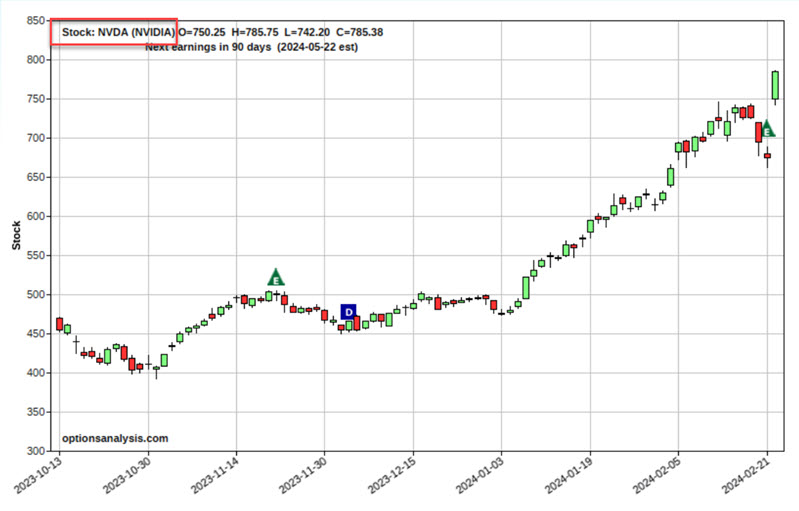
NVDA reports blowout earnings
As it turns out, any worries about NVDA earnings were misplaced. After the close on February 21, the company reported a massive increase in earnings and sales. The stock immediately exploded in aftermarket hours trading and followed through again on February 22. (all screenshots below are courtesy of Optionsanalysis.com)
So, how did our example hedges play out? Let's take a closer look.
The tighter hedge
The original example was intended to offer a relatively tight limit on any downside potential if things went wrong.
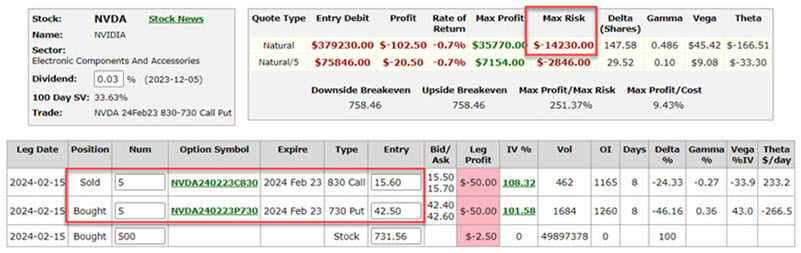
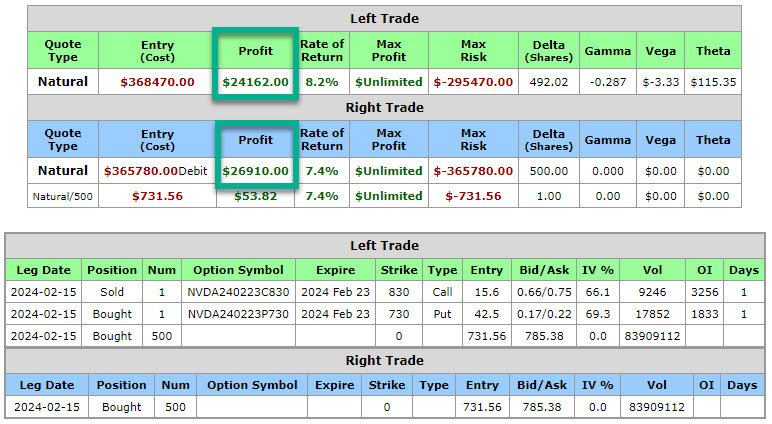
Since earnings were coming out on February 21, we used options expiring on 2024-02-23 for this example. With NVDA shares trading at $731.56 a share, our first example collar did the following:
- Hold 500 shares of NVDA trading at $731.56
- Sell February 5 23, 2024 830 strike price calls @ $15.60 (Delta of 24)
- Buy February 5 23, 2024 730 strike price puts @ $42.50 (Delta of 46)
The particulars for this position appear below.
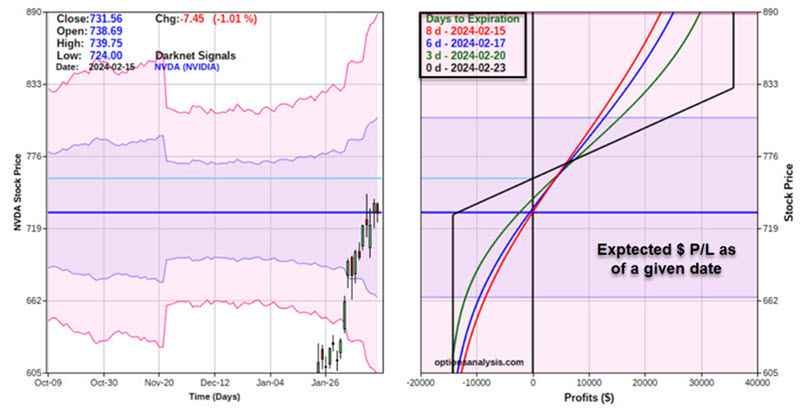
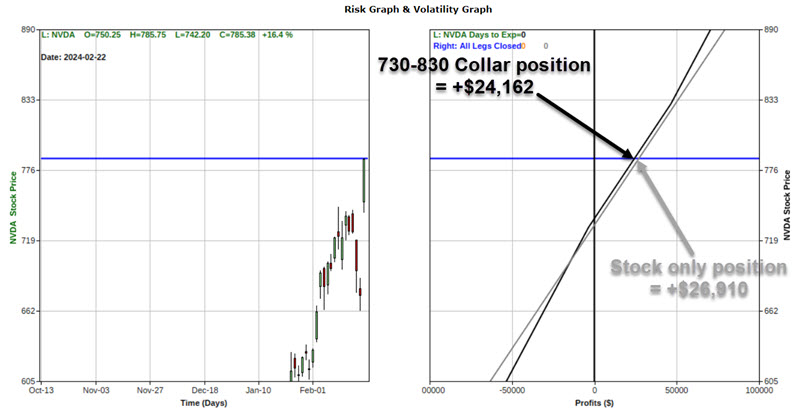
The risk curves (i.e., the expected dollar profit or loss at a given price for NVDA shares as of a given date) appear below (the black line represents option expiration day).
- This position required the investor to pay out $13,450 to enter.
- The maximum profit potential is $36,335 (if NVDA trades above the call strike price of $830)
- The maximum risk during the life of the collar is -$13,666 (if the shares drop below the put strike price of $730 a share)
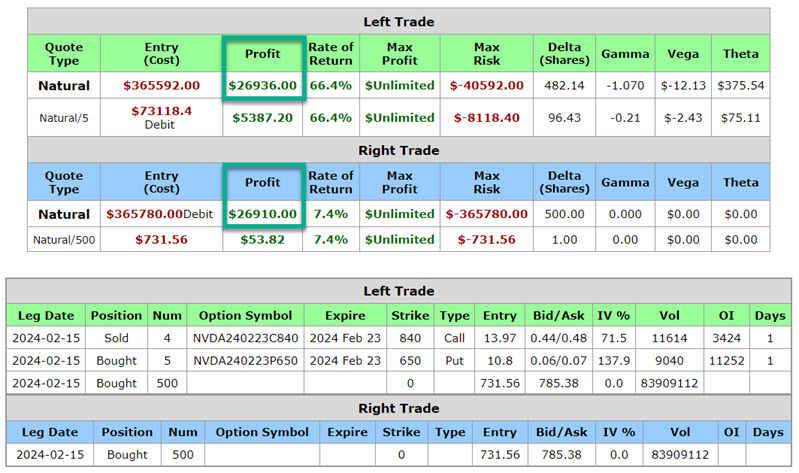
After the earnings announcement, NVDA shares closed on February 22 at $785.38. The status of the 730-830 collar example appears below.
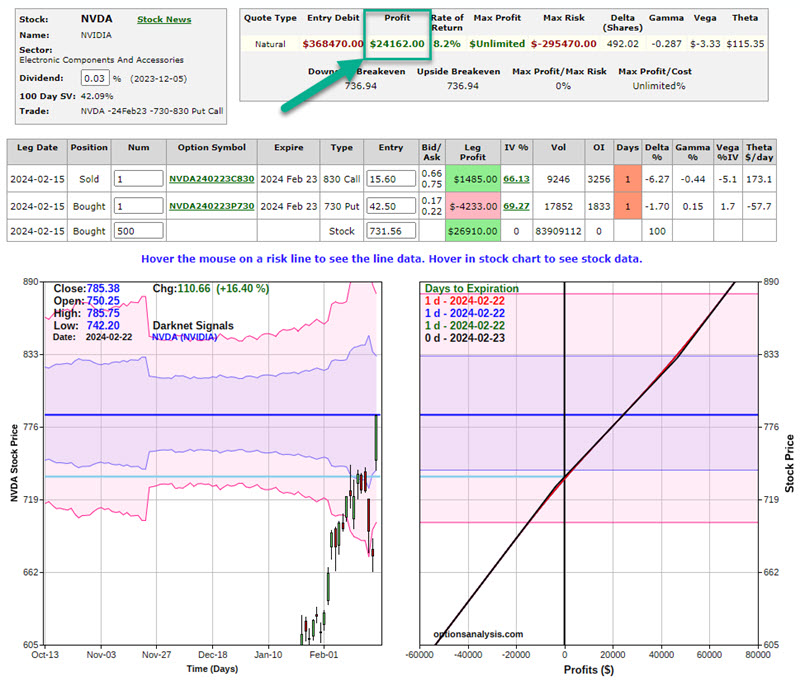
The good news is that (from the point the collar was entered) the position gained +$24,162. The bad news is that because the investor in this example paid out cash to enter the collar (which was a conscious decision on the part of the investor as their primary objective was minimizing the downside risk if things went the wrong way), they came out behind where they would have been had they done nothing.
In the screenshots below, we see that while the collared position ("Left Trade") gained +$24,162, the original position ("Right Trade") of just holding long 500 shares of NVDA gained +$26,190.
In hindsight, it is easy to say that this hedge should not have been entered into. The stock did great, and the hedged position underperformed a simple stock-only position. But that's the thing about hedging (and life in general) - hindsight is always 20/20. The bottom line is that the investor was willing to forego some upside potential for the peace of mind of limited risk in a worst-case scenario.
The looser hedge
This iteration of a collar was called the "open collar." With this approach, we sell fewer call options (to retain some unlimited profit potential) and use the proceeds to pay for most or all of the cost of the put options.
This strategy may be preferable in any or all of the following situations:
- The investor is unwilling to cap the upside potential completely
- The investor does not want to pay out cash to enter a hedge
- The investor is only interested in hedging against a significant decline in the stock
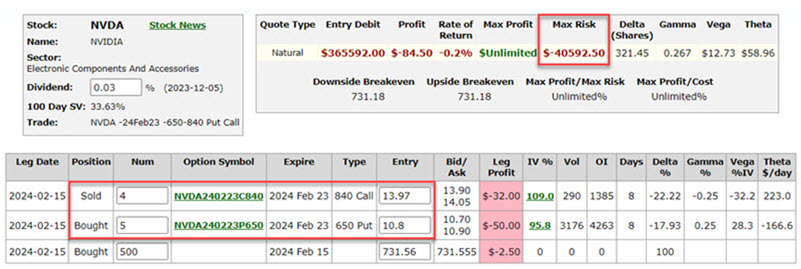
Once again, we used options expiring on 2024-02-23. With NVDA shares trading at $731.56 a share, we did the following:
- Hold 500 shares of NVDA trading at $731.56
- Sell February 4 23, 2024 840 strike price calls @ $13.97 (Delta of 22)
- Buy February 5 23, 2024 650 strike price puts @ $10.90 (Delta of 18)
The original particulars for this position appear below.
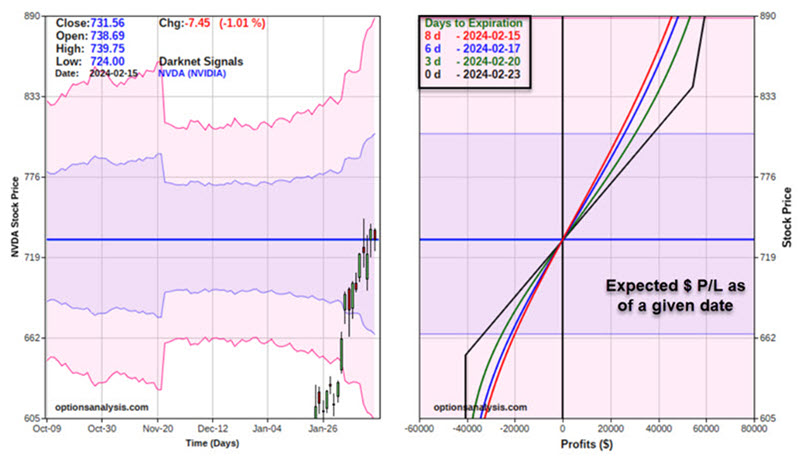
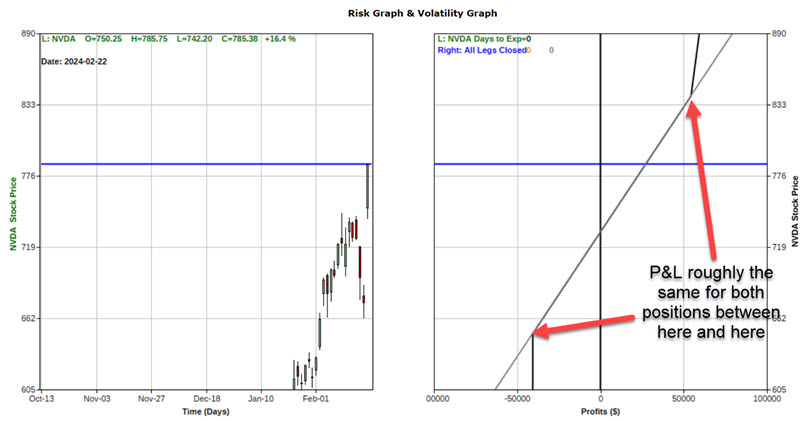
The risk curves (i.e., the expected dollar profit or loss at a given price for NVDA shares as of a given date) appear below (the black line represents option expiration day).
- This position received $5,584 for selling four calls @ $13.97 and paid $5,450 to buy five puts @ $10.90. The net result was a credit of $134 added to our account
- If NVDA rallies above $840 by February 23, we could have 400 shares called away at $840; however, we still retain unlimited profit potential on the remaining 100 shares
- The maximum risk during the life of the collar is -$40,952
After the earnings announcement, NVDA shares closed on February 22 at $785.38. The status of the 730-830 collar example appears below.
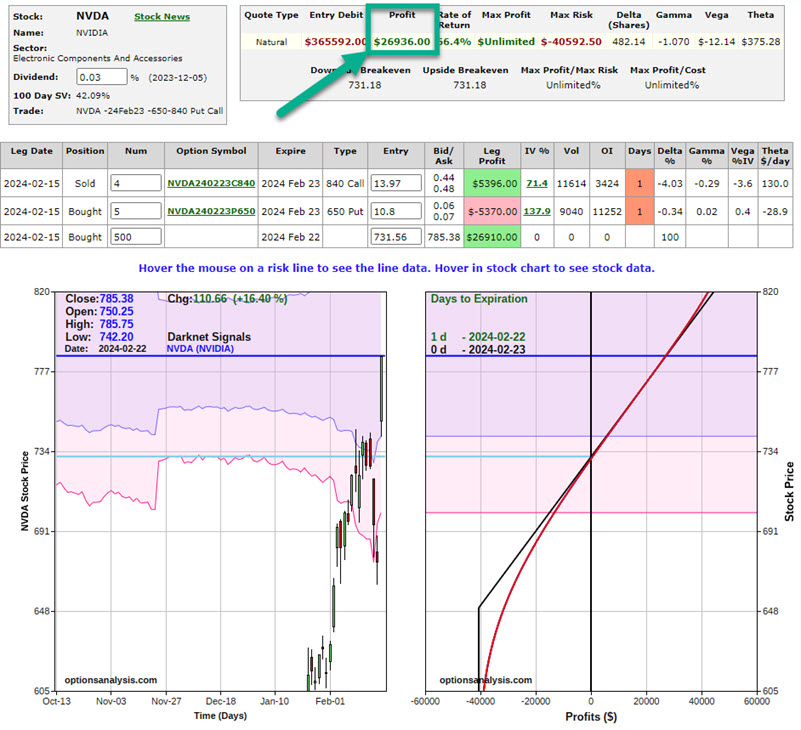
From the point the collar was entered, this position gained +$26,936. In the charts below, we see that (as of the close on February 22) the collared position showed a gain of +$26,936, while the original position of just holding long 500 shares of NVDA gained +$26,190.
What the research tells us...
In this case, the looser hedge was the better performer. But remember, the only reason to enter a hedge is if you are concerned about downside risk on a position you don't want to sell. In those cases, when your instinct to hedge is correct, a tighter hedge would likely come out ahead. Please note, however, the potential advantages of a collar that sells fewer calls than puts bought (it still offers a limit to downside risk but retains more upside potential).
Hedging an existing position can be achieved in any number of ways. The keys to selecting the proper position are first to decide if entering a hedge is even worth it in the first place. Remember that you are giving up some profit potential to limit risk with a collar. If the answer is "Yes," then you must determine how much profit potential you are willing to give up, how much downside risk you want to eliminate, and how much you are willing to pay out to enter the hedge.
There are no "correct" answers to any of the above questions - only ones that meet your objectives. Regardless of one's decisions, the collar is a quick and easy (and often low-cost) way to limit downside risk in a stock position.