
Hedging against a spike in volatility

Key points
- The VIX Index has declined to the low end of its historical range
- Volatility has a tendency to rise - and the stock market to fall - during the late September into mid-October period
- Options offer a relatively inexpensive way to hedge against such an occurrence - but probability is a question mark
Volatility at a low level
The VIX Index measures the implied volatility for options on the S&P 500 Index. It is often called the "fear gauge" because it tends to "spike" to sharply higher levels when the stock market experiences a sharp decline.
Ticker VXX is an ETN (Exchange-traded note) that purports to track the action of VIX futures. In reality, it does a poor job of tracking the VIX Index. Due to the vagaries of futures pricing (Google "contango"), VXX perpetually trends lower - with occasional bursts higher when the VIX Index spikes. Essentially, it tends to trend lower for months at a time (even if the VIX Index is merely trending sideways) and then jump 100% to 300% in a short period on those occasions when the stock market sells off and the VIX Index spikes.
The bottom line: VXX is a flawed product due to its long-term downward trending nature, BUT it can be a valuable tool if you play the long side at the right time.
One other potential factor at the moment is seasonality. The chart below displays the annual seasonal trend for the S&P 500 Index. The year's weakest period is directly ahead of us and lasts through Trading Day of the Year (TDY) #197. For 2023, this period runs from 2023-09-18 through 2023-10-08.
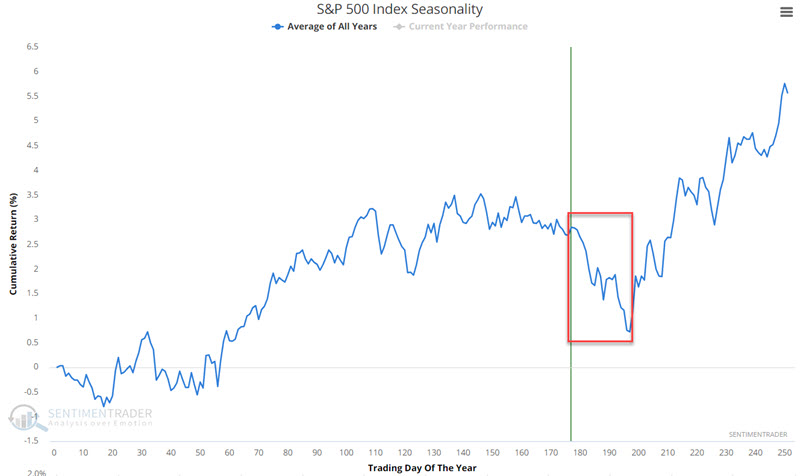
As always, it must be pointed out that seasonality is NOT a roadmap of what will happen this year. It is simply an average of what has happened in the past. With that caveat firmly in mind, the feared scenario is that:
- the stock market will sell off in the weeks ahead
- implied options volatility (i.e., the VIX Index) will soar
For the record, no prediction is being made that the next several weeks will be one of those times when VXX makes a meaningful spike. The following information is presented solely for traders who believe it will and are looking for a way to play/hedge against such a move.
A bull call spread using VXX options
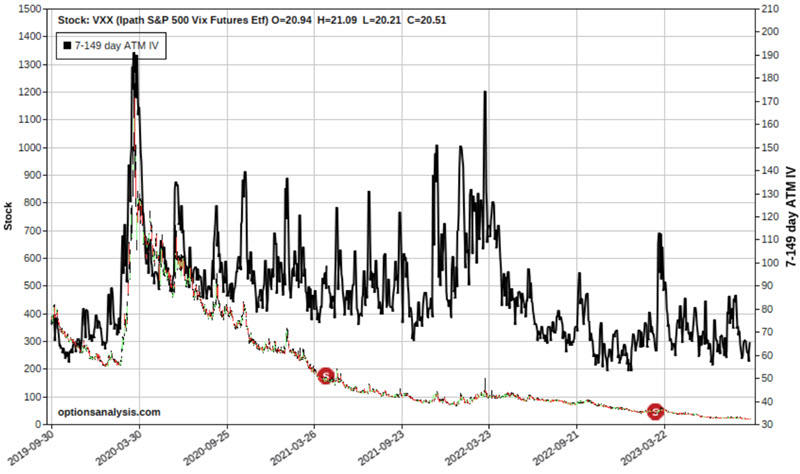
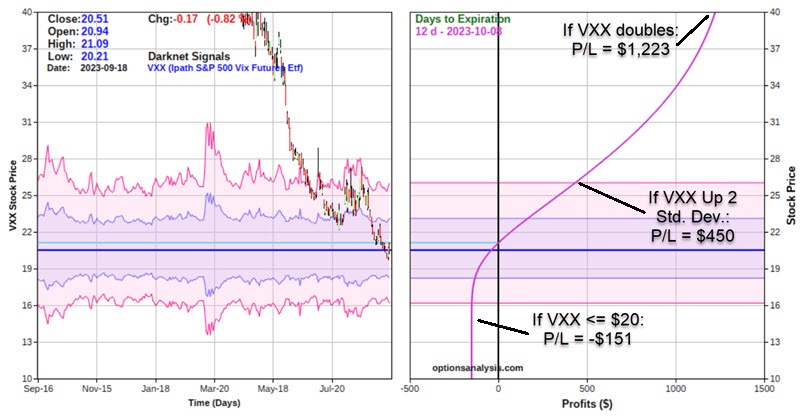
The chart below (courtesy of Optionsanalysis.com) displays a bar chart for VXX (clearly illustrating the persistent downward long-term trend. The black line indicates the implied volatility for options on ticker VXX. Note that this reading is near the low end of its historical range. This tells us that VXX options are "cheap" (i.e., there is a relatively low level of time premium built into these options). This - combined with the potential for a seasonal spike in the VIX Index - suggests the potential for a rare opportunity for option traders looking to play the long side of VXX.
The simplest way to demonstrate a potential opportunity is with an example. Our example trade involves:
- Buying 1 VXX Oct 2023 20 call @ $1.73
- Selling 1 VXX Oct 2023 35 call @ $0.22
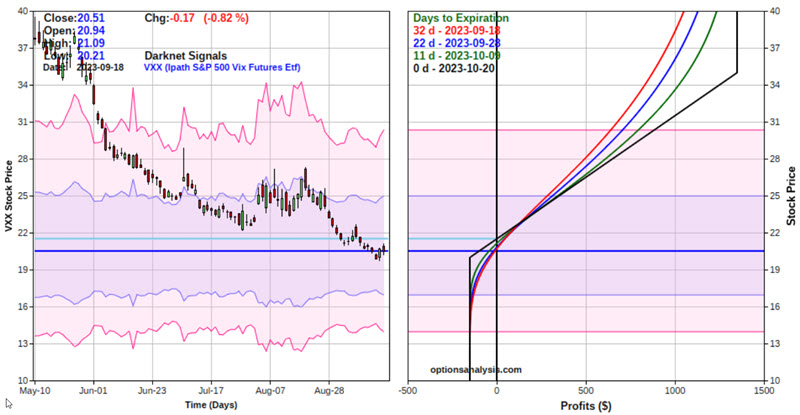
The particulars for this position and the risk curves (i.e., the expected $ P/L at a given price as of four different dates leading up to option expiration - which is the black line on the right-hand side box) are shown.
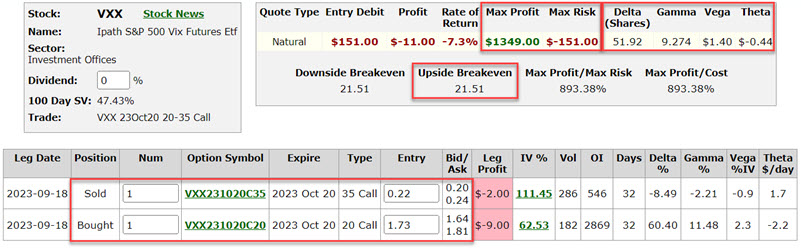
Things to note:
- The cost to enter a 1-lot - and the maximum risk - is $151
- The maximum profit is $1,349 and would be realized if VXX was at or above $35 a share as of October 20th option expiration
- The breakeven price at expiration is $21.51 a share for VXX
This trade is also an example of taking advantage of "volatility skew." Note in the particulars above that the 20-strike price call that we are buying trades at an implied volatility (IV %) of 62.53%. The 35-strike price call that we are selling trades at an implied volatility of 111.45%. This is an example of buying a "cheap" option and selling an "expensive" option.
A closer look at "Where this trade lives"
The chart below displays the expected P/L for this trade as of 2023-10-08 (i.e., TDY #197 for the S&P 500).
The bottom line: This trade (which represents an "example" and not a "recommendation") represents a low-dollar-cost way to hedge against a sharp decline in stock prices and/or a sharp rise in volatility. Under any other circumstance, this trade will likely end in a loss (remember that ticker VXX almost invariably trends lower if the VIX Index moves lower, sideways, or even slightly higher slowly).
What the research tells us…
History strongly suggests that buying call options on VXX almost invariably involves "swimming upstream." If a trader truly believes there is a good chance of a sell-off in the stock market AND a sharp spike in volatility between now and early October, then the example trade above might make sense - particularly given the relatively low dollar cost to enter the trade. But under any other scenario, the example trade above is almost certain to decline in value.