
Hedge fund dollar exposure versus energies and metals

Key points
- Hedge funds were recently heavy buyers of the U.S. Dollar
- Extremes in U.S. Dollar sentiment often have a ripple effect across the commodities markets
- Overall results tend to skew negative - with gold as a notable outlier
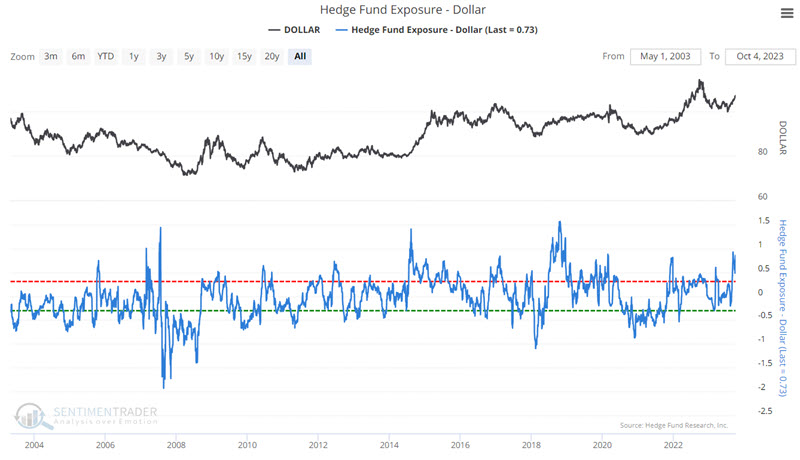
Hedge fund exposure to U.S. Dollar spiked recently
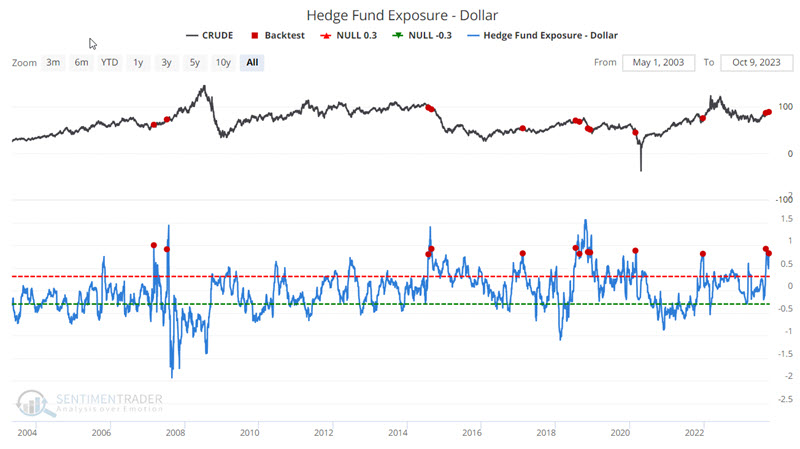
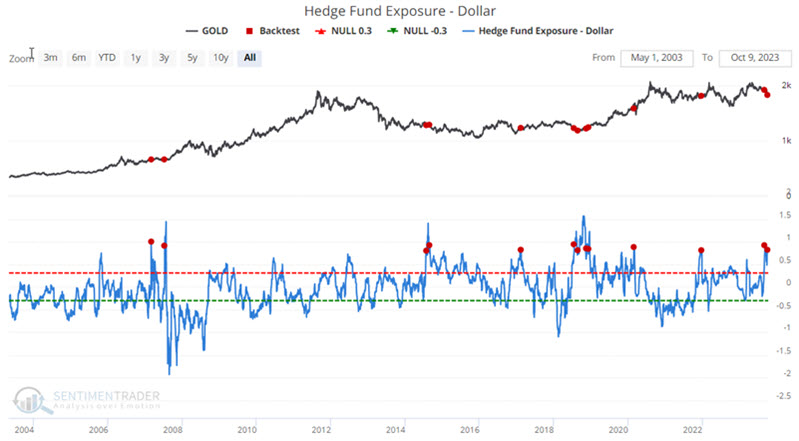
Our Hedge Fund Exposure - Dollar indicator is based on a composite of hedge fund tracking indexes. It compares this index of hedge fund exposure against returns in the U.S. dollar to see how much exposure hedge funds appear to have to the currency. If they are highly exposed, the index will rise more than the dollar and vice-versa.
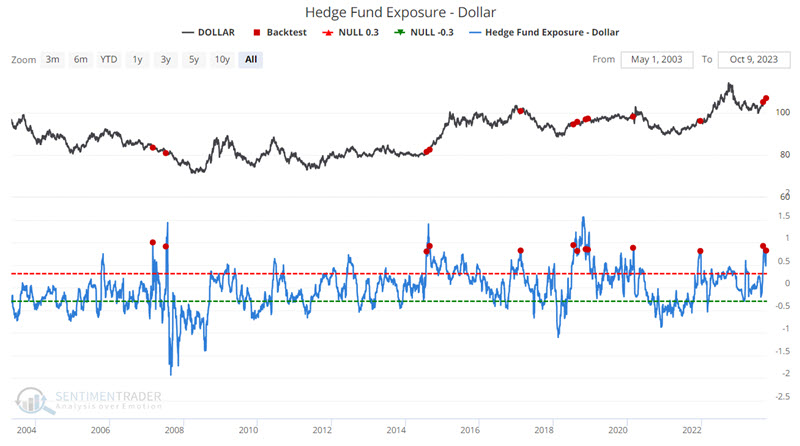
The chart below highlights those dates when the indicator crossed above 0.80 for the first time in 14 days, and the table summarizes subsequent U.S. Dollar performance. The most recent signals occurred on 2023-09-07 and 2023-10-02.
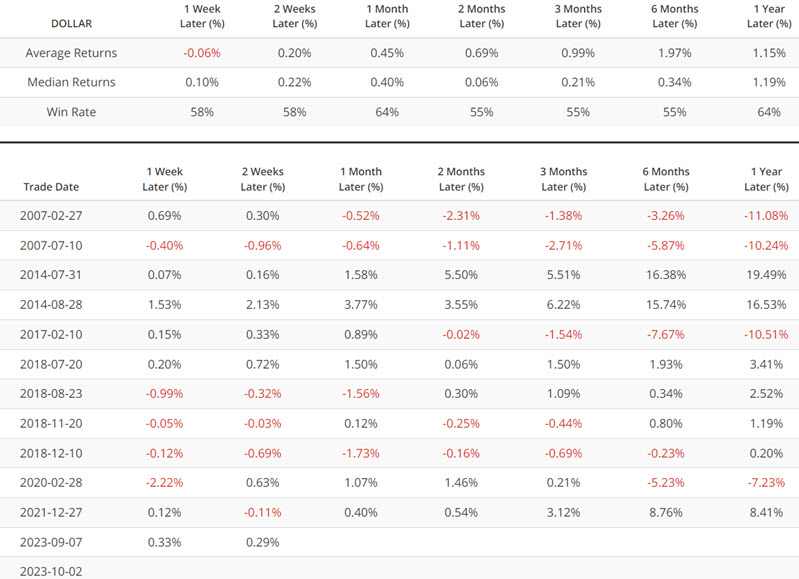
U.S. Dollar performance results are essentially a mixed bag of average results. So why are we highlighting them? Because commodities market fluctuations often depend upon movements in - and traders' perceptions about - the dollar.
A closer look at commodities as an asset class
To test a broad measure of commodities as an asset class, we will use the Bloomberg Commodity Spot Index (BCOMSP). The chart below highlights those dates when the above indicator crossed above 0.80 for the first time in 14 days, and the table summarizes subsequent BCOMSP performance.
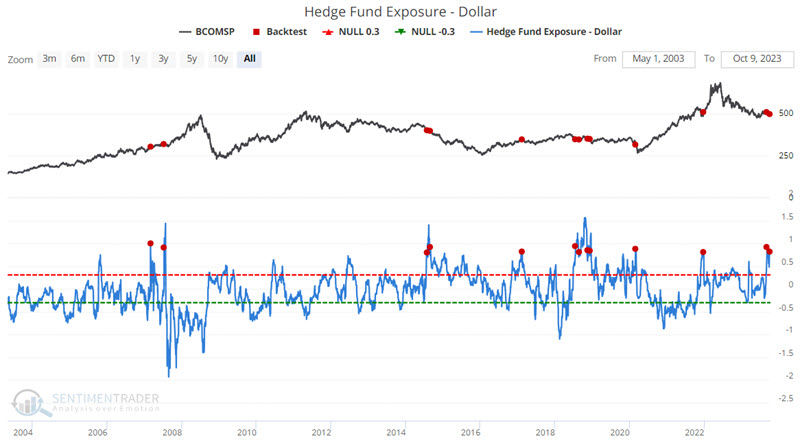
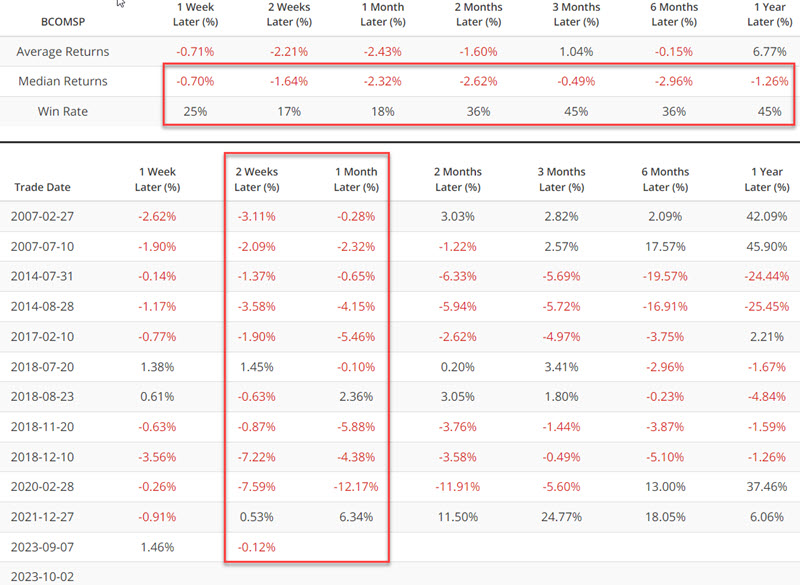
Note that the 2007 and 2020 signals were ultimately followed by sharply higher commodity prices six and twelve months later. However, Median Returns were negative for all time frames, and Win Rates were below 50%. Weakness was especially notable during two weeks and 1-month after signals.
A closer look at energies
With war breaking out in the Middle East, much focus is again on oil and gas. Wars can exacerbate situations and volatility. That said, fear typically gets inflated more than anything else as traders buy into the "inevitable disruption of oil flow" narrative. Could this time be different? Absolutely. But for now, we will let historical results stand on their own.
The chart below highlights those dates when the above indicator crossed above 0.80 for the first time in 14 days, and the table summarizes subsequent crude oil futures performance.
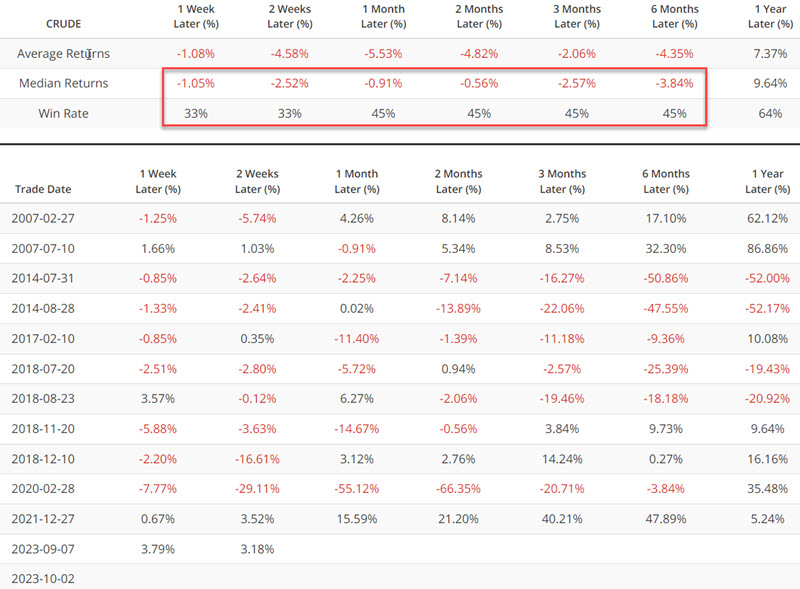
Once again, some spectacular six and twelve-month gains ensued (most notably after 2007 and 2020 signals). However, overall results skewed negatively during the six months after a signal. The same comments apply to unleaded gas below.
The chart below highlights those dates when the above indicator crossed above 0.80 for the first time in 14 days, and the table summarizes subsequent unleaded gas futures performance.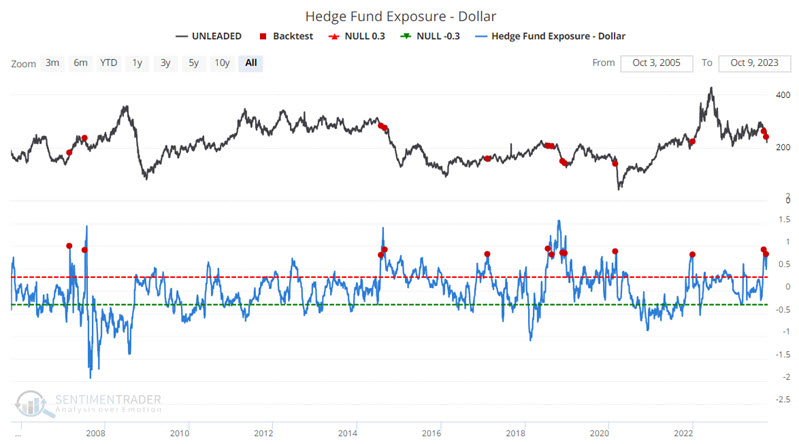

Now, let's turn our attention to the metals.
A closer look at metals
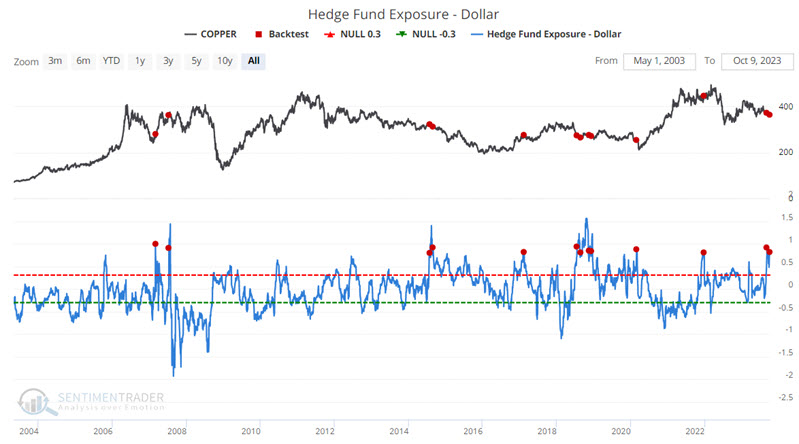
The metals markets generally follow the same patterns seen above - with the notable exception of gold. For now, let's start with copper.
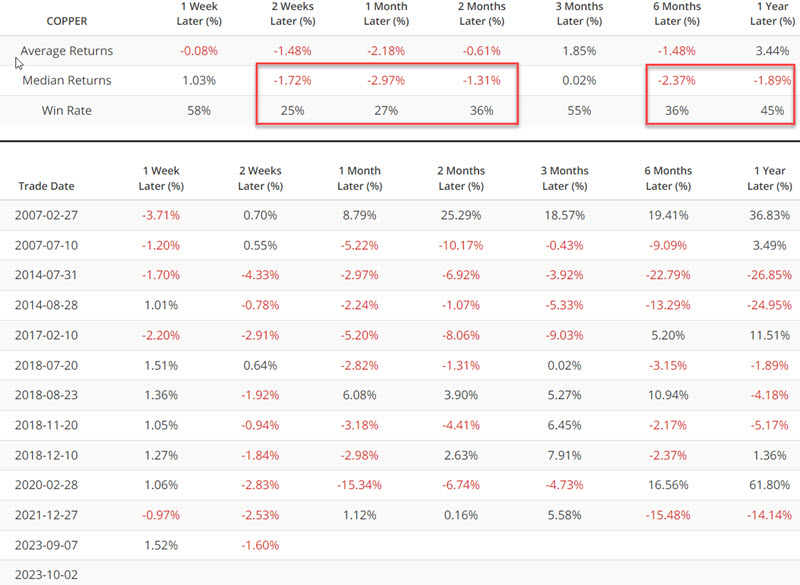
The chart below highlights those dates when the above indicator crossed above 0.80 for the first time in 14 days, and the table summarizes subsequent copper futures performance.
The chart below highlights those dates when the above indicator crossed above 0.80 for the first time in 14 days, and the table summarizes subsequent silver futures performance. 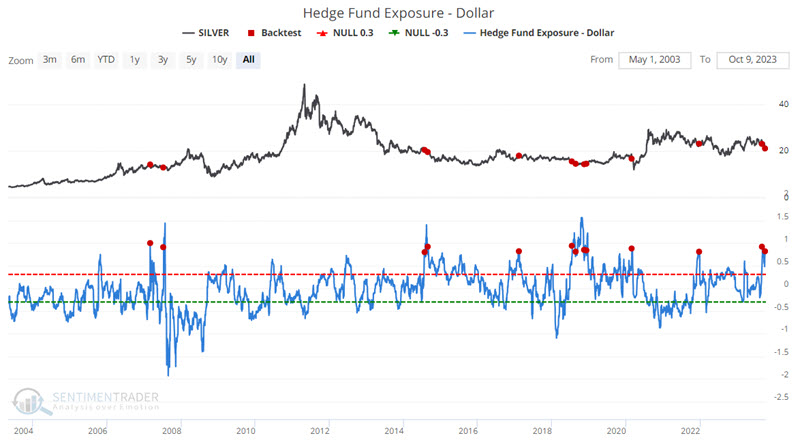
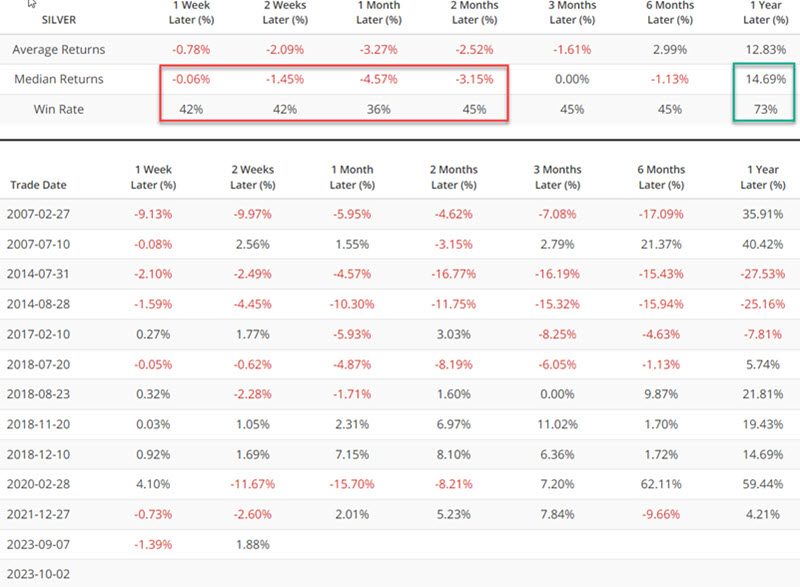
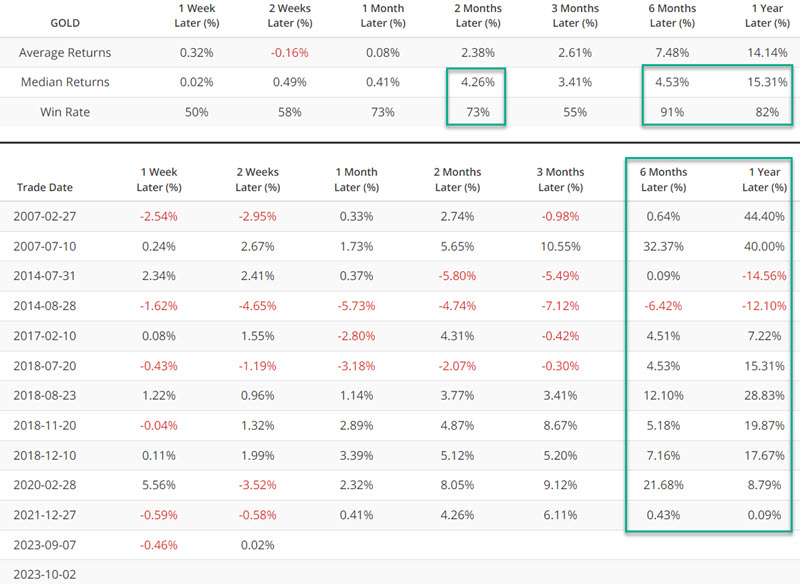
Silver shows a similar pattern of results except for some decent 12-month returns. This sets the stage for the outlier of the bunch - gold.
The chart below highlights those dates when the above indicator crossed above 0.80 for the first time in 14 days, and the table summarizes subsequent gold futures performance.
What the research tells us…
The indicator highlighted in this piece should not be used as a standalone trading model. The recent action serves as an unfavorable factor for commodities in general and energies and metals specifically - with the noted exception of gold. Geopolitical events can roil the markets, and traders must closely monitor price trends and actively manage risk. Nevertheless, with the energies also entering their most consistently unfavorable time of year - barring all-out war in the Middle East - commodities in general, and energies in particular, could surprise with a lack of upside follow-through.