
Heavy Truck Sales send a message for metals and currencies

Key Points
- The Heavy Truck Index has been a valuable tool for helping identify strength or weakness in the economy
- Overall, the current picture painted by this indicator is somewhat muddled
- However, the index just ticked above a level that has been meaningful for metals, commodities, and currencies in the past
Heavy Truck Index as a harbinger
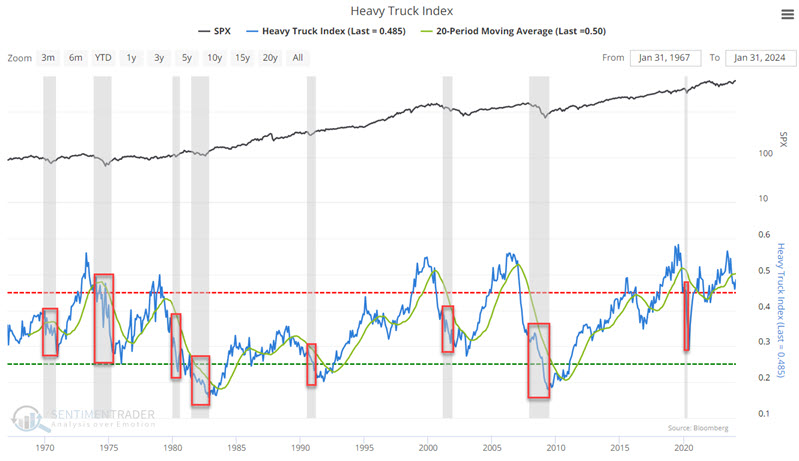
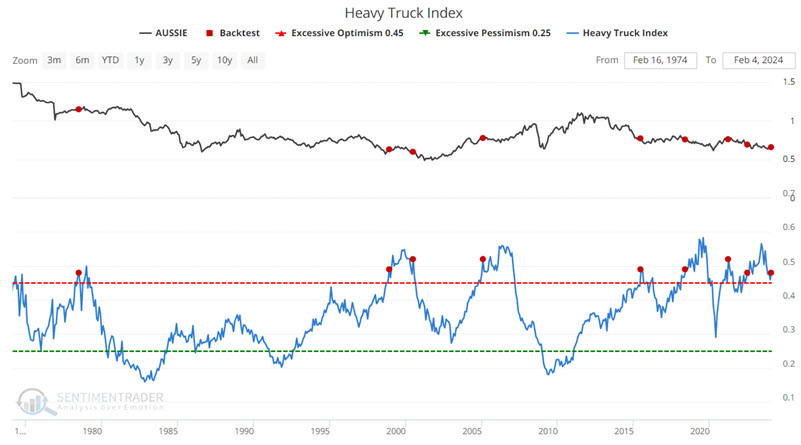
The USA Heavy Truck Index tracks the number of newly registered heavy trucks with government agencies in the United States. As it turns out, this index is a pretty good indicator of overall economic health and the stock market. Buying a truck weighing 6.35 metric tons or more requires a lot of money. It's no surprise that when "things are good," heavy truck sales rise and vice versa.
The chart below displays the index with a 20-month moving average. Note that this is not currently a favorable configuration for the stock market. While this indicator does not foretell every twist and turn in the economy and the stock market, the key thing to note is this - recessions almost invariably occur when the Heavy Truck Index is in a downtrend.
To state it as clearly as possible: Just because the Heavy Truck Index is below a longer-term moving average does not guarantee a recession. However, in the last 50 years, every economic recession has occurred while this index was in a downtrend. In other words, the recession probability is considered higher if this index is in a downtrend, BUT that probability is not necessarily 100%.
This indicator is best used not as a standalone trading model for stocks or commodities but as a weight of the evidence tool. That said, to highlight the potential usefulness of this indicator, the tests below do exactly that - i.e., measure the performance of a commodity or currency following a specific event using the Heavy Truck Index.
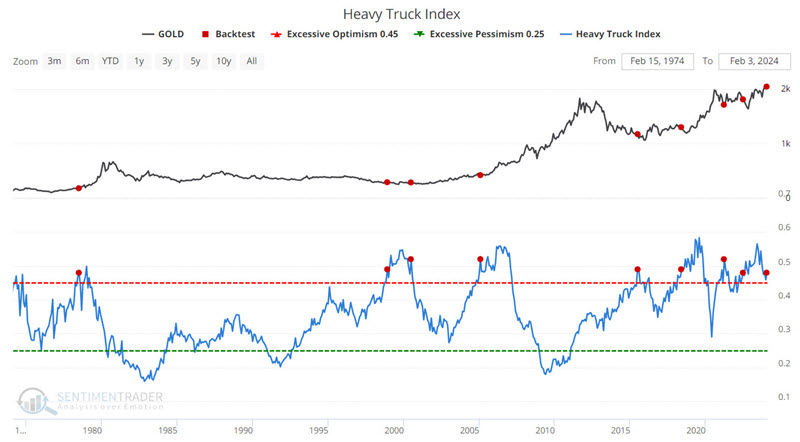
The specific event we will highlight is that the most recent Heavy Truck Index reading crossed from below to above 0.48.
Heavy Truck Index versus Gold
The chart below highlights those dates when the Heavy Trucks Index indicator crossed above 0.48 for the first time in 12 months versus gold.
The table below summarizes performance and gold returns on a signal-by-signal basis.
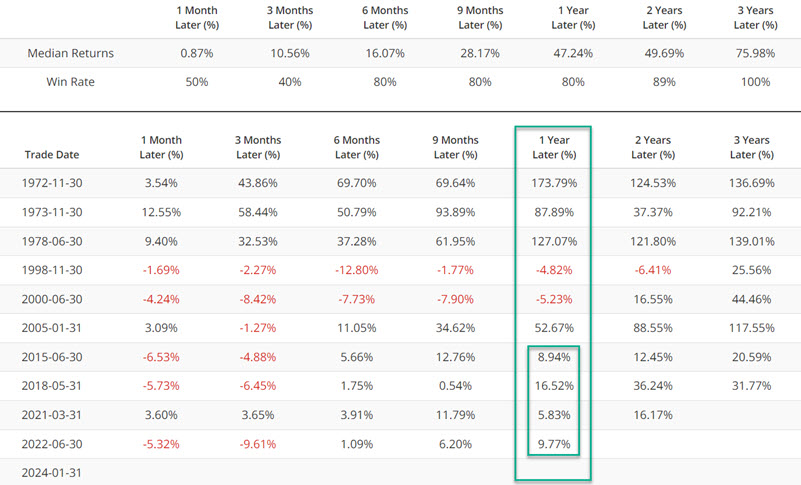
The Median Returns are pretty spectacular at face value (1-Year Median gain of +47.24%). However, a closer look reveals that these values are skewed somewhat by the absurdly high values achieved in the 1970's. If we focus on the most recent four signals, returns were much more moderate, albeit still positive. The worst 1-year loss was a seemingly manageable -5.23%, though more significant interim declines are always a risk.
Heavy Truck Index versus Silver
The chart below highlights those dates when the Heavy Trucks Index indicator crossed above 0.48 for the first time in 12 months versus silver.
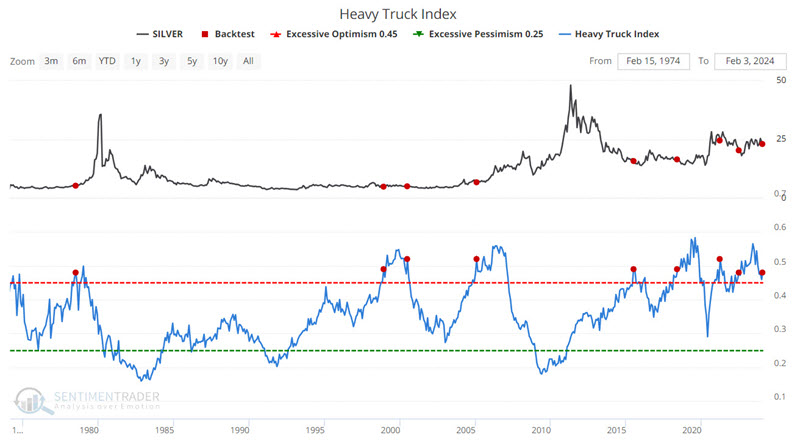
The table below summarizes performance and silver returns on a signal-by-signal basis.
The Median Returns for silver are also quite impressive overall (note the 12-month median return of +60.69%). Once again, however, a perusal of the signal-by-signal results reveals significantly less robust returns after the explosive moves in the 1970's. While the historical 1-year Win Rate is a solid 80%, the two losses exceeded -16.9%. Remember, this is "weight of the evidence" and not necessarily an outright "buy" signal for silver.
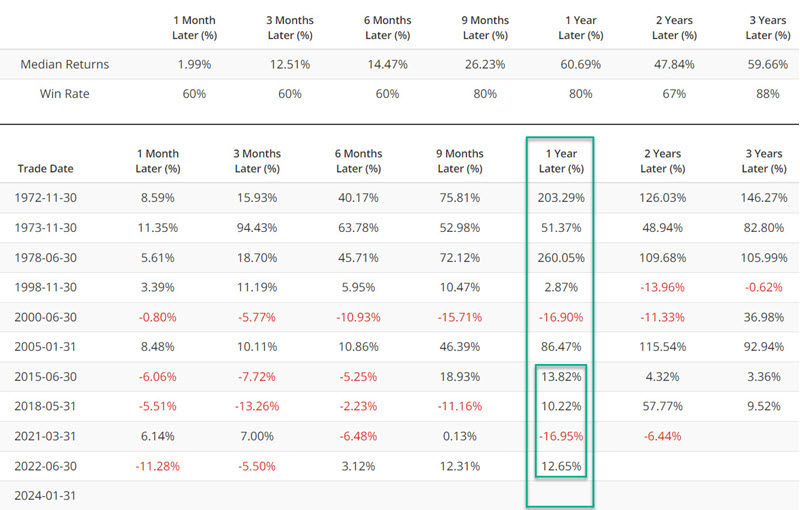
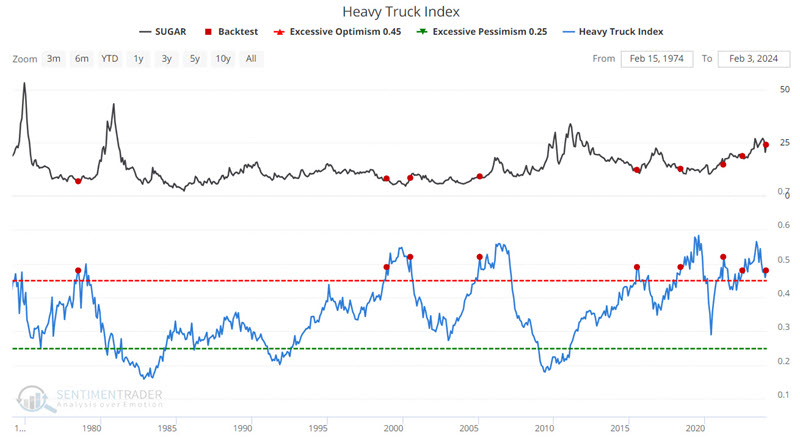
Heavy Truck Index versus Sugar
The chart below highlights those dates when the Heavy Trucks Index indicator crossed above 0.48 for the first time in 12 months versus sugar.
The table below summarizes performance and sugar returns on a signal-by-signal basis.
The Median Returns for sugar are compelling. Of the ten previous signals:
- The 1-year Median return was a robust +68.23%
- Five signals showed a 1-year gain over +67%
- Six signals showed a 1-year gain over +43%
- Seven signals showed a 1-year gain over +21%
The worst 1-year loss was -9.65%
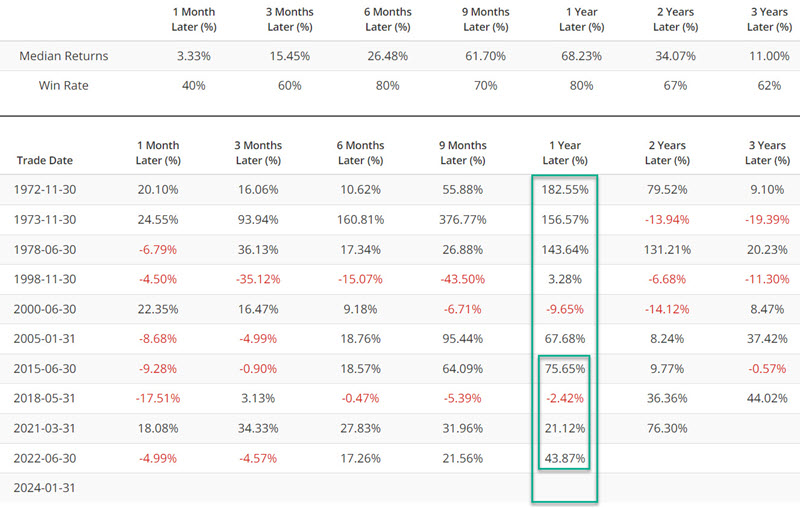
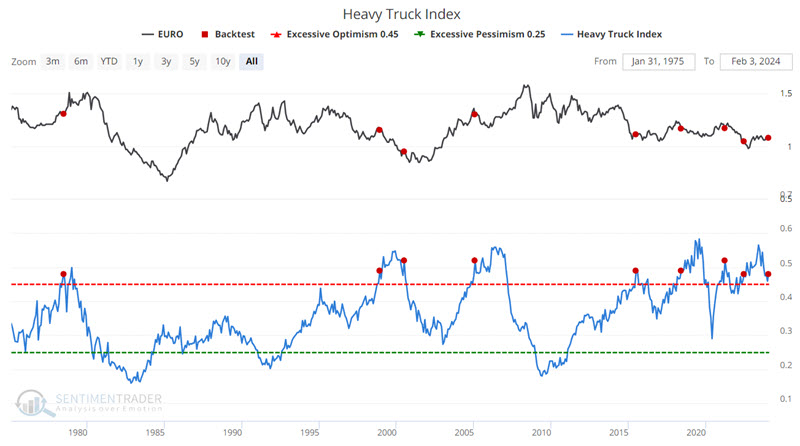
Heavy Truck Index versus the Euro
The same signal from the Heavy Truck Index tends to have the opposite effect on several currencies than on the commodity markets above. The chart below highlights those dates when the Heavy Trucks Index indicator crossed above 0.48 for the first time in 12 months versus the euro.
NOTE: Euro futures started trading in the 1990s. The Bloomberg data file we follow calculated hypothetical euro prices back into the 1970s.
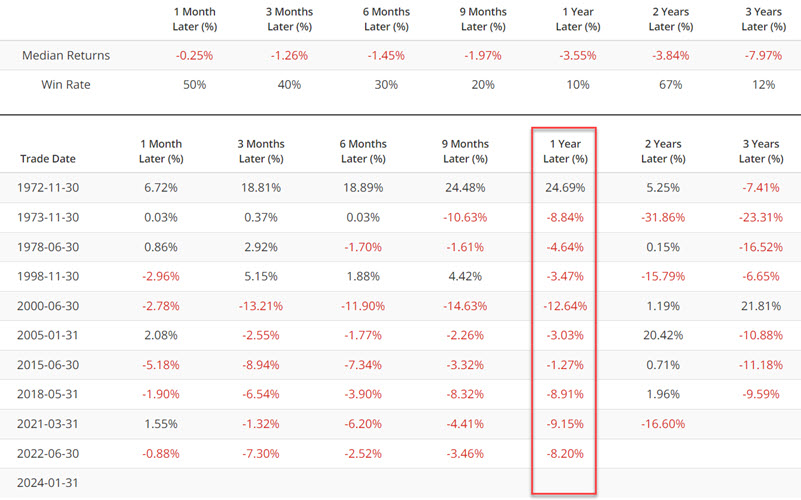
The table below summarizes performance and euro returns on a signal-by-signal basis.
In the table above, the first signal in 1978 saw the euro rise sharply in the year ahead. The most recent previous signal in 2022 saw the euro rise a modest +0.87% over the next year. Every other signal saw the euro decline. Four of the six signals witnessed a 12-month euro decline of -4.6% or more.
Heavy Truck Index versus the Aussie Dollar
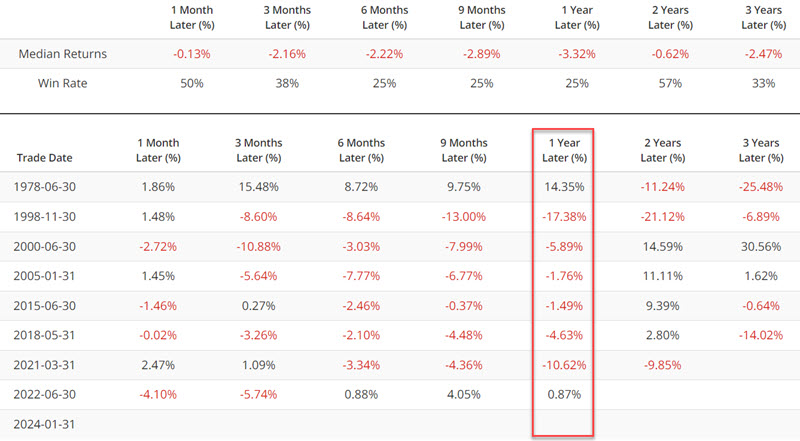
The chart below highlights those dates when the Heavy Trucks Index indicator crossed above 0.48 for the first time in 12 months versus the Australian Dollar.
NOTE: Aussie dollar futures started trading in the 1990s. The Bloomberg data file we follow calculated hypothetical prices back into the 1970s.
The table below summarizes performance, and Aussie Dollar returns on a signal-by-signal basis.
In the table above, the first signal in 1972 saw the Aussie post a spectacular gain in the following year. Every signal since then has been followed by a lower Aussie Dollar 1-year later.
ETFs as an alternative
Not everyone is equipped - financially and/or emotionally - to trade futures contracts. Fortunately, there are alternatives for "the rest of us." ETFs offer traders the opportunity to take a position in a variety of commodities and currencies. The table below lists ETF alternatives for the markets listed above. Traders can buy and sell short these ETFs in a stock brokerage account just as they would shares of any stock.
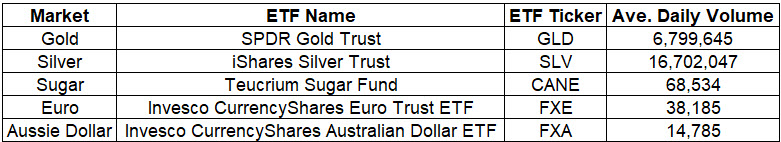
Traders should be aware that CANE, FXE, and FXA are all relatively thinly traded, so limit orders should be considered when executing trades. Likewise, selling short FXE or FXA entails potentially unlimited risk, and a stop-loss order is essential to mitigate the potential for catastrophic loss.
What the research tells us…
So, should all of the above mean traders load up on metals and sugar and sell short foreign currencies? Not necessarily. Remember, the Heavy Truck Index is an indicator, not a trading system. The current action of this index lends some pretty considerable weight to the bullish side of the ledger for precious metals and sugar and the bearish side of the ledger for the euro and Aussie. The next step for traders is to apply their own price action tools to decide if and when to enter a position.