
Health care can't get off the mat

Key points
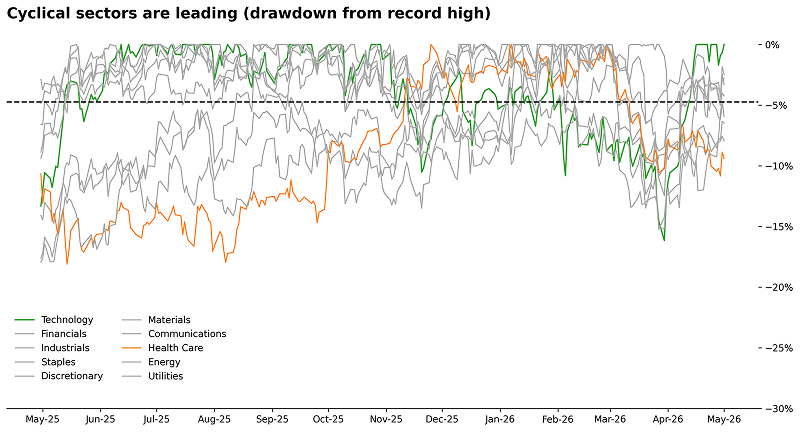
- The S&P 500 is at record highs, but Health Care sits in the deepest decline from its peak of any sector
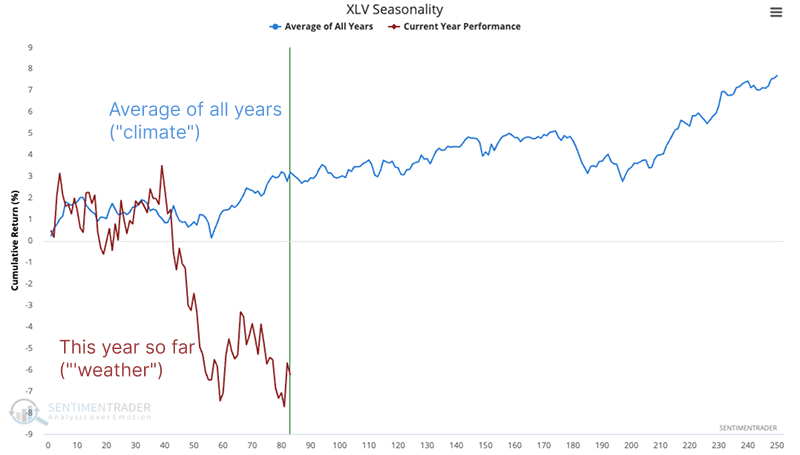
- The sector is entering its worst seasonal window, and this year the pattern is running even worse than average
- Internal participation is weak, investors are showing complacency in options, and insiders aren't buying
We've seen this movie before
Health Care has lagged the broader S&P 500 by one of the widest margins in years, with headwinds continuing to mount. Cyclical sectors are leading the charge to new all-time highs, while Health Care sits near the bottom of the S&P 500 sector leaderboard in terms of drawdown from its record peak. While the sector has not seen sustained extreme outflows, year-to-date fund flow trends remain weak, with intermittent selling pressure weighing on price action.
Late summer tends to be rough
According to Jay's framework, from around late April to mid-June have historically been a difficult period for the healthcare sector. It's slightly better than around September, but only marginally so.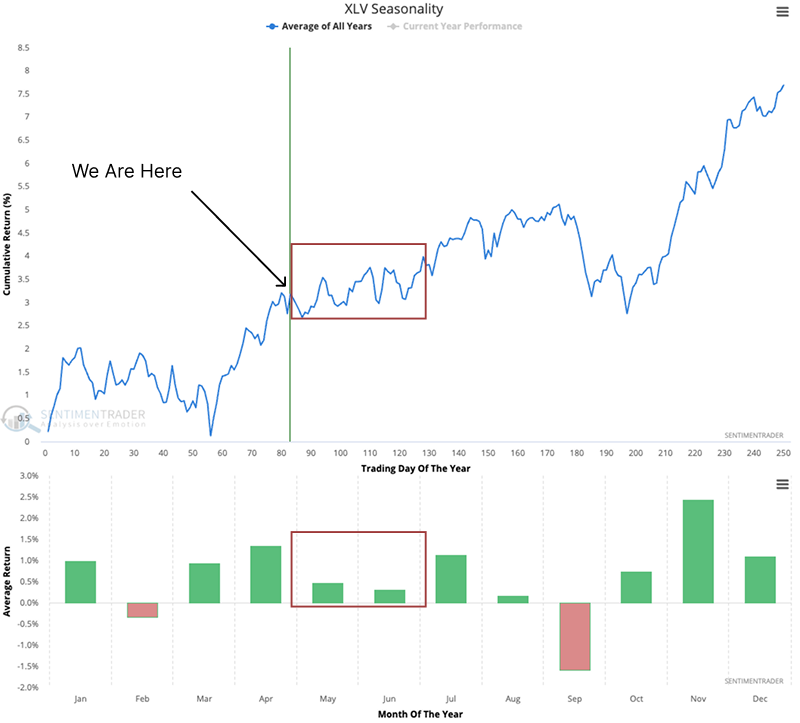
We always suggest taking seasonality with a grain of salt because averages can greatly mask performance during any given year. As Jay often says, it's about climate, not weather.
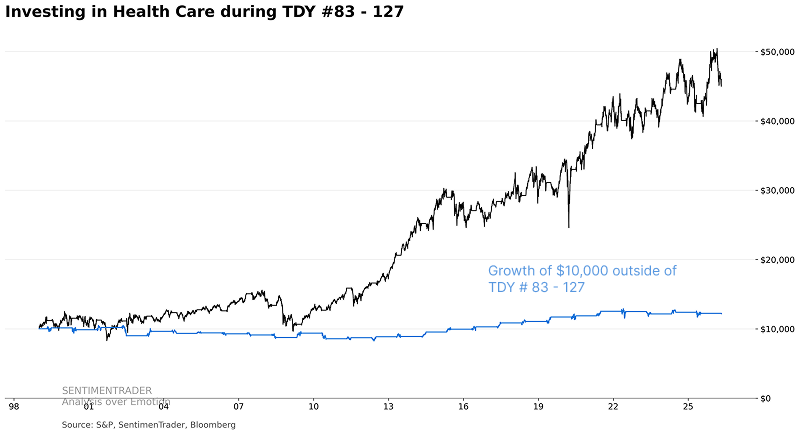
The chart below shows the growth of $10,000 invested in XLV only during that window versus only outside it. On a standard scale, the in-window line barely registers.
Some technical concerns
Despite some recovery attempts in XLV, the percentage of stocks trading above their 200-day average has not broken out. There's a divergence between the index and its participation. While the price has nudged higher, fewer members are holding above their long-term average.
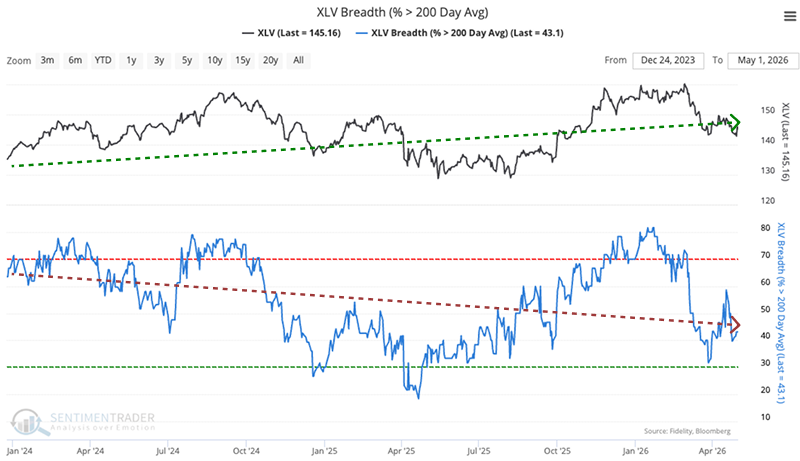
Divergence is a tricky thing and often fires false signals. Still, some of the more notable declines in the sector were preceded by a drop in participation.
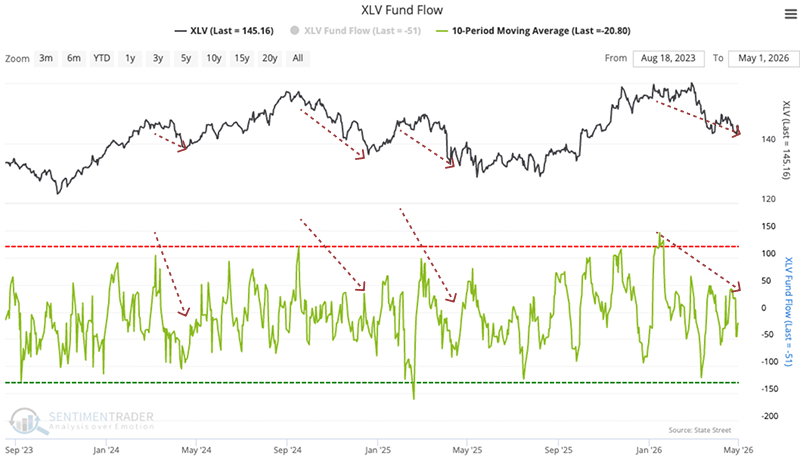
Investors have given up. XLV has been bleeding fund flows, over the past 10 trading days, XLV has seen an average daily net outflow increase. That could be seen as a contrarian bullish sign, if investors are willing to come back. The outflow magnitude is large enough to compare with other oversold conditions and bottoms in XLV.
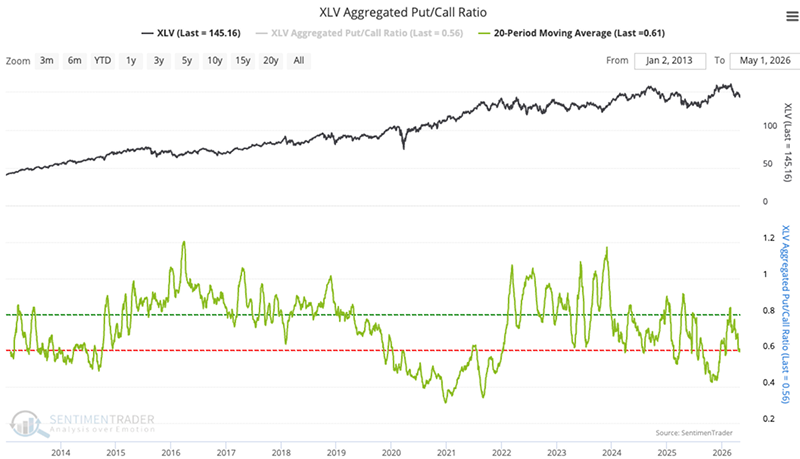
A low put/call ratio can lead to below-average returns, though the options mania of 2020-21 scrambled many options-related signals.
Correlation and insiders don't help
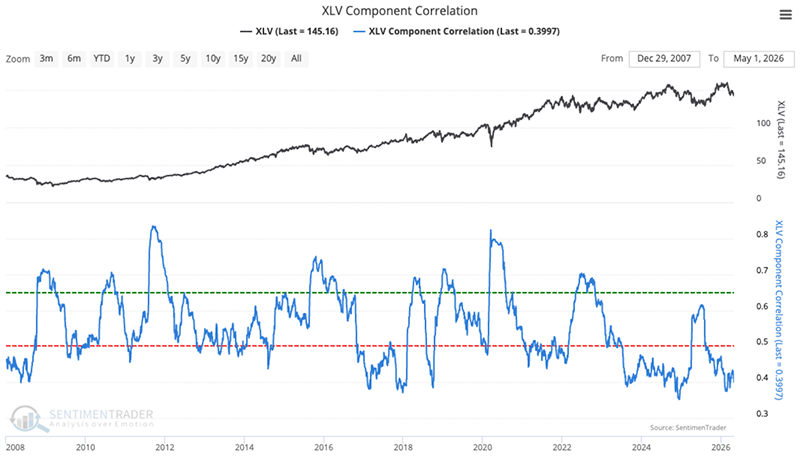
Component correlation within XLV has dropped significantly, which can be read as a sign of investor confidence in stock picking. When investors panic, correlation tends to increase as they buy and sell everything at once. When correlation falls, investors are more willing to consider each stock on its own merits. But the most recent correlation low dates to October 2018, when the sector was peaking.
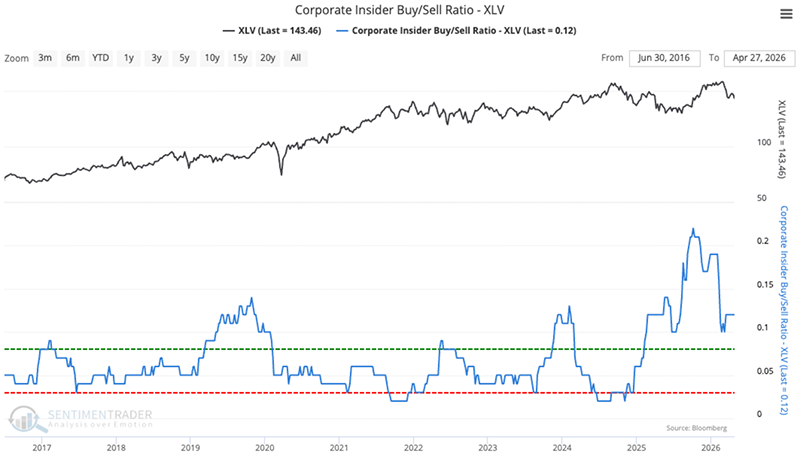
Corporate insiders aren't exactly rushing to buy. The buy/sell ratio for XLV is sitting near the low end of its historical range, close to the red threshold at 0.06. A surge in buying interest has tended to be a consistently useful bullish signal. Peaks in selling pressure are less consistent as bearish signals, but can still be relevant. The current level isn't extreme, but for bullish investors, it would be more reassuring if the smart money showed more interest in their own shares.
What the research tells us...
Health Care's underperformance this year has reached historic levels. In other years when it lagged this badly into early May, returns tended to stay mediocre at best. Multiple indicators point to heavy selling pressure or recent extremes in pessimism, yet there's also weak internal participation, investor complacency in options, and a lack of eager accumulation by insiders. Add it all up, and the outlook for these stocks is meh at best.