Products
SentimenTrader Trading Tools
‍
Backtest Engine
My Trading Toolkit
Correlation Analysis
Seasonality
Market Prediction
Indicators & Data API
‍
Proprietary Indicators & Charts
Market Data API
Strategies & Scanner
‍
50+ Trading Strategies
Smart Stock Scanner
Smart Option Scanner
Research Reports
‍
Research Solutions
Reports Library
Free Resources
Simple Backtest Calculator
Simple Seasonality Calculator
The Kelly Criterion Calculator
Sentiment Geo Map
Public Research Reports
Education
Sentiment Indicators
Technical Indicators
Pricing
Company
About
In the News
Testimonials
Client Success Stories
Contact
Log inLoginSign up
< BACK TO ALL REPORTS

Have a nice week next week - or quite possibly, not

Jay Kaeppel
2024-09-20
Over the past 104 years, a particular week in September has been (by far) the worst-performing week of the year. What does this mean for 2024? We examine the history and the potential implications herein.

Key Points

  • For reasons that cannot be fully explained, the week following the third Friday in September has historically been the worst-performing week of the year over the past 104 years
  • This does not guarantee that the stock market will be down during this time (next week) in 2024
  • Still, with investors' eyes currently filled with stars in light of the strong performance of late, a little historical perspective may be useful

A week to gird your loins

I have written about the "dangers" of September, and many investors know it has historically been the worst month of the year for the stock market overall. But the reality is that things can vary a lot from year to year except for next week. That week - defined as the week after the 3rd Friday in September - has been pretty awful consistently for a long time. As you may gather, no, it has not been pretty.

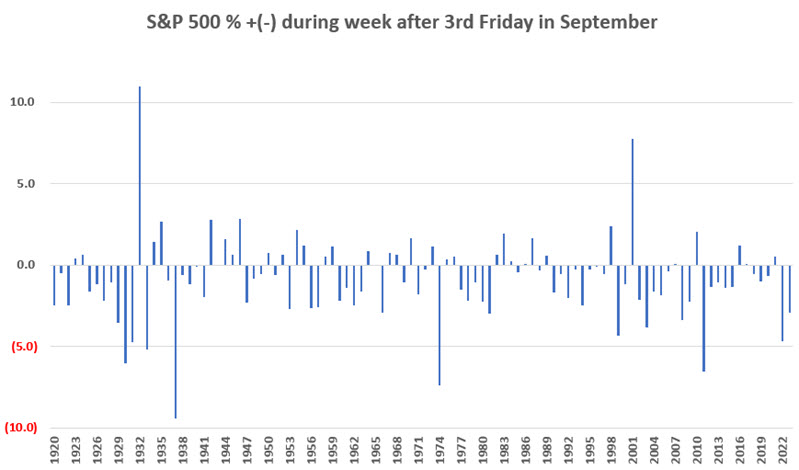
The week after the third Friday in September has seen the S&P 500 decline in 27 of the last 34 years. This week has been up 35 times and down 69 times since 1920. The chart below displays the percentage performance for this week every year since 1920.

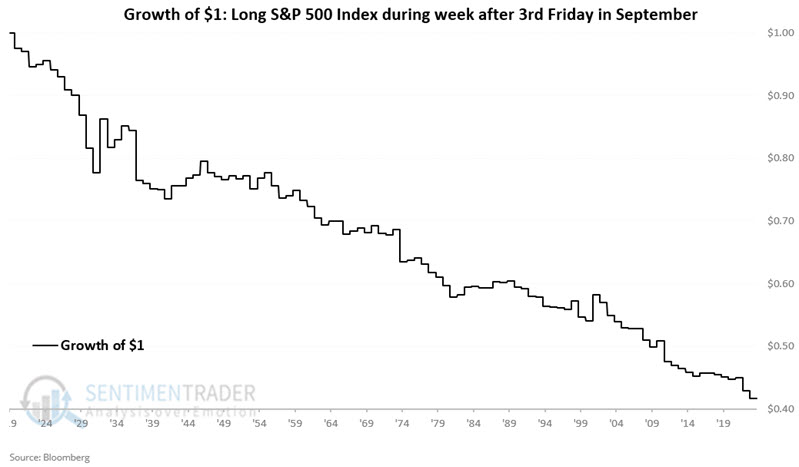
The chart below displays the hypothetical growth of $1 invested in the S&P 500 Index only the week after the 3rd Friday in September since 1920.

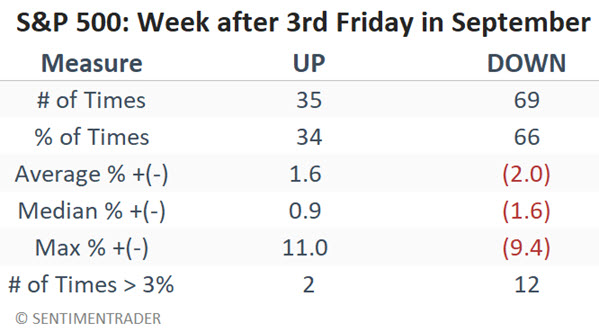
The table below summarizes the S&P 500 performance for this week.

What the research tells us…

A 34% Win Rate over 104 years tells us that the market declines roughly twice every three years during the week in question. What will it be in 2024? We cannot predict. What the data does suggest is that short-term traders watch closely for any sign of a downside reversal as a potential opportunity to play the short side (as a very short-term trade) and that longer-term investors with cash to invest exercise a little patience in anticipation of a slightly better buying opportunity soon.

PRODUCTS
SentimenTrader
Trading Tools
Indicators & Data API
‍
Strategies & Scanner
‍
Research Reports
FREE
RESOUrCES
Simple Backtest
Calculator
Simple Seasonality
Calculator
The Kelly Criterion
Calculator
Sentiment Geo Map
‍
Public Research Reports
‍
Education
Sentiment Indicators
‍
Technical Indicators
‍
Pricing
Bundle pricing
‍
FAQ
‍
Announcements
‍
COMPANY
‍
About
‍
In the News
‍
Testimonials
‍
Client Success Stories
CONTACT
‍
General Inquiries
‍
Media Inquiries
‍
Financial Professionals Inquiries
‍
© 2026 Sundial Capital Research Inc. All rights reserved.
Setsail Marketing
TermsPrivacyAffiliate Program
Risk Disclosure: The information and tools provided are for research and analytical purposes only and are not intended as investment advice. Market analysis involves uncertainty, and outcomes may differ from expectations. Users should conduct their own due diligence and consider their individual circumstances before making any financial decisions. Past performance is not necessarily indicative of future results.

Hypothetical Performance Disclosure: Hypothetical performance results have many inherent limitations, some of which are described below. No representation is being made that any account will or is likely to achieve profits or losses similar to those shown; in fact, there are frequently sharp differences between hypothetical performance results and the actual results subsequently achieved by any particular trading program. One of the limitations of hypothetical performance results is that they are generally prepared with the benefit of hindsight. In addition, hypothetical trading does not involve financial risk, and no hypothetical trading record can completely account for the impact of financial risk of actual trading. for example, the ability to withstand losses or to adhere to a particular trading program in spite of trading losses are material points which can also adversely affect actual trading results. There are numerous other factors related to the markets in general or to the implementation of any specific trading program which cannot be fully accounted for in the preparation of hypothetical performance results and all which can adversely affect trading results.

Testimonial Disclosure: Testimonials appearing on this website may not be representative of other clients or customers and is not a guarantee of future performance or success.