Products
SentimenTrader Trading Tools
‍
Backtest Engine
My Trading Toolkit
Correlation Analysis
Seasonality
Market Prediction
Indicators & Data API
‍
Proprietary Indicators & Charts
Market Data API
Strategies & Scanner
‍
50+ Trading Strategies
Smart Stock Scanner
Smart Option Scanner
Research Reports
‍
Research Solutions
Reports Library
Free Resources
Simple Backtest Calculator
Simple Seasonality Calculator
The Kelly Criterion Calculator
Sentiment Geo Map
Public Research Reports
Education
Sentiment Indicators
Technical Indicators
Pricing
Company
About
In the News
Testimonials
Client Success Stories
Contact
Log inLoginSign up
< BACK TO ALL REPORTS

Have a "bad" day tomorrow (here's hoping anyway)

Jay Kaeppel
2024-09-30
It's not often that one might "root for" a bad day for the stock market. But if ever there was a time to do so, it might be on the first day of October. We explain why herein.

Key points

  • 10% of all trading days have seen the S&P 500 decline by -1% or more
  • Interestingly, the first trading day of October has seen such a decline 16% of the time
  • Even more interestingly, historically, this has not been a bad thing for stocks

When the first trading day of October is bad…

We will define a "bad" day as a day when the S&P 500 Index declines by -1% or more. In 69 years since 1955, the first trading day of October has had a "bad" day eleven times, or 16% of the time. Will October 1st, 2024, be a "bad" day? History suggests only a 16% probability of that happening. But would it be a bad thing if it did? Here is where it gets interesting.

We start our test on 1954-12-31, using the following assumption:

  • If the S&P 500 loses -1% or more on the first trading day of October, we will buy the index at the close of that day and sell at the close of the last trading day of the year

In other words, if the fourth quarter gets off to a dreadful start, we will bet on a bullish market for the remainder of the quarter. How has this worked out? Let's take a closer look.

…the rest of the fourth quarter tends to flourish

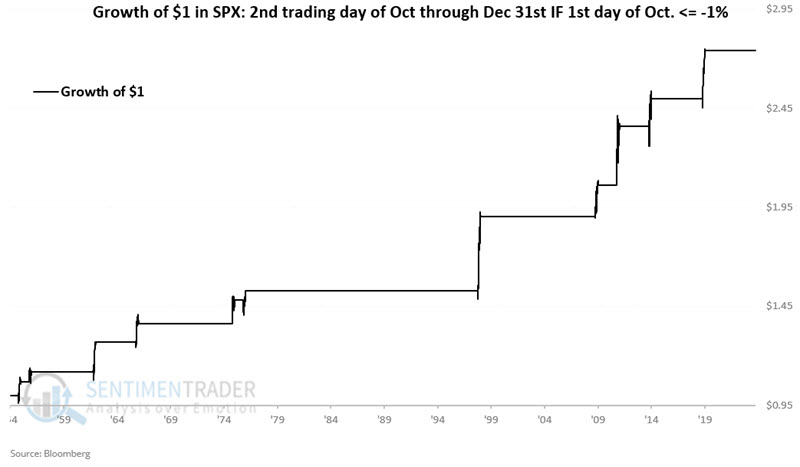
The chart below displays the hypothetical growth of $1 invested in the S&P 500 from the close of the first trading day of October through the end of December if the first trading day of October was down -1% or more.

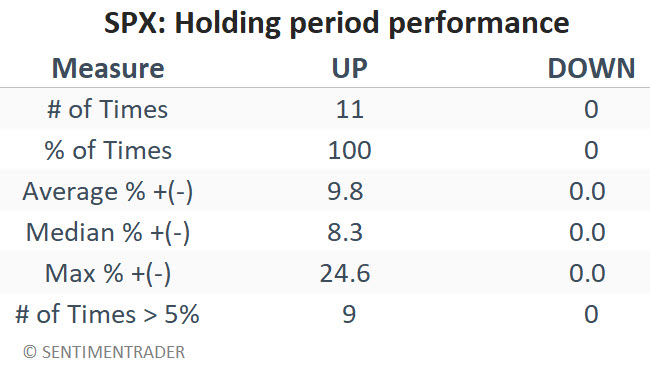
The table below displays the price performance for the S&P 500 during the fourth quarter holding period described above, following a loss of -1% or more on the first trading day of October.

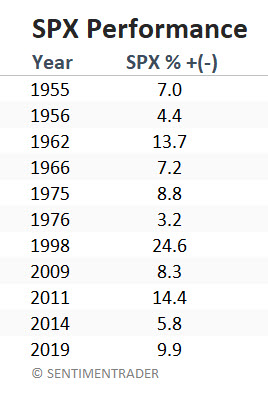
The table below summarizes S&P 500 performance during the periods highlighted in the chart above.

A closer look at sectors and factors

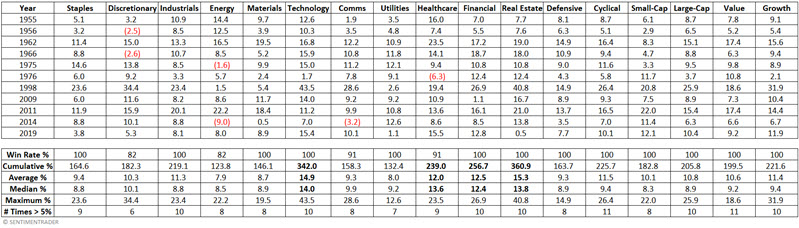
The table below displays period returns for the S&P 500 sectors and factors and summarizes sector and factor performance during the periods highlighted above. Real estate, technology, financials, and healthcare are the top four performers.

What the research tells us…

The probability of a "bad" day (S&P down -1% or more) tomorrow is low (10% historically looking at all trading days, though 16% for the first day of October. Likewise, there is no guarantee that even if the S&P declines by -1% or more tomorrow, the stock market will respond as favorably during the rest of the fourth quarter as it has under similar circumstances. Still, if one were ever going to "root" for the stock market to have a "bad" day... 

PRODUCTS
SentimenTrader
Trading Tools
Indicators & Data API
‍
Strategies & Scanner
‍
Research Reports
FREE
RESOUrCES
Simple Backtest
Calculator
Simple Seasonality
Calculator
The Kelly Criterion
Calculator
Sentiment Geo Map
‍
Public Research Reports
‍
Education
Sentiment Indicators
‍
Technical Indicators
‍
Pricing
Bundle pricing
‍
FAQ
‍
Announcements
‍
COMPANY
‍
About
‍
In the News
‍
Testimonials
‍
Client Success Stories
CONTACT
‍
General Inquiries
‍
Media Inquiries
‍
Financial Professionals Inquiries
‍
© 2026 Sundial Capital Research Inc. All rights reserved.
Setsail Marketing
TermsPrivacyAffiliate Program
Risk Disclosure: The information and tools provided are for research and analytical purposes only and are not intended as investment advice. Market analysis involves uncertainty, and outcomes may differ from expectations. Users should conduct their own due diligence and consider their individual circumstances before making any financial decisions. Past performance is not necessarily indicative of future results.

Hypothetical Performance Disclosure: Hypothetical performance results have many inherent limitations, some of which are described below. No representation is being made that any account will or is likely to achieve profits or losses similar to those shown; in fact, there are frequently sharp differences between hypothetical performance results and the actual results subsequently achieved by any particular trading program. One of the limitations of hypothetical performance results is that they are generally prepared with the benefit of hindsight. In addition, hypothetical trading does not involve financial risk, and no hypothetical trading record can completely account for the impact of financial risk of actual trading. for example, the ability to withstand losses or to adhere to a particular trading program in spite of trading losses are material points which can also adversely affect actual trading results. There are numerous other factors related to the markets in general or to the implementation of any specific trading program which cannot be fully accounted for in the preparation of hypothetical performance results and all which can adversely affect trading results.

Testimonial Disclosure: Testimonials appearing on this website may not be representative of other clients or customers and is not a guarantee of future performance or success.