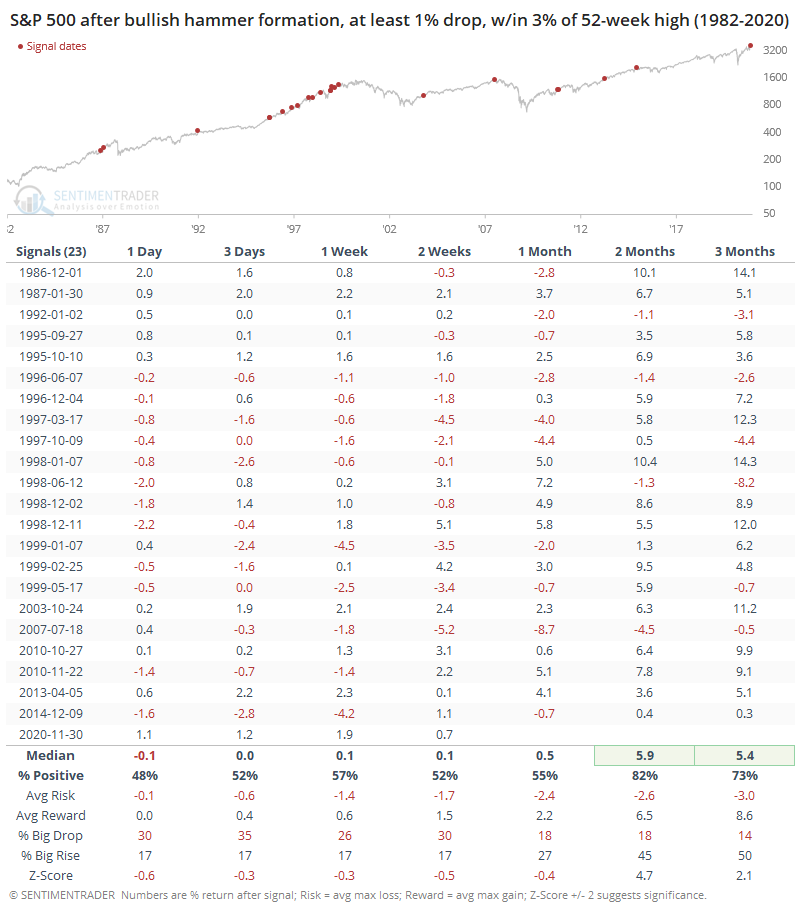
Hammer time

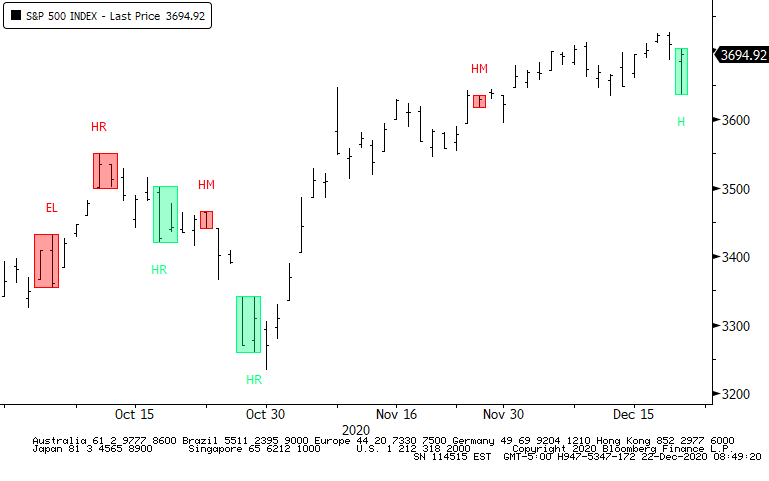
The Bloomberg algorithm suggests that the S&P 500 index carved out a hammer formation on Monday. Due to opening gaps and some weird intraday prints, most of the broad index ETFs did not.
Per Investopedia:
"A hammer is a price pattern in candlestick charting that occurs when a security trades significantly lower than its opening, but rallies within the period to close near opening price. This pattern forms a hammer-shaped candlestick, in which the lower shadow is at least twice the size of the real body. A hammer occurs after a security has been declining, suggesting the market is attempting to determine a bottom. Hammers signal a potential capitulation by sellers to form a bottom, accompanied by a price rise to indicate a potential reversal in price direction."
Intraday prints of a cash index like the S&P aren't all that reliable, especially as we go further back in history. Still, it's unusual to see one so near a high.
Over the past ~30 years, it has triggered a couple dozen times, when losing at least 1% intraday and closing within 3% of a 52-week high. It wasn't that great at preceding very short-term continuation, but the next 2-3 months were good. We don't put a lot of weight on one-day patterns to forecast longer-term returns, so the biggest takeaway is probably just that these supposed-to-be bullish patterns were only modestly successful at best in their expected time frame.