
Good news and bad news for bonds

Key points
- Treasury bonds have bounced nicely off of their October lows and arguably could still have a long way to run
- However, for now, the long-term trend in interest rates is still bearish for bonds...
- ...and several indicators are still flashing yellow for bonds - particularly long-term treasuries
Bonds have bounced and could still run much higher…
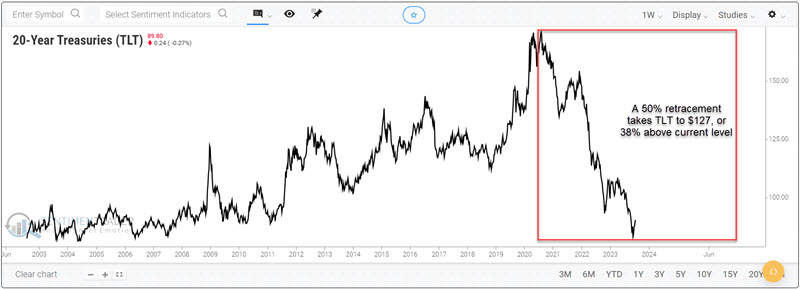
Long-term treasury bonds lost 50% of their value during the decline from early 2020 into October 2023. In the minds of many investors (particularly those who entered the markets after rates topped in 1981 and proceeded to decline and fuel a bond bull market for 39 years), this has set up a terrific buying opportunity. And in one sense, they may be exactly right. Bonds will enjoy a terrific rally if the market retraces even 40% to 60% of the previous decline.
The chart below displays the price action for the iShares 20+ Year Treasury ETF (ticker TLT), an ETF that tracks long-term treasury bonds. In the red box, you can see the massive decline over the past several years. If TLT were to retrace 50% of that decline, it would entail a rally to roughly $127 a share. Even after the recent 16% bounce off of the October 2023 low, this would represent another 38% of upside price potential. So, it is not unreasonable for a trader or investor to look for an opportunity to enter a long position in bonds.
But before getting too carried away regarding upside potential, it should be noted that there are other countervailing factors.
...but the long-term trend in rates is still bearish for bonds
Interest rates have a long history (literally several hundred years) of moving in very long-term waves (often 30 years up followed by 30 years down). When the major trend changes, historically that major trend has endured for decades to one degree of another.
The chart below displays the ticker TYX, which tracks the yield on 30-year treasury bonds (x 10) since the mid-1970s. When the current reading is below the 120-month exponential moving average, interest rates are said to be in a downtrend. Conversely, when the current reading is above the 120-month exponential moving average, interest rates are said to be in an uptrend.
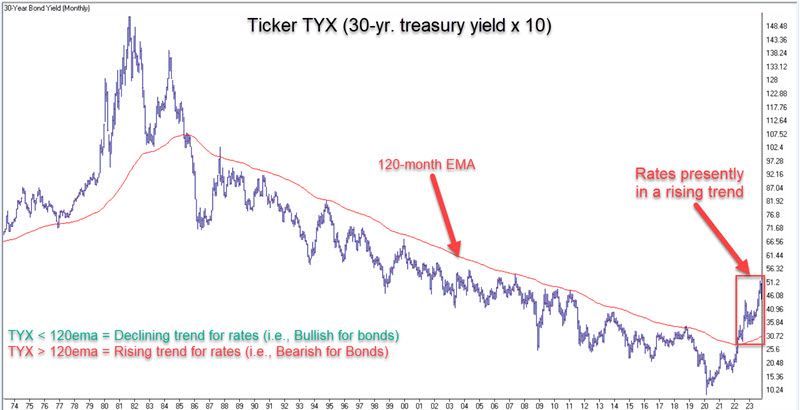
TYX crossed above the 120-month EMA in early 2022 and remains there today despite a slight decline in rates recently. As long as this situation holds, the most common interpretation is that bonds remain in a long-term downtrend (i.e., as interest rates remain in a long-term uptrend). In a bond bear market, the best idea for long-term bond investors is to avoid long-duration bonds and stick to short-term maturities.
Copper/Gold Ratio still flashing yellow for bonds
The Copper/Gold Ratio impacts many markets, including treasury bonds. The current level of this ratio continues to act as a weight on bond prices. The chart below highlights the action of 30-year treasury bond futures (THIRTY) and all dates when the Copper/Gold Ratio stood below 0.20, and the table summarizes subsequent THIRTY performance.
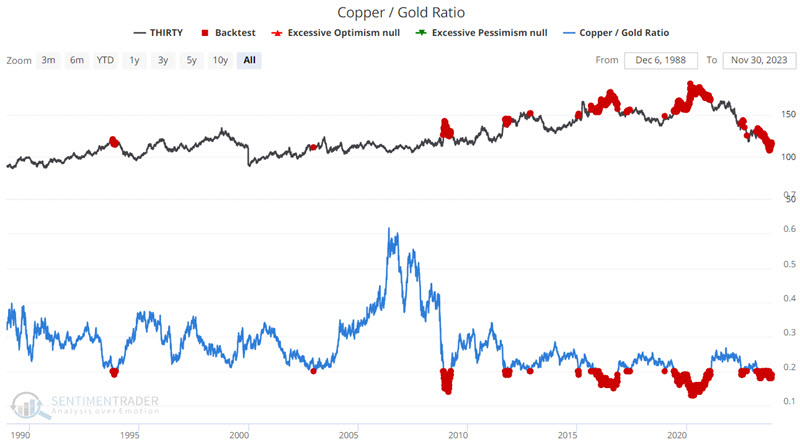
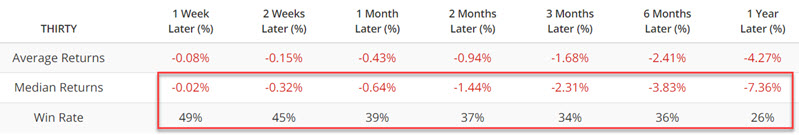
Note that the Median Return for THIRTY is negative for all timeframes, and the Win Rate is below 50%. The Copper/Gold Ratio has been below 0.20 continuously since 2023-04-23.
Bond trader sentiment is getting frothy
As the bond market finally bounced, bond traders have flocked to the bullish side as those who "want to believe" that bonds have nowhere to go but up, piled in. Typically, however, the current level of bullish enthusiasm has not been rewarded. Let's look at a few examples.
The Vanguard Total Bond Market ETF (ticker BND) is an ETF that tracks the broader bond market, including treasuries and high-grade corporates. The chart below highlights those dates when the BND Optix indicator crossed above 97%.
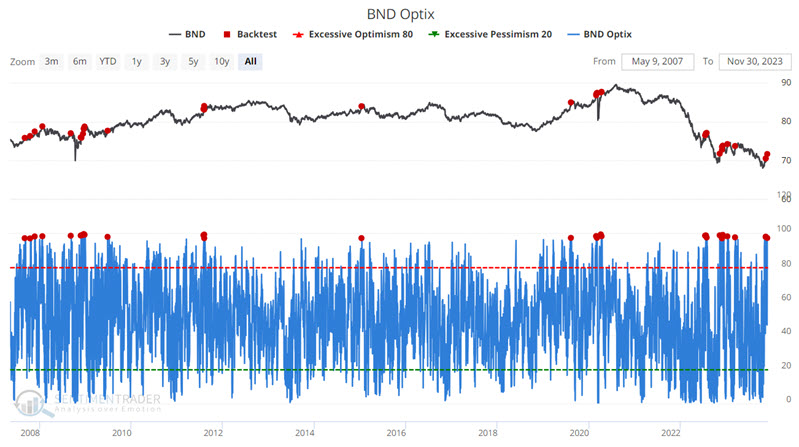
The table below summarizes subsequent BND performance.
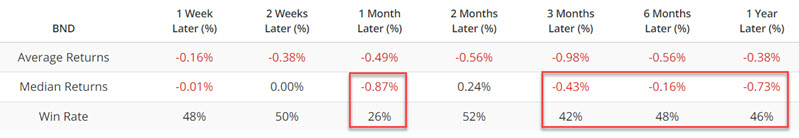
Overall, the results are not wildly bearish but skew to the negative side.
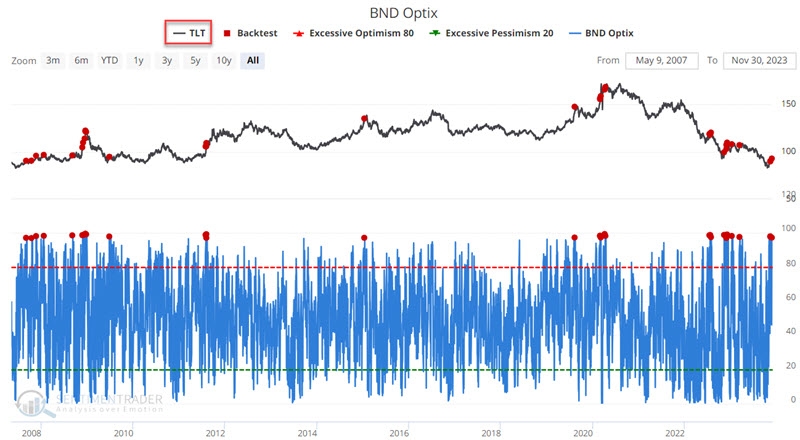
The iShares 20+ Year Treasury ETF (ticker TLT) tracks the performance of long-term treasury bonds - which are a pure play on interest rates and are thus most susceptible to changes in interest rates. Let's look at TLT performance based on the BND Optix signals above.
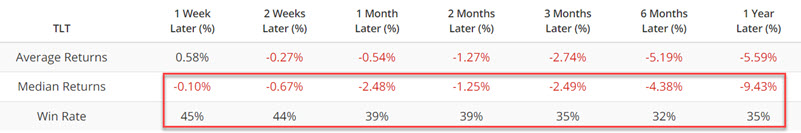
The chart and table below display TLT performance results following BND Optix crosses above 97%.
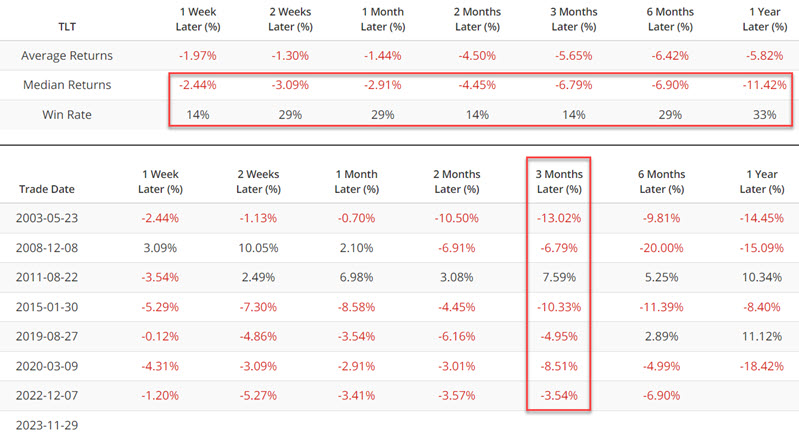
Lastly, let's look at TLT Optix. The chart below highlights those dates when the 20-day average of the TLT Optix indicators crossed above 76%. The most recent signal occurred on 2023-11-29.
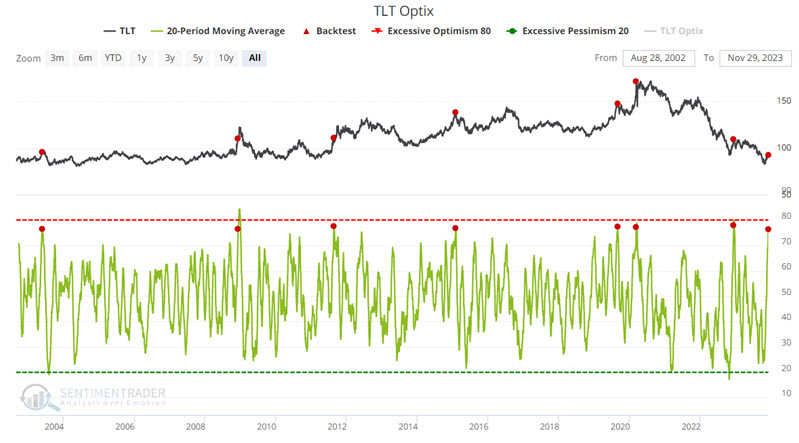
As you can see in the summary table below, TLT has tended to perform poorly following signals, with only a 14% Win Rate after 2 and 3 months and a median 1-year return of -11.42%.
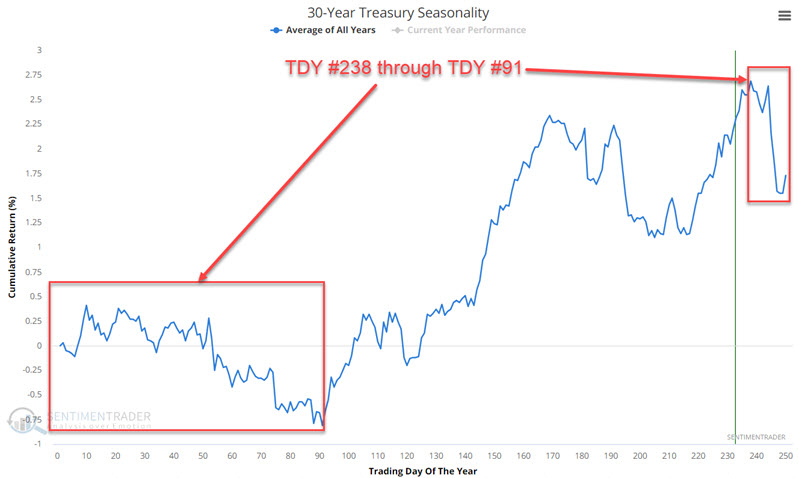
Seasonality could soon weigh in as a negative factor
The chart below displays the annual seasonal trend for 30-year treasury bond futures. As you can see a period of seasonal weakness extends from Trading Day of the Year (TDY) #238 through TDT #91 the following year. This period will begin at the close on 2023-12-04.
The chart below displays the hypothetical cumulative $ +(-) achieved by holding a long 1-lot position in treasury bond futures only during this period every year since 1977.
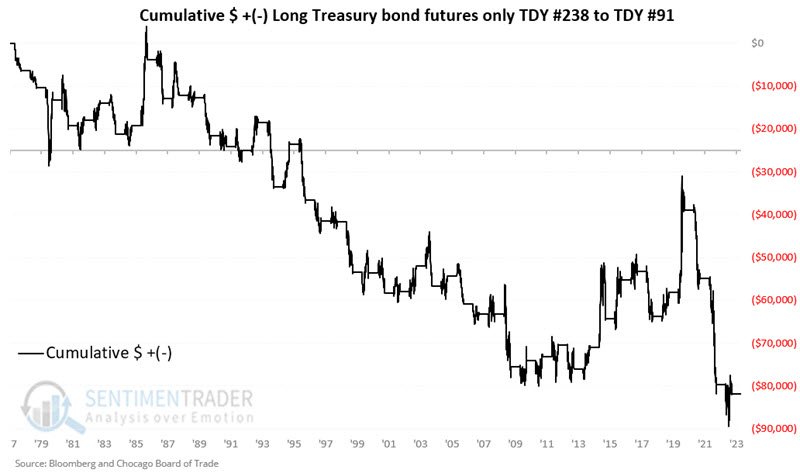
The table below summarizes treasury bond futures performance during this period.
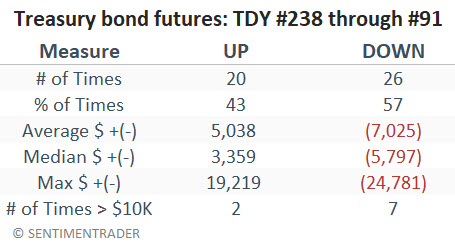
As always with seasonality, there is no way to know in advance if this year will conform with the long-term tendency for weakness, or be an exception to the rule. Still, given the current rising trend in rates and the other abovementioned warning signs, it does provide once more reason to be cautious.
What the research tells us...
Unfortunately, the current situation is a classic case of "bonds could go up, or bonds could go down." As we pointed out earlier, long-term treasury bonds could rally significantly from current levels and still have that rally amount to nothing more than a retracement of the massive bear market decline in the last three years. At the same time, interest rates remain objectively in a long-term rising trend, and various useful indicators are currently flashing warning signs.
One point of view would argue that speculative traders look for opportunities to play the long side of long-term treasuries (with a keen eye on managing risk) and that longer-term bond investors continue to stick to short to intermediate-term maturities.