
Good and Bad Sentiment in the Metals Markets

Key points
- The metals markets continue to demand traders' attention
- A rare signal from the Gold VIX indicator suggests that metals could be significantly higher a year from now
- However, in the short term, an extreme in bullish sentiment suggests caution
A head-scratching signal from Gold VIX
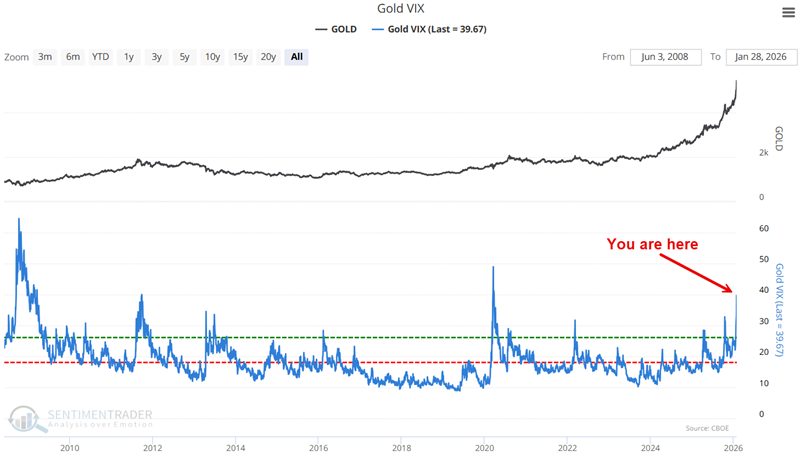
Similar to the VIX, which most people are familiar with and tracks traders' expectations of future volatility in the stock market based on option pricing models, our Gold VIX indicator tracks volatility expectations using options on the SPDR Gold Trust ETF (GLD).
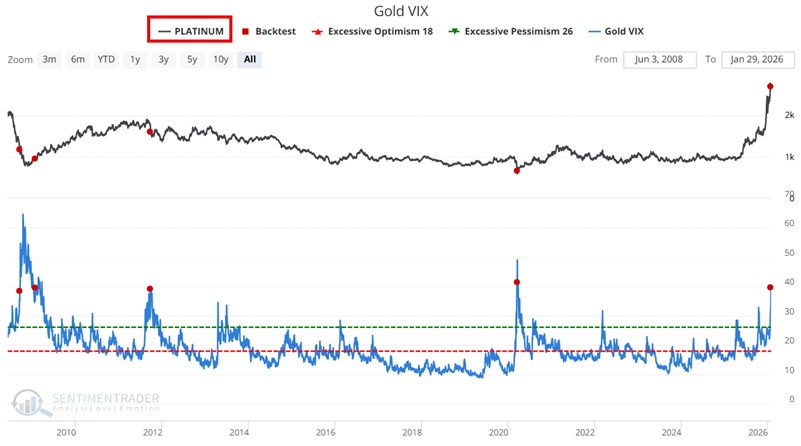
As shown in the chart below, Gold VIX recently spiked to a level rarely seen before.
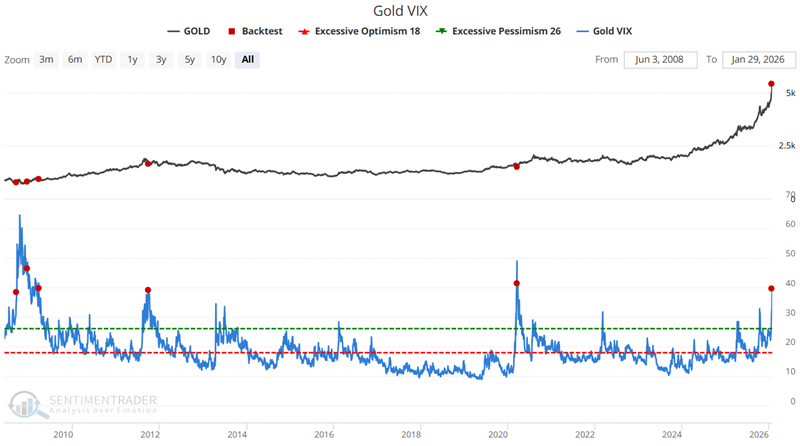
The chart below highlights, with a red dot, the rare occasions when the Gold VIX crossed above 38 for the first time in three months.
The table below summarizes subsequent Gold performance following the dates highlighted above.
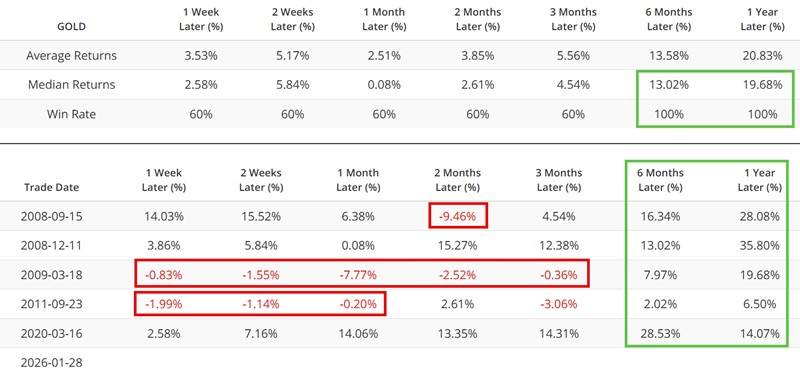
The sample size is so small that it may be dangerous to attempt to draw conclusions. Likewise, the parabolic type of action in the metals markets lately may render any historical comparisons meaningless. Still, for the record, the key thing to note from the results above is that - despite hit-or-miss results in the first three months after a signal - Gold has been higher 6 and 12 months later each time.
More of the same with Silver
Gold and Silver are highly correlated. So, it should come as no surprise that Silver performance following the Gold VIX signal highlighted above has been noteworthy.
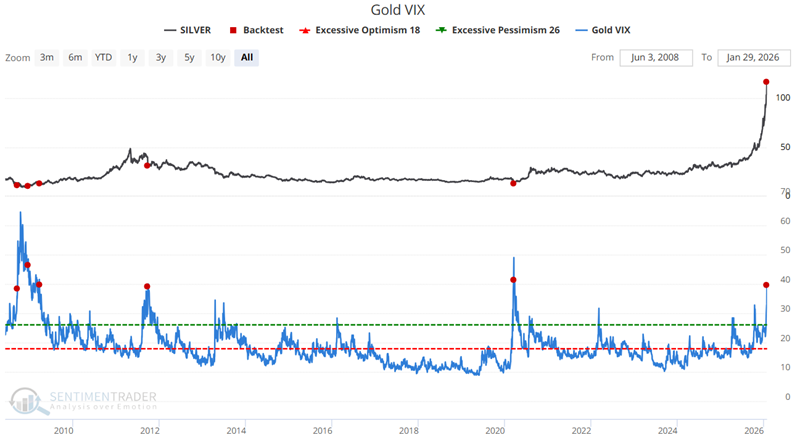
The chart below highlights, with a red dot, the rare occasions when the Gold VIX crossed above 38 for the first time in three months, with Silver as the underlying index.
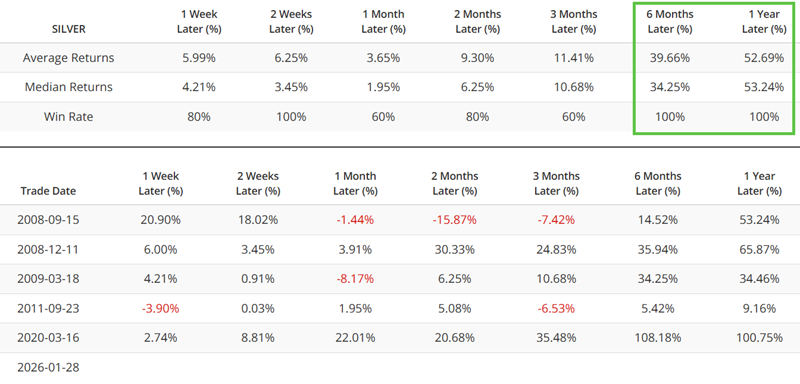
The table below summarizes subsequent Silver performance following the dates highlighted above.
Platinum results are also worthy of note
Gold and Platinum are also highly correlated. So, it should also come as no surprise that Platinum performance following the Gold VIX signal highlighted above has been noteworthy, though perhaps not to the same degree as Gold and Silver.
The chart below highlights, with a red dot, the rare occasions when the Gold VIX crossed above 38 for the first time in three months, with Platinum as the underlying index.
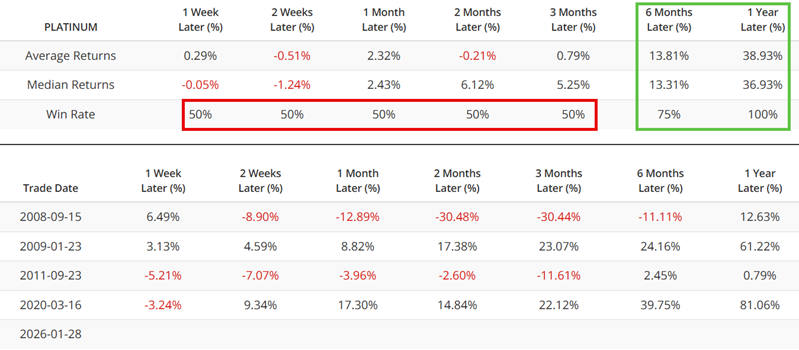
The table below summarizes subsequent Platinum performance following the dates highlighted above.
Meanwhile, Sentiment flashes yellow
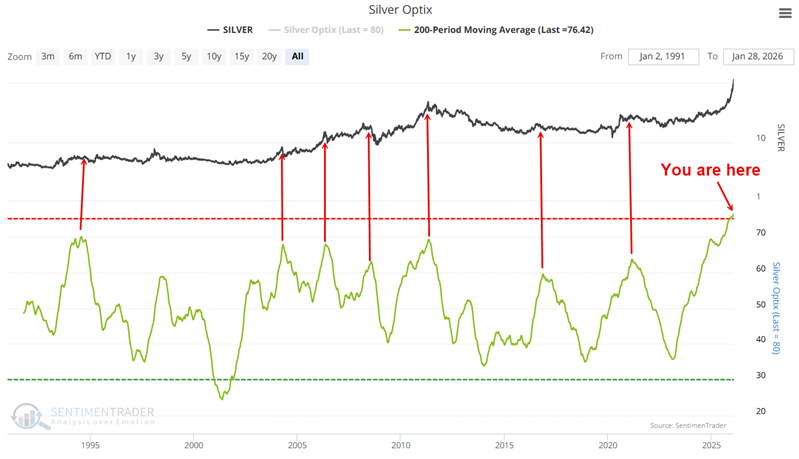
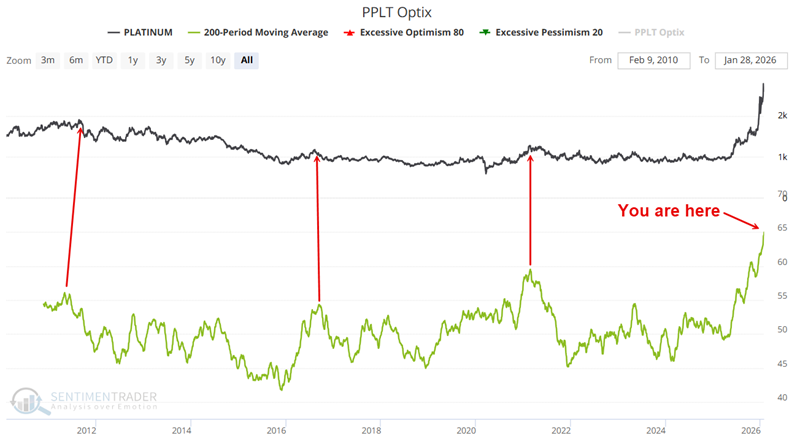
Parabolic price movements in commodity markets have historically ended badly. Setting aside seemingly favorable six-to-twelve-month implications, sentiment is flashing a warning sign for the metals markets in the interim.
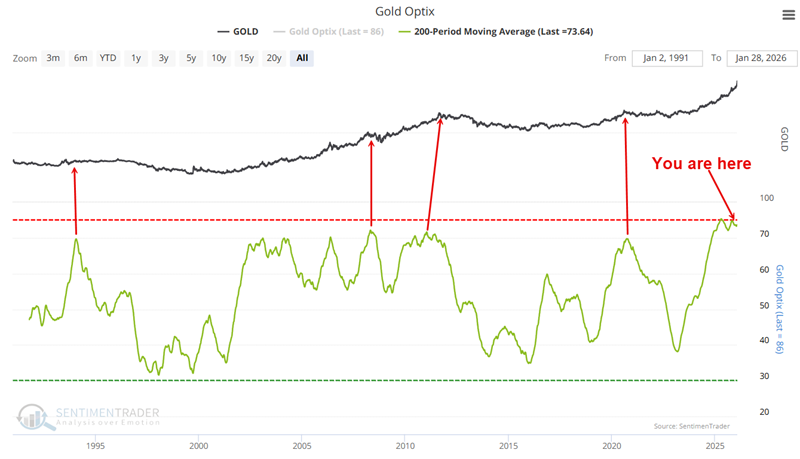
The charts below show Gold, Silver, and Platinum, each with the 200-day moving average of our Optix indicator overlaid. Note that the 200-day average for all is at or near an all-time high.
What the research tells us…
Trying to time the swings in markets that routinely make 5%+ daily moves is exceedingly difficult. Stepping back and looking at the big picture, given a) the parabolic nature of recent price movements, and b) the exorbitantly high levels of bullish sentiment, it is not difficult to envision a significant correction/consolidation in the metals markets. That said, the results following previous Gold VIX spikes suggest that traders continue to look for opportunities to play the long side of the metals markets following a significant correction.