Products
SentimenTrader Trading Tools
‍
Backtest Engine
My Trading Toolkit
Correlation Analysis
Seasonality
Indicators & Data API
‍
Proprietary Indicators & Charts
Market Data API
Strategies & Scanner
‍
50+ Trading Strategies
Smart Stock Scanner
Research Reports
‍
Research Solutions
Reports Library
Free Resources
Simple Backtest Calculator
Simple Seasonality Calculator
The Kelly Criterion Calculator
Sentiment Geo Map
Public Research Reports
Pricing
Company
About
In the News
Testimonials
Client Success Stories
Contact
Log inLoginSign up
< BACK TO ALL REPORTS

Gold's triangle pattern will be key tell for miners

Jason Goepfert
2020-09-18
Over the past 30 days, gold has not made a 30-day high OR a 30-day low. It's just kind of sat there, forming a consolidation 'triangle pattern' after setting new highs in August. Prior triangles typically resolved to the upside, but the next couple of weeks proved key. This is a big tell for miners, which are also consolidating after one of the most overbought readings in decades.

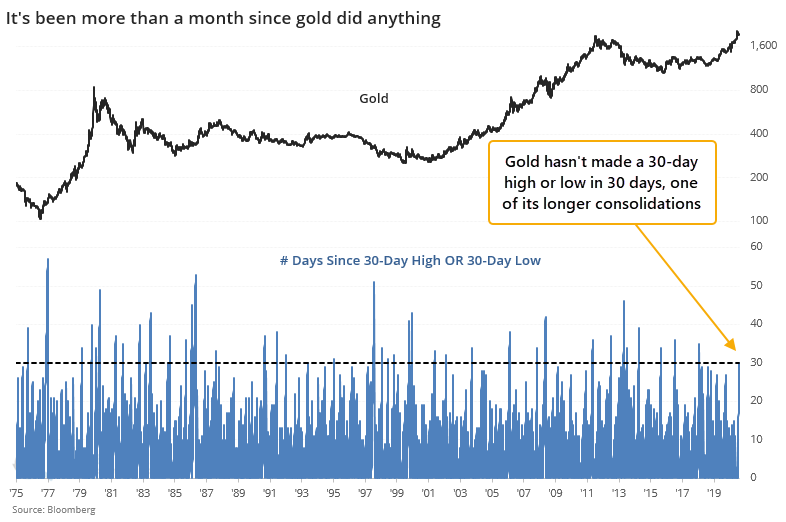
Gold hasn't done anything for more than a month. It gets derided as a "pet rock" because it has limited use for most investors, doesn't have any earnings, and doesn't pay any interest. For the past 30 days, it's lived up to its name.

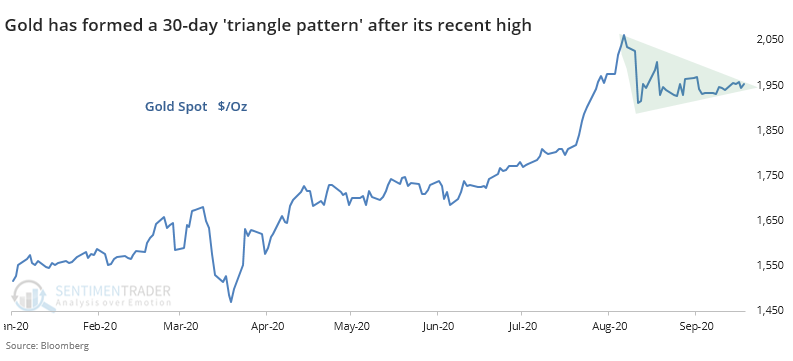
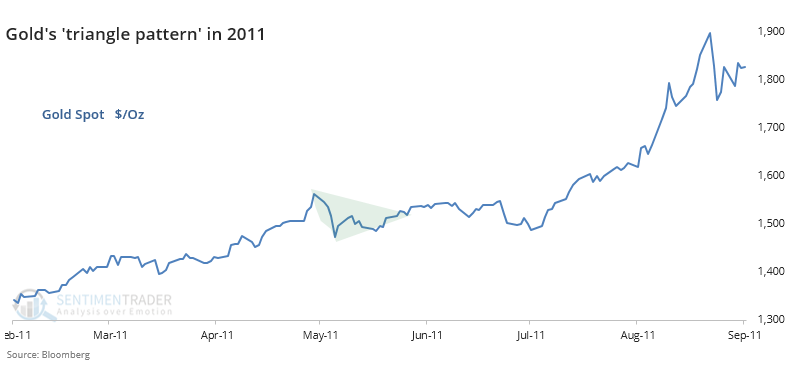
Since peaking on August 6, gold has gone into consolidation mode. It hasn't set a 30-day high OR a 30-day low in 30 sessions now.

This is what's commonly referred to as a "triangle pattern" because, well, it looks like a triangle.

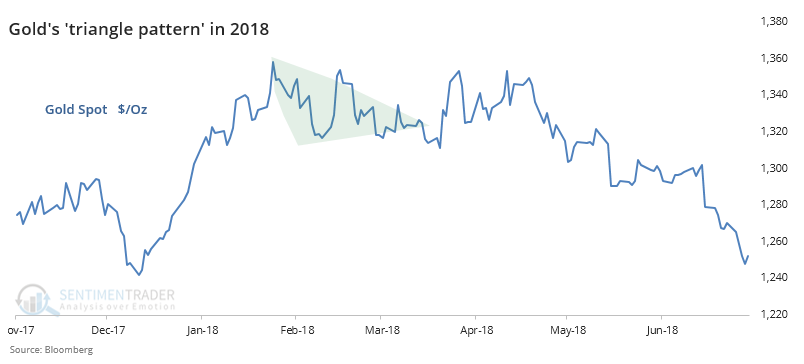
This happened in 2018 after a run-up in gold, too, and that didn't work out so well.

Neither did the one prior to that, in 2016.

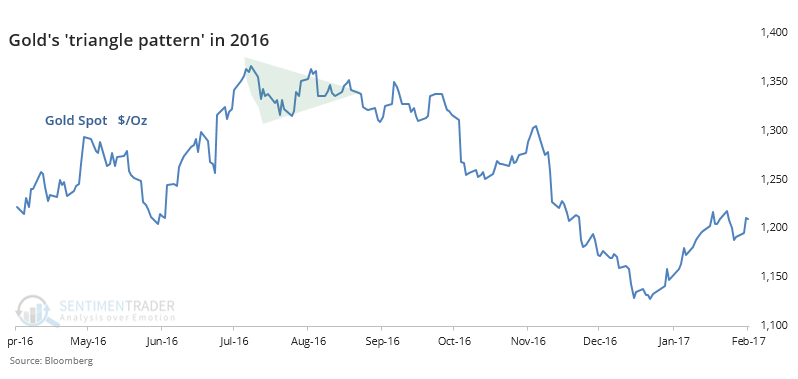
We'd have to go back to 2011 to see that last positive resolution of this pattern for the yellow metal.

Instead of subjectively eyeballing chart patterns, let's go back to 1975 and look for every time when gold hit a 52-week high, then failed to set either a 30-day high or a 30-day low for 30 days. It rallied to a new high, then just sat there.

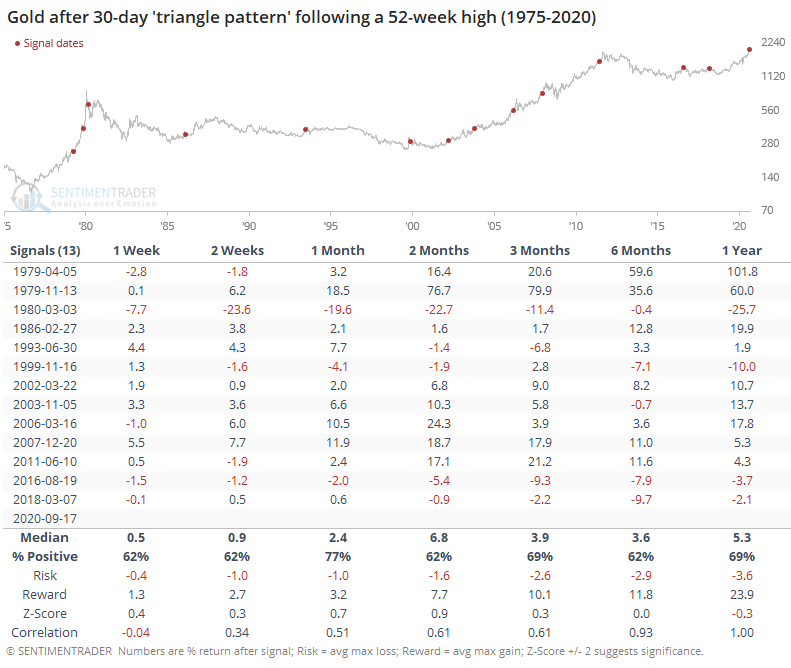
Mostly, gold resolved these patterns by breaking out to the upside. Over the next 3 months, it was higher 69% of the time, with an excellent risk/reward ratio.

The last row in the table, titled "Correlation", shows the relationship between that time frame's median return and the median return 1 year later. It shows us there was a slight tendency to see a fakeout over the next week, but gold's returns over the next 2-4 weeks gave us a decent hint at what returns over the next year would look like.

In an earlier premium note, Troy looked at this in a different way, using the expansion and contraction in gold's Bollinger Bands, a measure of volatility. Those future returns were poor, mainly because most of the signals triggered during bear markets. That's a bit of a concern, and it would be as well if gold breaks down out of this triangle pattern in the weeks ahead. History suggests it has a decent probability of heading higher, but buyers need to prove they have enough optimism to push it outside its recent consolidation zone.

Because gold had been doing well, miners were as well. Over the past 20 days, an average of more than 97% of gold mining stocks have held above their 200-day moving averages. That's among the best performances in nearly 30 years. The problem for the miners is they've never really been able to sustain this kind of momentum.

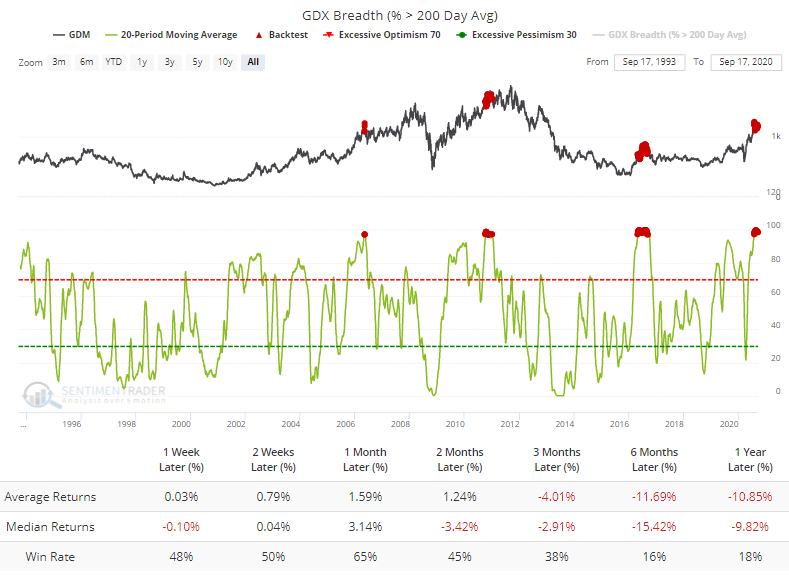
The Backtest Engine shows that miners have not been able to tack on many gains following these signals. Over the next 6 months, their returns were horrid.

The other breadth metrics we follow for the miners are mostly good and not necessarily extreme. 

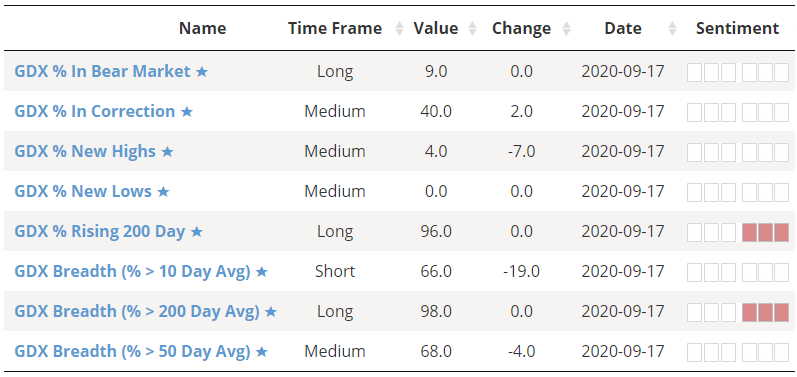
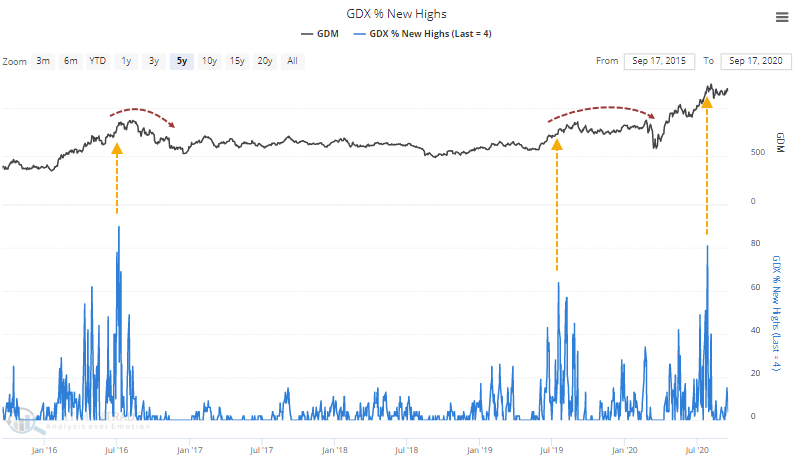
While only 4% of them just hit a 52-week high, recently that had been more than 80%, a rarely-achieved feat of coordinated buying interest in the sector. Like we saw with how many of them were above their 200-day averages, though, these companies have not had much success at maintaining this kind of upside momentum as a group.

Whichever way gold breaks from its triangle pattern in the weeks ahead will almost certainly determine the fate of the miners as well. History hasn't been very kind after showing the kinds of moves they've enjoyed in recent months, so bulls have to hope that this time is different.

PRODUCTS
SentimenTrader
Trading Tools
Indicators & Data API
‍
Strategies & Scanner
‍
Research Reports
FREE
RESOUrCES
Simple Backtest
Calculator
Simple Seasonality
Calculator
The Kelly Criterion
Calculator
Sentiment Geo Map
‍
Public Research Reports
‍
Pricing
Bundle pricing
‍
Announcements
‍
FAQ
COMPANY
‍
About
‍
In the News
‍
Testimonials
‍
Client Success Stories
CONTACT
‍
General Inquiries
‍
Media Inquiries
‍
Financial Professionals Inquiries
‍
© 2025 Sundial Capital Research Inc. All rights reserved.
Setsail Marketing
TermsPrivacyAffiliate Program
Risk Disclosure: Futures and forex trading contains substantial risk and is not for every investor. An investor could potentially lose all or more than the initial investment. Risk capital is money that can be lost without jeopardizing ones’ financial security or life style. Only risk capital should be used for trading and only those with sufficient risk capital should consider trading. Past performance is not necessarily indicative of future results.

Hypothetical Performance Disclosure: Hypothetical performance results have many inherent limitations, some of which are described below. No representation is being made that any account will or is likely to achieve profits or losses similar to those shown; in fact, there are frequently sharp differences between hypothetical performance results and the actual results subsequently achieved by any particular trading program. One of the limitations of hypothetical performance results is that they are generally prepared with the benefit of hindsight. In addition, hypothetical trading does not involve financial risk, and no hypothetical trading record can completely account for the impact of financial risk of actual trading. for example, the ability to withstand losses or to adhere to a particular trading program in spite of trading losses are material points which can also adversely affect actual trading results. There are numerous other factors related to the markets in general or to the implementation of any specific trading program which cannot be fully accounted for in the preparation of hypothetical performance results and all which can adversely affect trading results.

Testimonial Disclosure: Testimonials appearing on this website may not be representative of other clients or customers and is not a guarantee of future performance or success.