Products
SentimenTrader Trading Tools
‍
Backtest Engine
My Trading Toolkit
Correlation Analysis
Seasonality
Indicators & Data API
‍
Proprietary Indicators & Charts
Market Data API
Strategies & Scanner
‍
50+ Trading Strategies
Smart Stock Scanner
Research Reports
‍
Research Solutions
Reports Library
Free Resources
Simple Backtest Calculator
Simple Seasonality Calculator
The Kelly Criterion Calculator
Sentiment Geo Map
Public Research Reports
Pricing
Company
About
In the News
Testimonials
Client Success Stories
Contact
Log inLoginSign up
< BACK TO ALL REPORTS

Gold's Shocking Drop

Jason Goepfert
2019-09-09
null

This is an abridged version of our recent reports and notes. For immediate access with no obligation, sign up for a 30-day free trial now.

Gold’s bull run

ETF traders have consistently poured money into gold funds, even during Thursday’s big drop, which was a “shocking” decline.

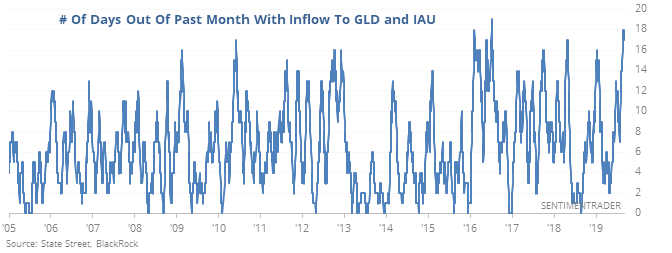
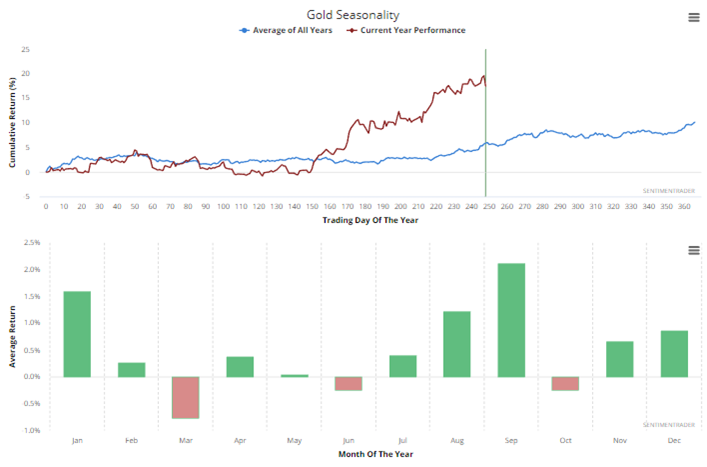
It started to fall just as economic surprises in the U.S. have turned positive. Sentiment on the metal is the highest since 2011 as it enters a shaky seasonal window.

Best fits

Even with the late losses this week, gold has had a heck of a run

The best fit to what we’ve seen over the past year was 2009, and since 1975 there have been 10 one-year periods with a very high correlation to gold’s path over the past year.

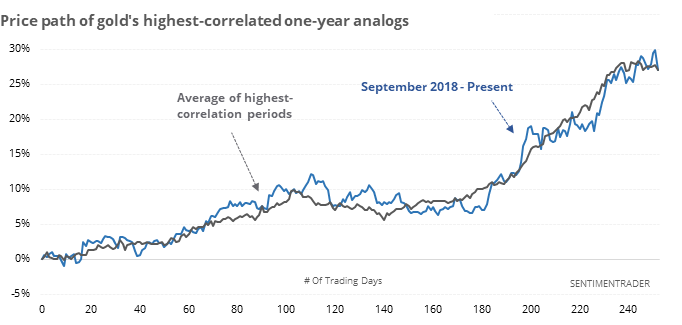
Those mostly saw some weakness over the next couple of months, but all rallied longer-term.

Breakout in S&P 500 stocks

There was a spike in stocks in the S&P 500 that broke out of their ranges and hit 1-month highs late this week, while fewer than 15% of them have managed to hit a 52-week high.

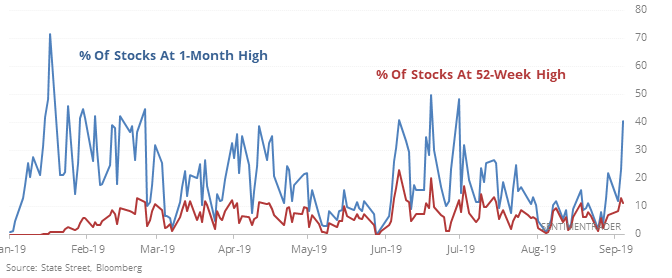
Based on the sectors that have been leading this charge, we should see a rise in stocks hitting new highs, as future returns were consistently positive after those signals with the highest sector correlation to now.

The latest Commitments of Traders report was released, covering positions through Tuesday

The 3-Year Min/Max Screen shows that smart money hedgers have established a new multi-year extreme in exposure to copper, while shorting gold and Eurodollars.

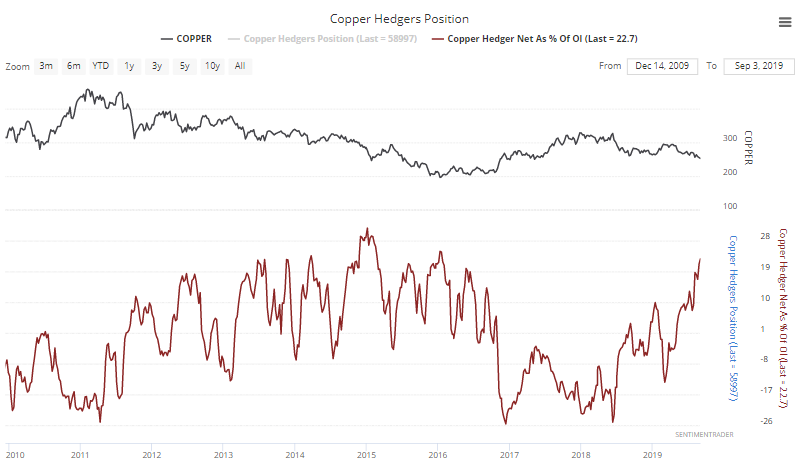
They’ve also added to substantial long positions in “c” soft contracts like cocoa, coffee, and cotton.

Macro

The economy and the stock market move in the same direction in the long term. Hence, leading economic indicators are also long term leading indicators for the stock market.

Here is our Macro Index, which aggregates 11 leading indicators. Overall, there is no significant U.S. economic deterioration right now. What will happen to macro in the future? I don't know. Instead of predicting the future, macro tells us how to react and trade day-by-day depending on what's happening right now.

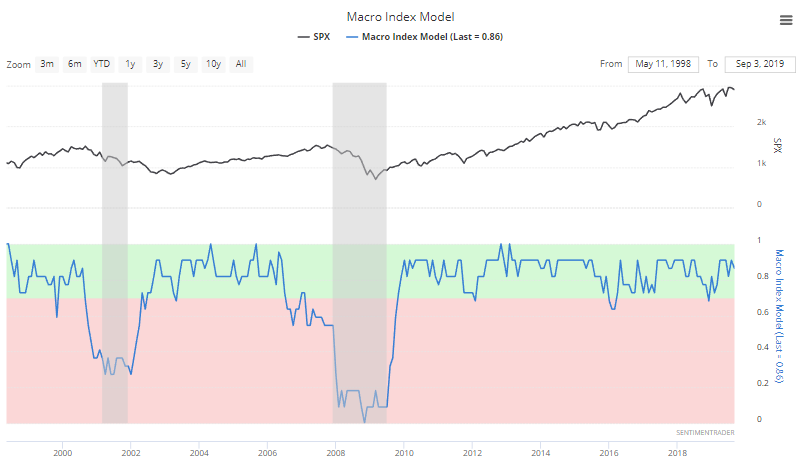
The main weak points in U.S. macro revolve around trade, manufacturing, and the yield curve. Housing and financial conditions are semi-weak, but there has yet to be significant deterioration.

PRODUCTS
SentimenTrader
Trading Tools
Indicators & Data API
‍
Strategies & Scanner
‍
Research Reports
FREE
RESOUrCES
Simple Backtest
Calculator
Simple Seasonality
Calculator
The Kelly Criterion
Calculator
Sentiment Geo Map
‍
Public Research Reports
‍
Pricing
Bundle pricing
‍
Announcements
‍
FAQ
COMPANY
‍
About
‍
In the News
‍
Testimonials
‍
Client Success Stories
CONTACT
‍
General Inquiries
‍
Media Inquiries
‍
Financial Professionals Inquiries
‍
© 2025 Sundial Capital Research Inc. All rights reserved.
Setsail Marketing
TermsPrivacyAffiliate Program
Risk Disclosure: Futures and forex trading contains substantial risk and is not for every investor. An investor could potentially lose all or more than the initial investment. Risk capital is money that can be lost without jeopardizing ones’ financial security or life style. Only risk capital should be used for trading and only those with sufficient risk capital should consider trading. Past performance is not necessarily indicative of future results.

Hypothetical Performance Disclosure: Hypothetical performance results have many inherent limitations, some of which are described below. No representation is being made that any account will or is likely to achieve profits or losses similar to those shown; in fact, there are frequently sharp differences between hypothetical performance results and the actual results subsequently achieved by any particular trading program. One of the limitations of hypothetical performance results is that they are generally prepared with the benefit of hindsight. In addition, hypothetical trading does not involve financial risk, and no hypothetical trading record can completely account for the impact of financial risk of actual trading. for example, the ability to withstand losses or to adhere to a particular trading program in spite of trading losses are material points which can also adversely affect actual trading results. There are numerous other factors related to the markets in general or to the implementation of any specific trading program which cannot be fully accounted for in the preparation of hypothetical performance results and all which can adversely affect trading results.

Testimonial Disclosure: Testimonials appearing on this website may not be representative of other clients or customers and is not a guarantee of future performance or success.