
Gold's risk is rising

Key points
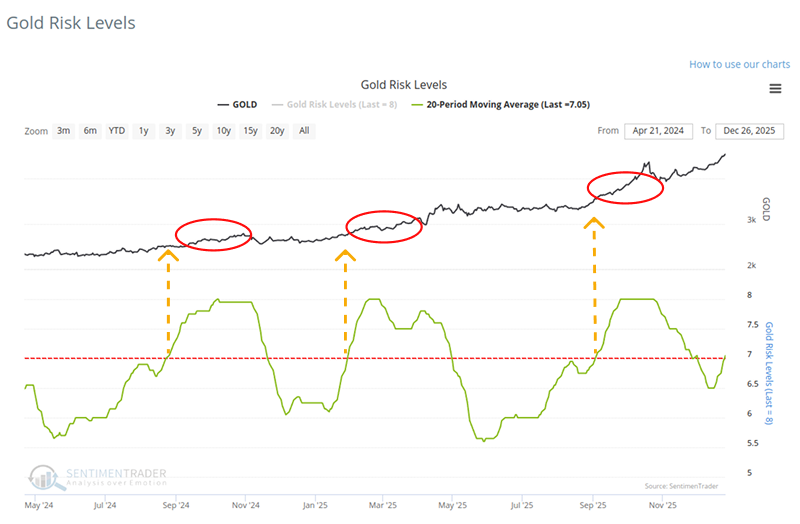
- Gold's recent rally has pushed its Sentiment-based Risk Level to a 20-day average of 7.
- Historically, when this Risk Level is reached, Gold has often continued to trend higher, provided buyers remain active in the first month.
- Interestingly, this signal has also served as a buy signal for the US Dollar and the Nikkei 225 over the subsequent year.
- Conversely, the Japanese Yen has typically faced significant headwinds following these periods of elevated gold sentiment.
Sentiment heats up for the yellow metal
Rising gold prices have attracted increased investor attention, significantly impacting market sentiment. The Optimism Index powers gold's Risk Level based on how the metal performed after different sentiment levels. Over the past 20 days, the risk level has averaged above 7, marking the third occurrence of this situation this year. The last time it reached this level coincided with the peak on September 4, 2025. In the three months that followed, the price of gold surged by 18.6%.
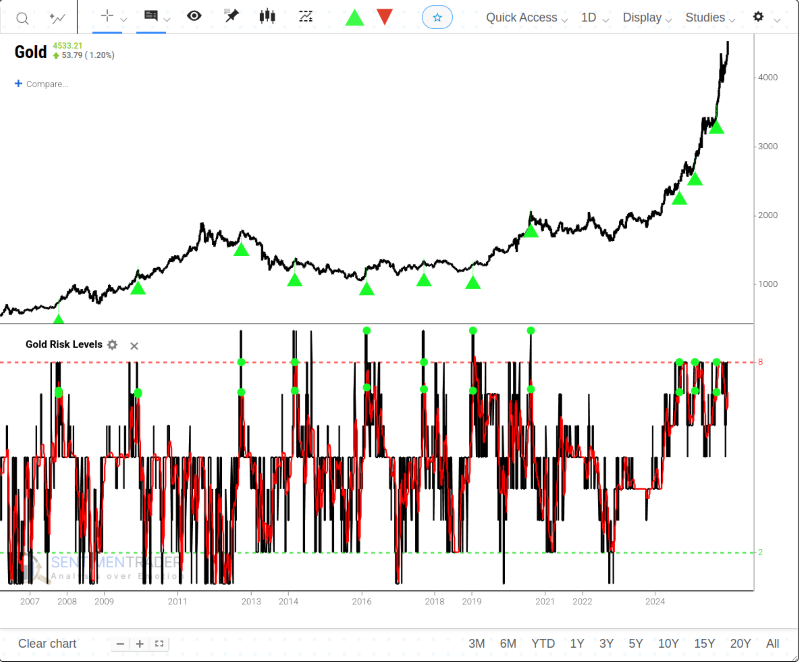
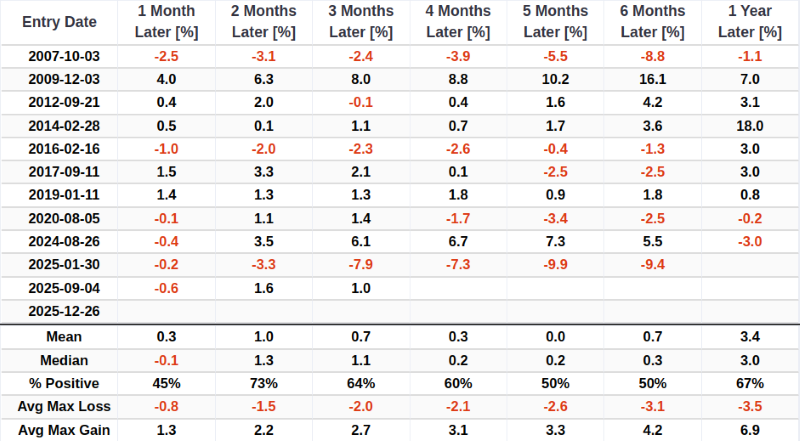
When the 20-day average risk level reaches 7 for the first time in months, it is not necessarily a clear-cut sell signal. In fact, the last three times this triggered, it coincided with significant subsequent rallies in gold prices.
The table below displays gold returns following these signals. We can observe that the "trend" in gold often persists after the signal is issued. As highlighted by the red boxes, when gold posts a positive return one month after the signal, there is a high probability of double-digit gains in the following months.
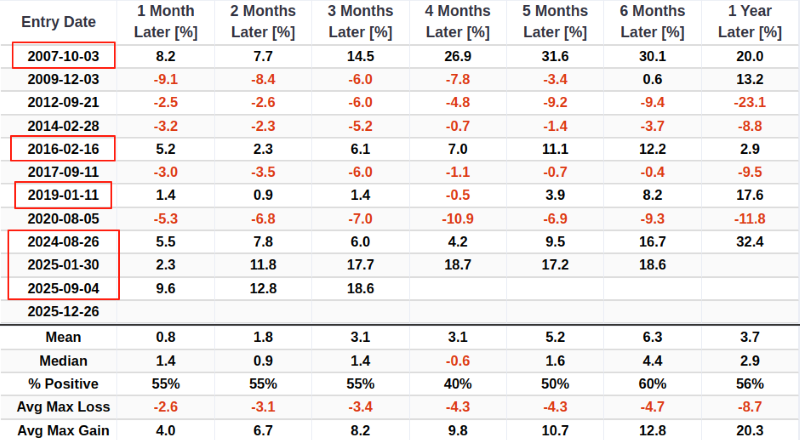
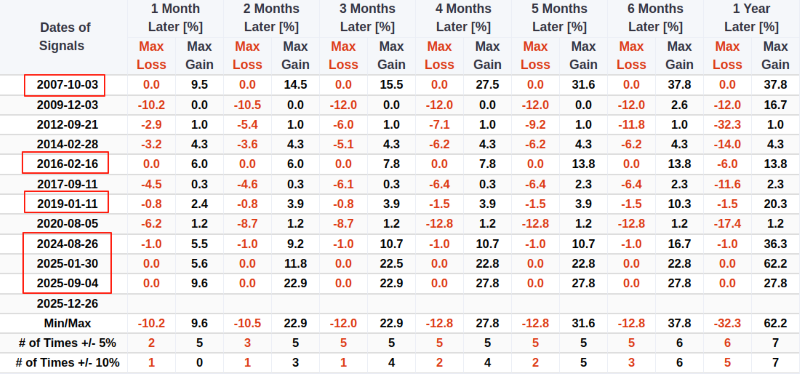
Three months after these signals, gold has never declined by more than 1%, indicating that buyers have consistently remained strong. This suggests that if buyers continue to push gold prices higher in the coming weeks, we have ample evidence that other factors are overriding sentiment constraints, potentially leading to a sustained rally.
Dollar and Nikkei 225 yes, Yen no
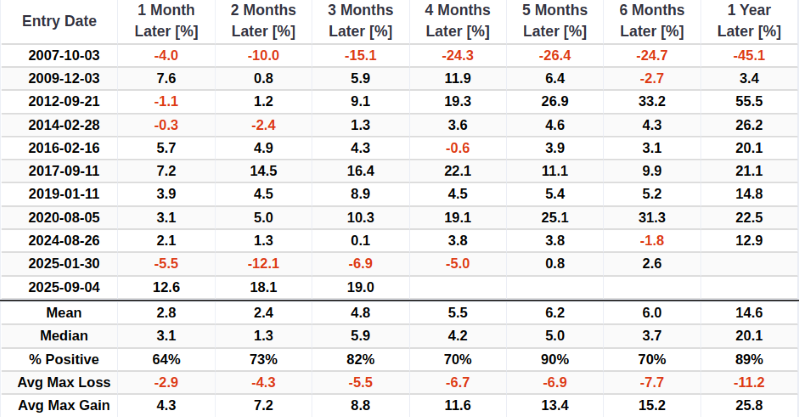
It is not surprising that gold prices rise while the dollar weakens. The two are primarily negatively correlated, although not perfectly so. Therefore, we can apply the same test, but this time observing the US Dollar instead of gold. The table shows that when sentiment for gold reaches such high levels and risk remains elevated for this long, it is typically accompanied by an oversold dollar.
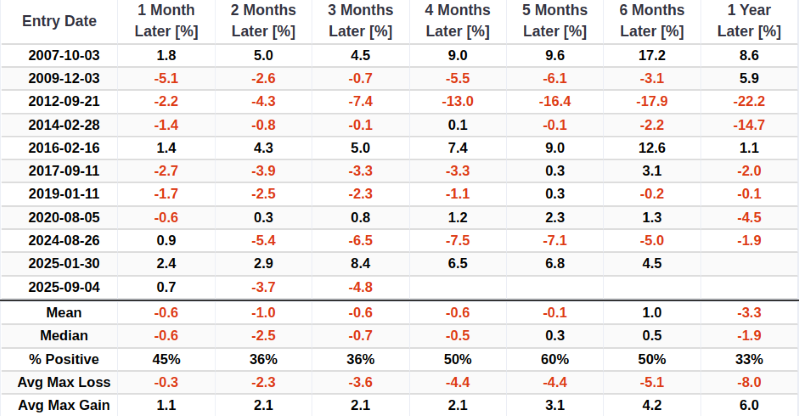
Some relationships are obvious, while others are less so. Few people closely consider the relationship between gold and the Japanese stock market and/or the Yen. When the 20-day average risk level for gold reaches 7 for the first time in months, it strongly implies a favorable price trend for the Nikkei index over the coming year.
Conversely, the Yen tends to face unfavorable price action over the subsequent year.
How can I recreate this signal in the Backtest Engine?
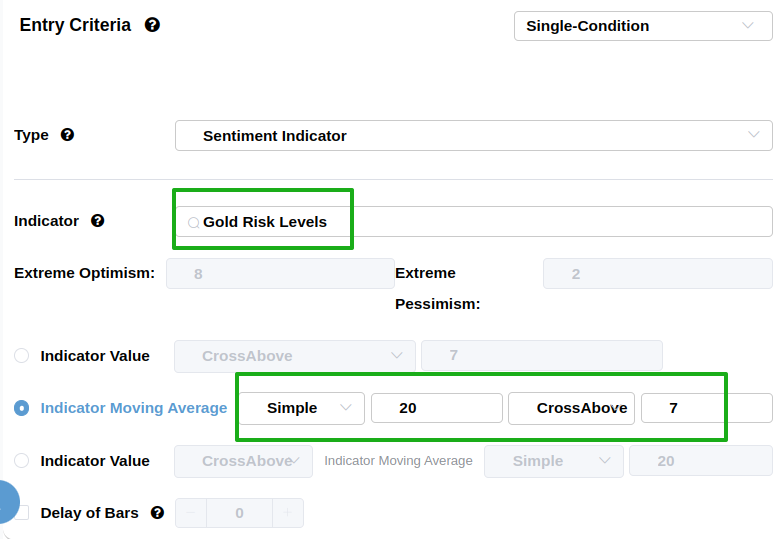
Complete the following tasks in the Entry Criteria section:
- Please select gold in the top-left corner.
- In the Indicator search box, type Gold Risk Levels and select the indicator
- In the Indicator Moving Average dropdown, set the lookback to 20, select "CrossAbove" and enter 7
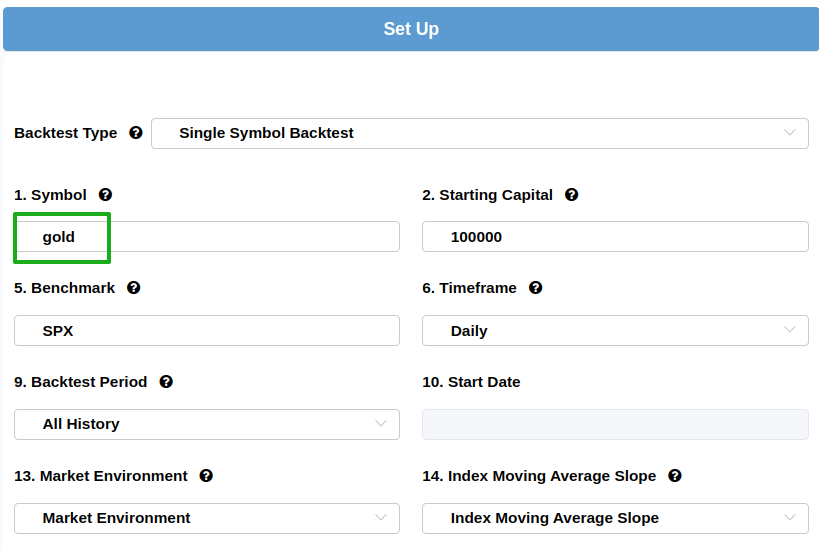
Then change the Time In Market from 21 to 63

Finally, click on the Run Backtest button.
What the research tells us...
Gold's recent strength has pushed sentiment to an elevated "Risk Level," a condition that intuitively suggests caution. However, historical data reveals that rather than marking a top, these periods of high optimism often signal strong momentum that can persist, especially if prices hold up in the near term. Interestingly, this gold-specific signal has broader cross-asset implications: it has historically been a bullish indicator for the US Dollar and Japanese equities (Nikkei 225) over the next 12 months, while signaling further weakness for the Japanese Yen.