
Gold's rally has been Sharpe, too

Key points:
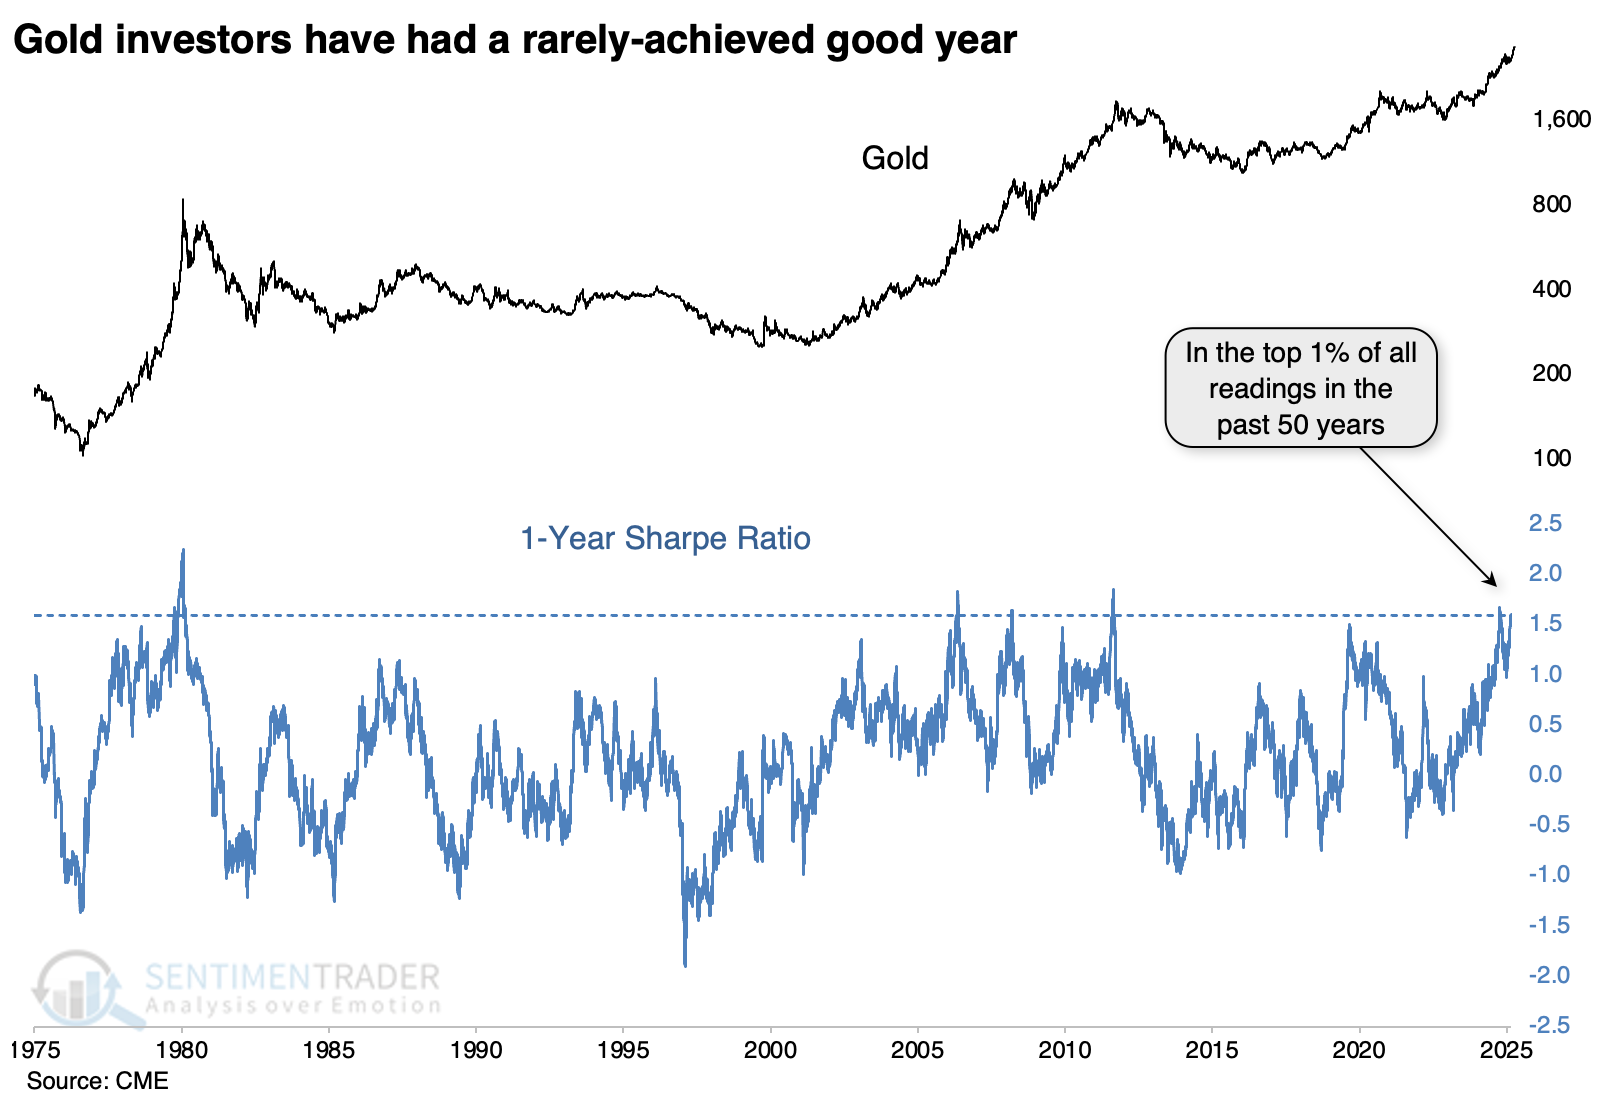
- Gold's 1-year Sharpe ratio has reached the top 1% of all days in the past 50 years
- Traders have been piling in, and exposure to the metal is high according to some measures
- As the metal enters a seasonal soft spot, risk for late buyers appears high
Gold's year ranks among the best ever
We've recently looked at the historically "easy" rallies in the S&P 500 and the German DAX over the past year. It's been an even better one for gold.
Using the same calculation for the Sharpe ratio, gold's performance just entered the top 1% of all days since 1975.
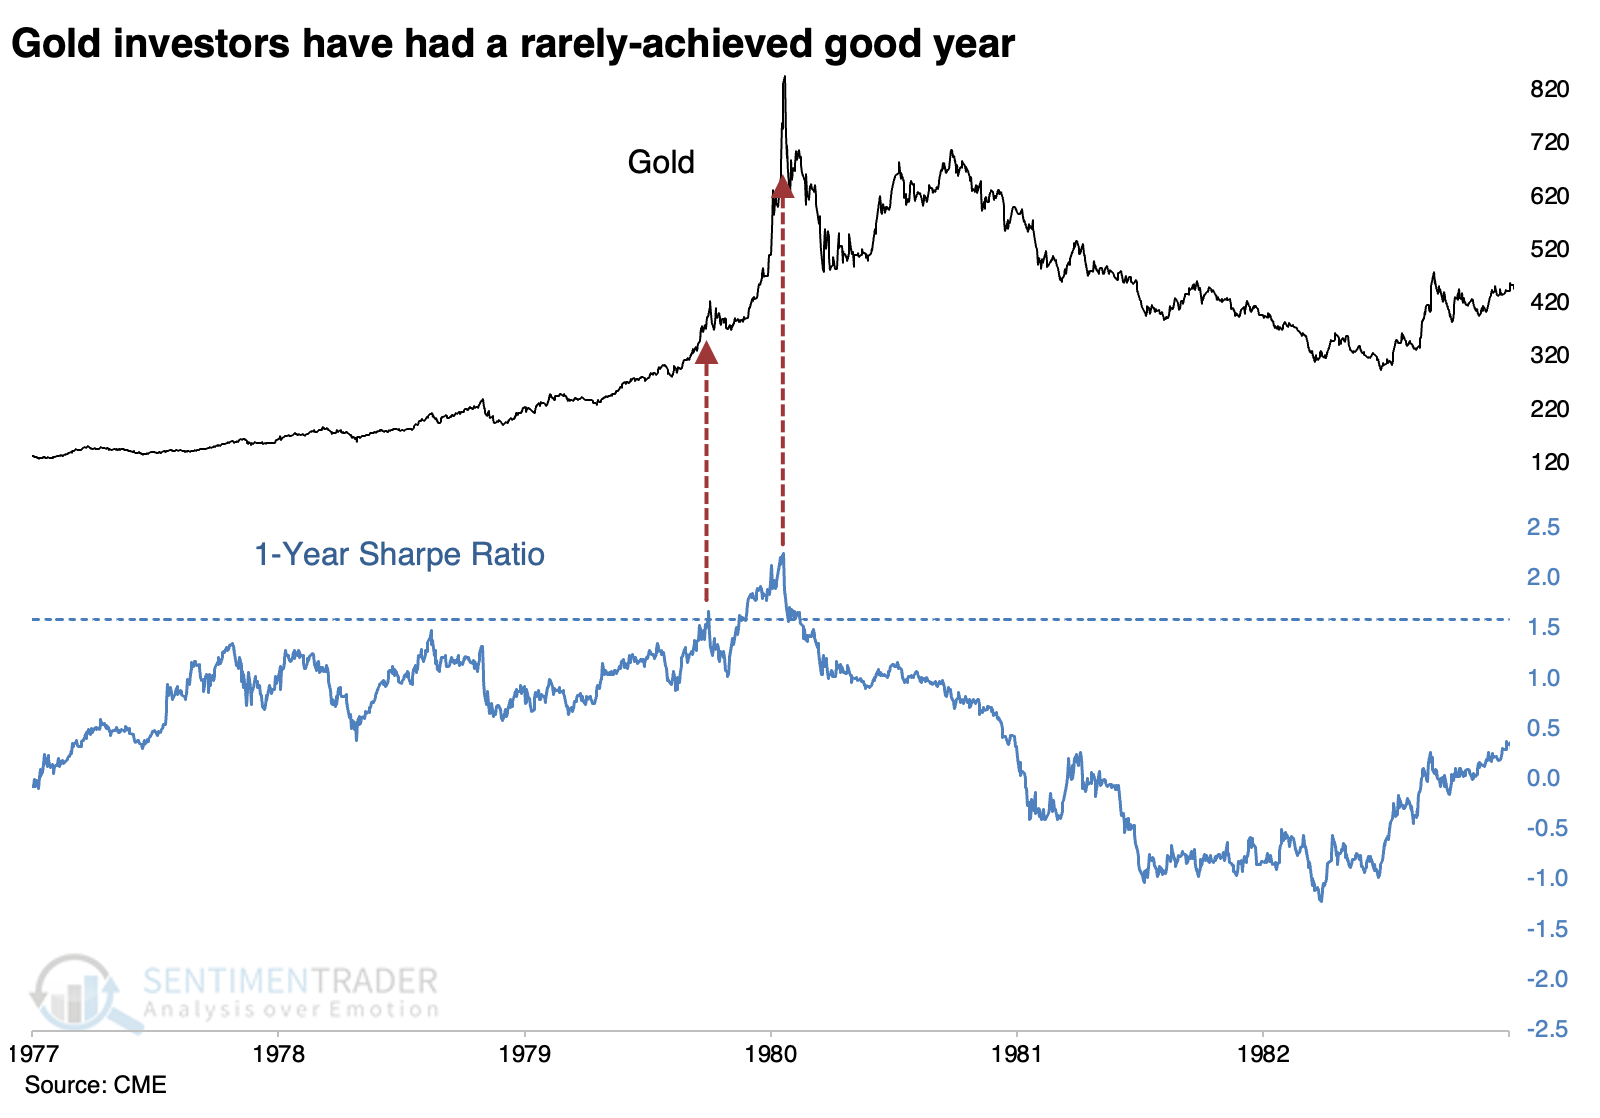
During the first exponential rally since gold started trading freely, the Sharpe ratio exceeded 1.6 (its current level) in October 1979, which preceded a pullback and consolidation. It then went on the best rally in gold's history, which pushed the Sharpe ratio to a level it still has not exceeded.
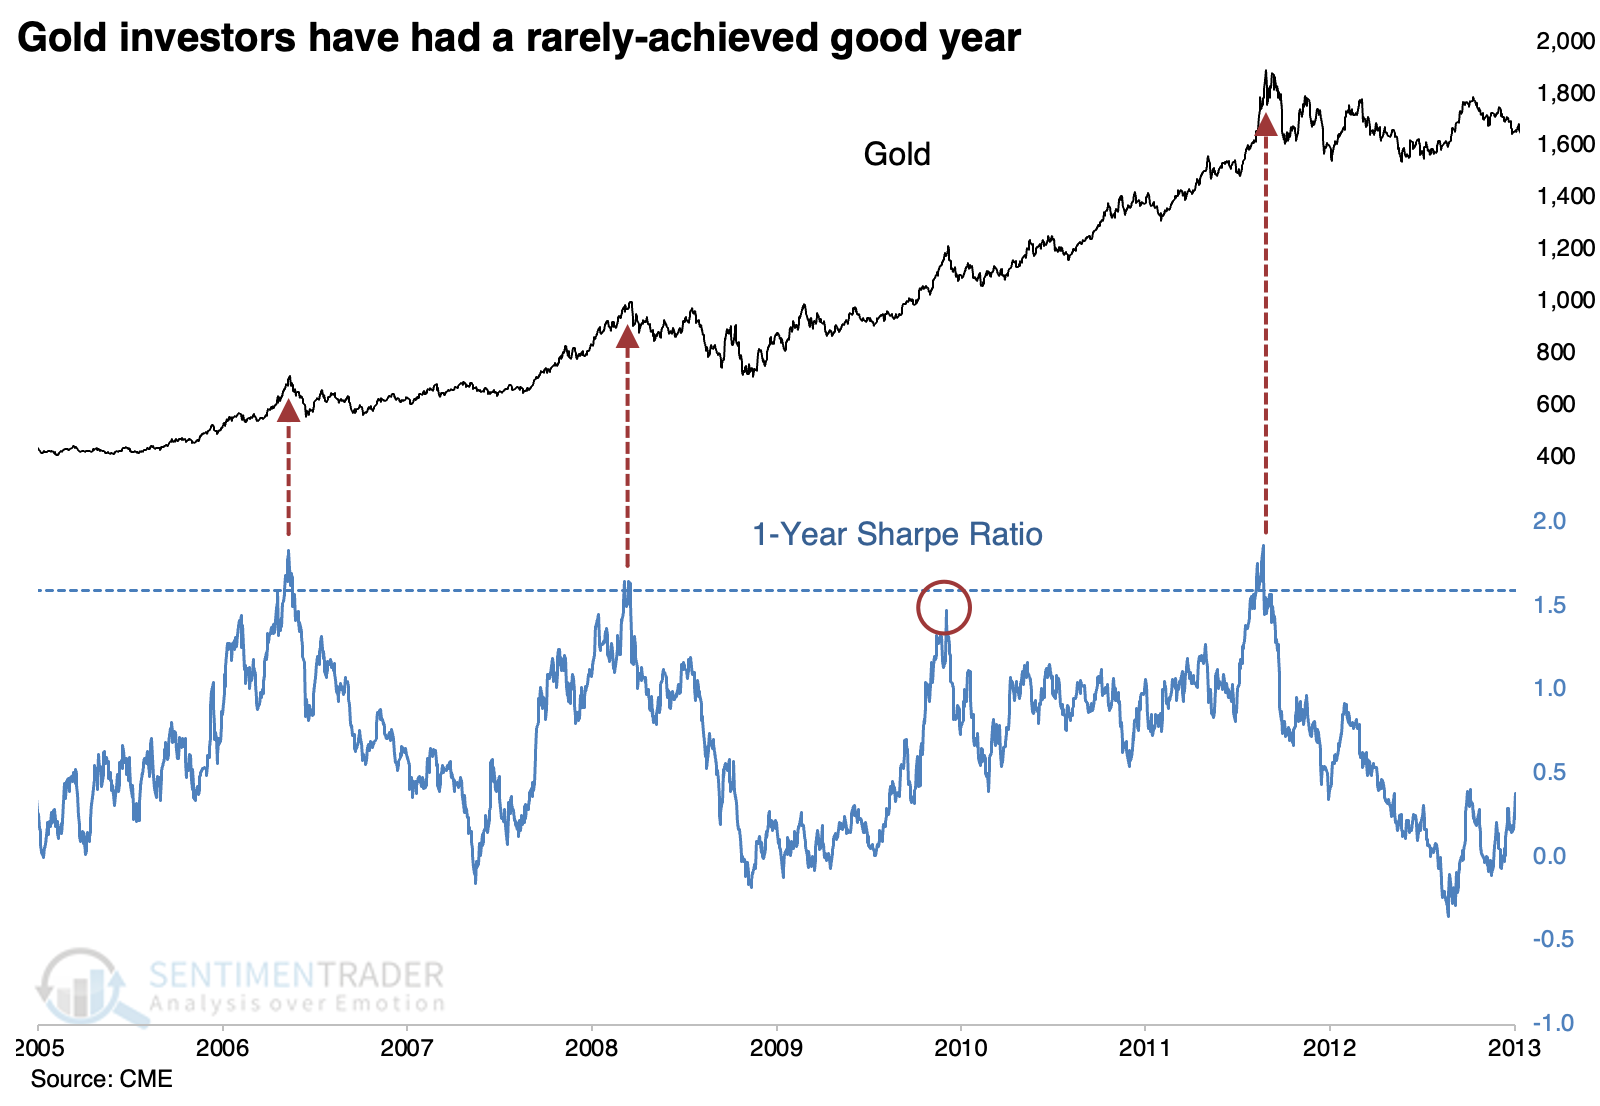
The other three distinct times the Sharpe ratio exceeded 1.6 occurred between 2006 - 2011. Each time the ratio peaked, it preceded a substantial correction, as did the instance in late 2009 that barely missed the threshold level.
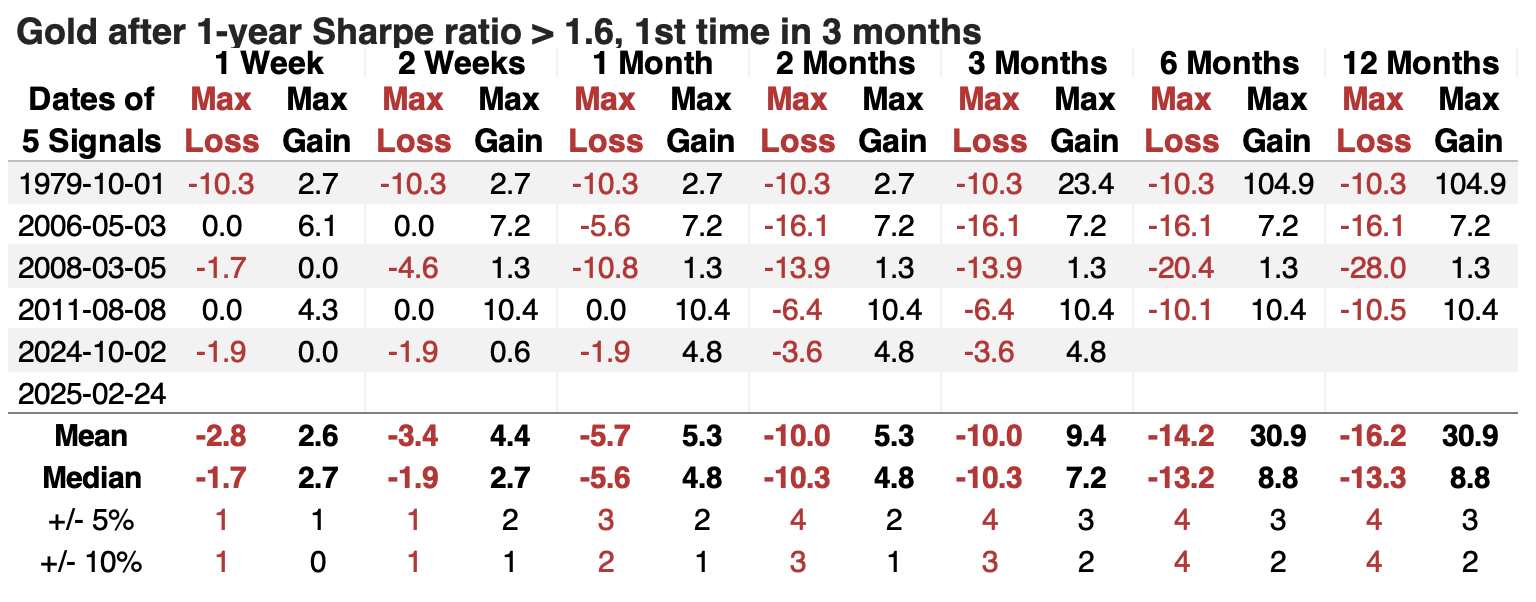
The table below puts some numbers to the charts, and they're not pretty.
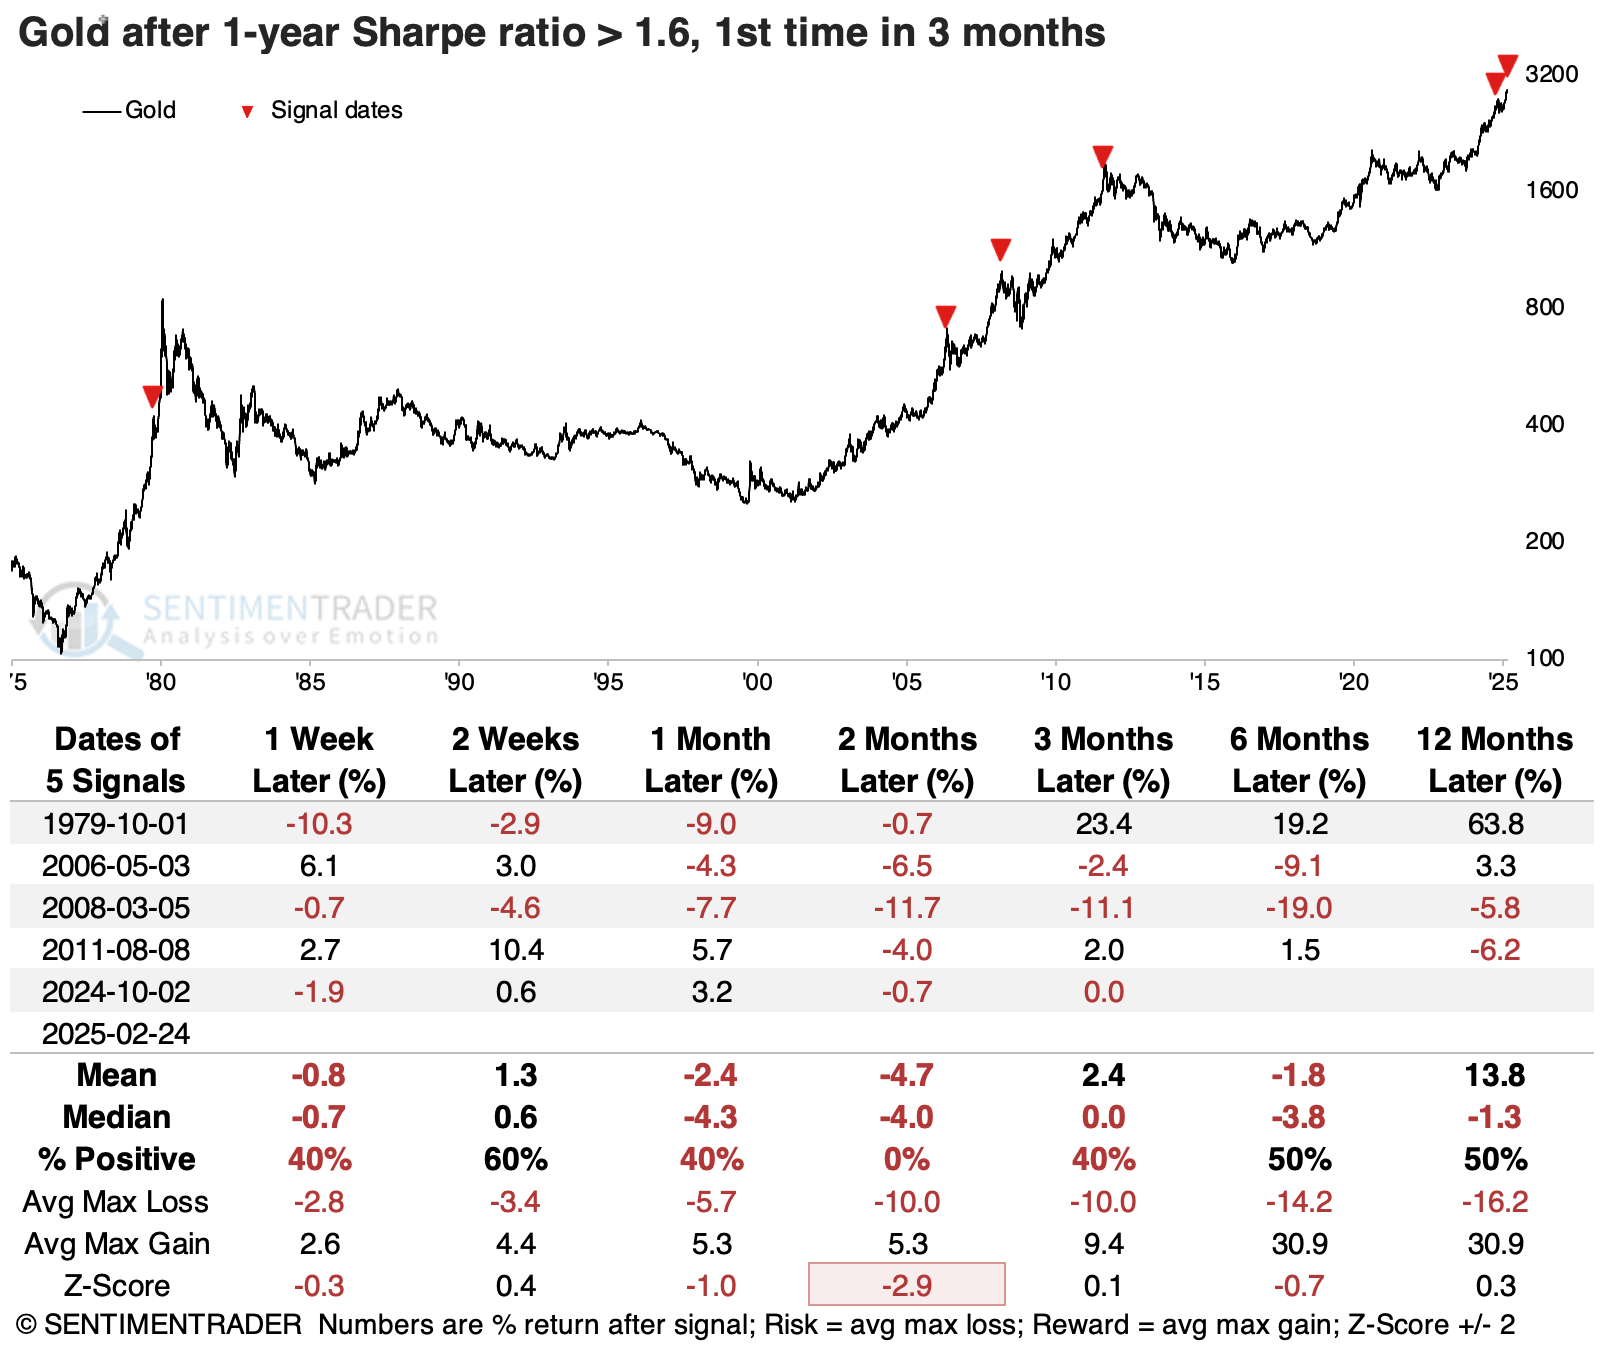
A table of maximum gains and losses across time frames shows some upside left in gold's rally once the Sharpe ratio first exceeded 1.6, but over the next two to three months, the upside wasn't very impressive relative to the risk from buying late in the rally.
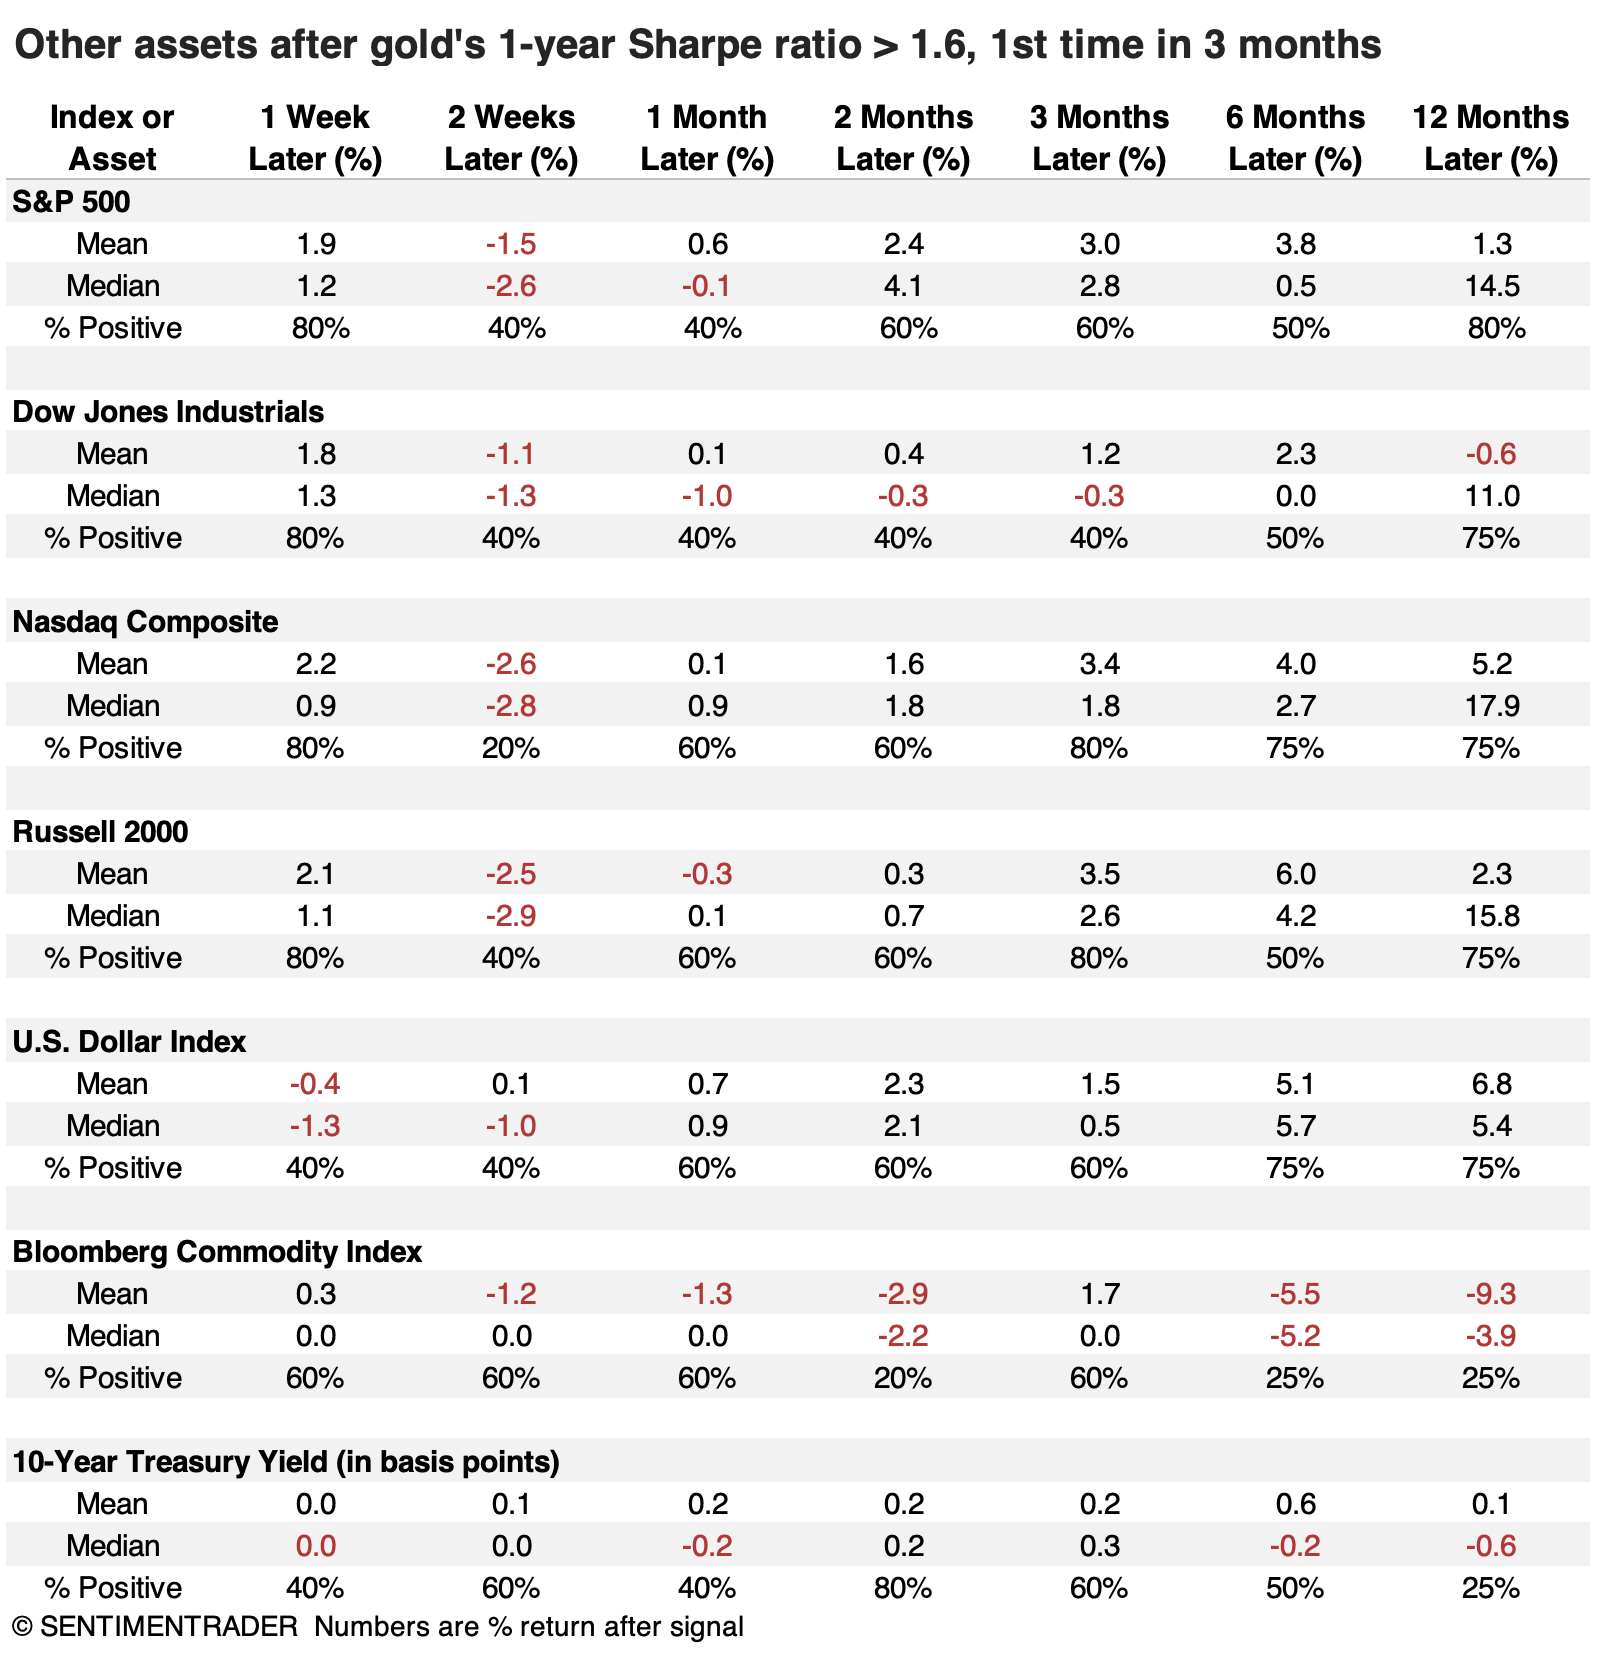
The major stock indices showed short-term weakness after gold's Sharpe ratio reached its current level, and their overall returns going forward weren't especially impressive. The dollar did okay and commodities did not. There was significant variability in the returns, one of the many problems with tiny sample sizes.
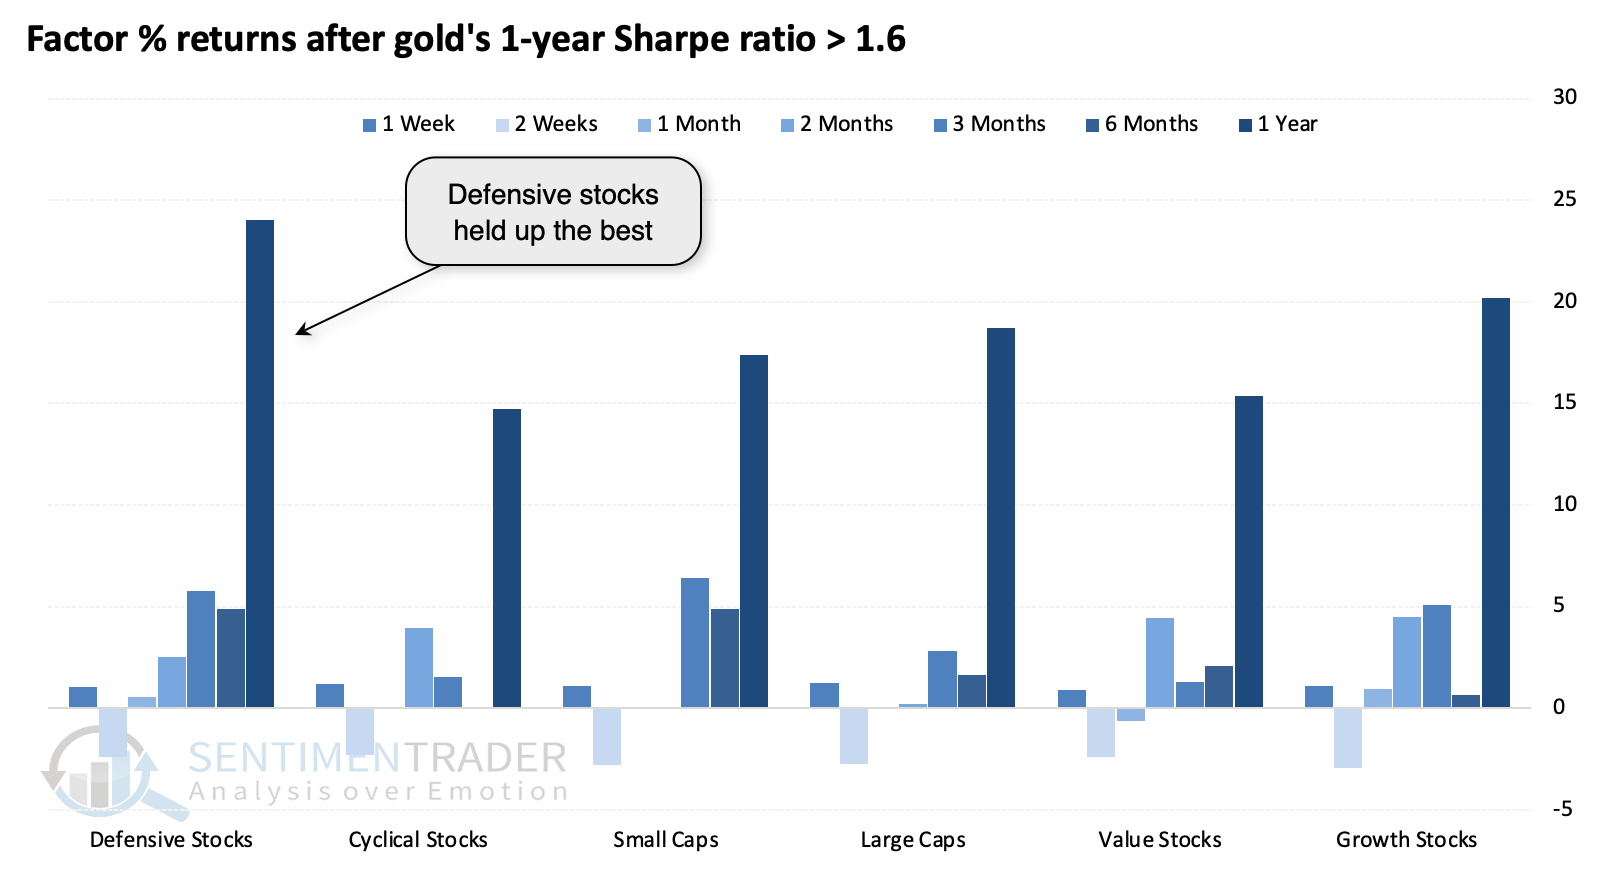
Among sectors and factors, there wasn't much outstanding about sector performance. But among factors, defensive stocks held up the best. They enjoyed a 100% win rate two and three months later, and returns were consistently among the best of any factor.
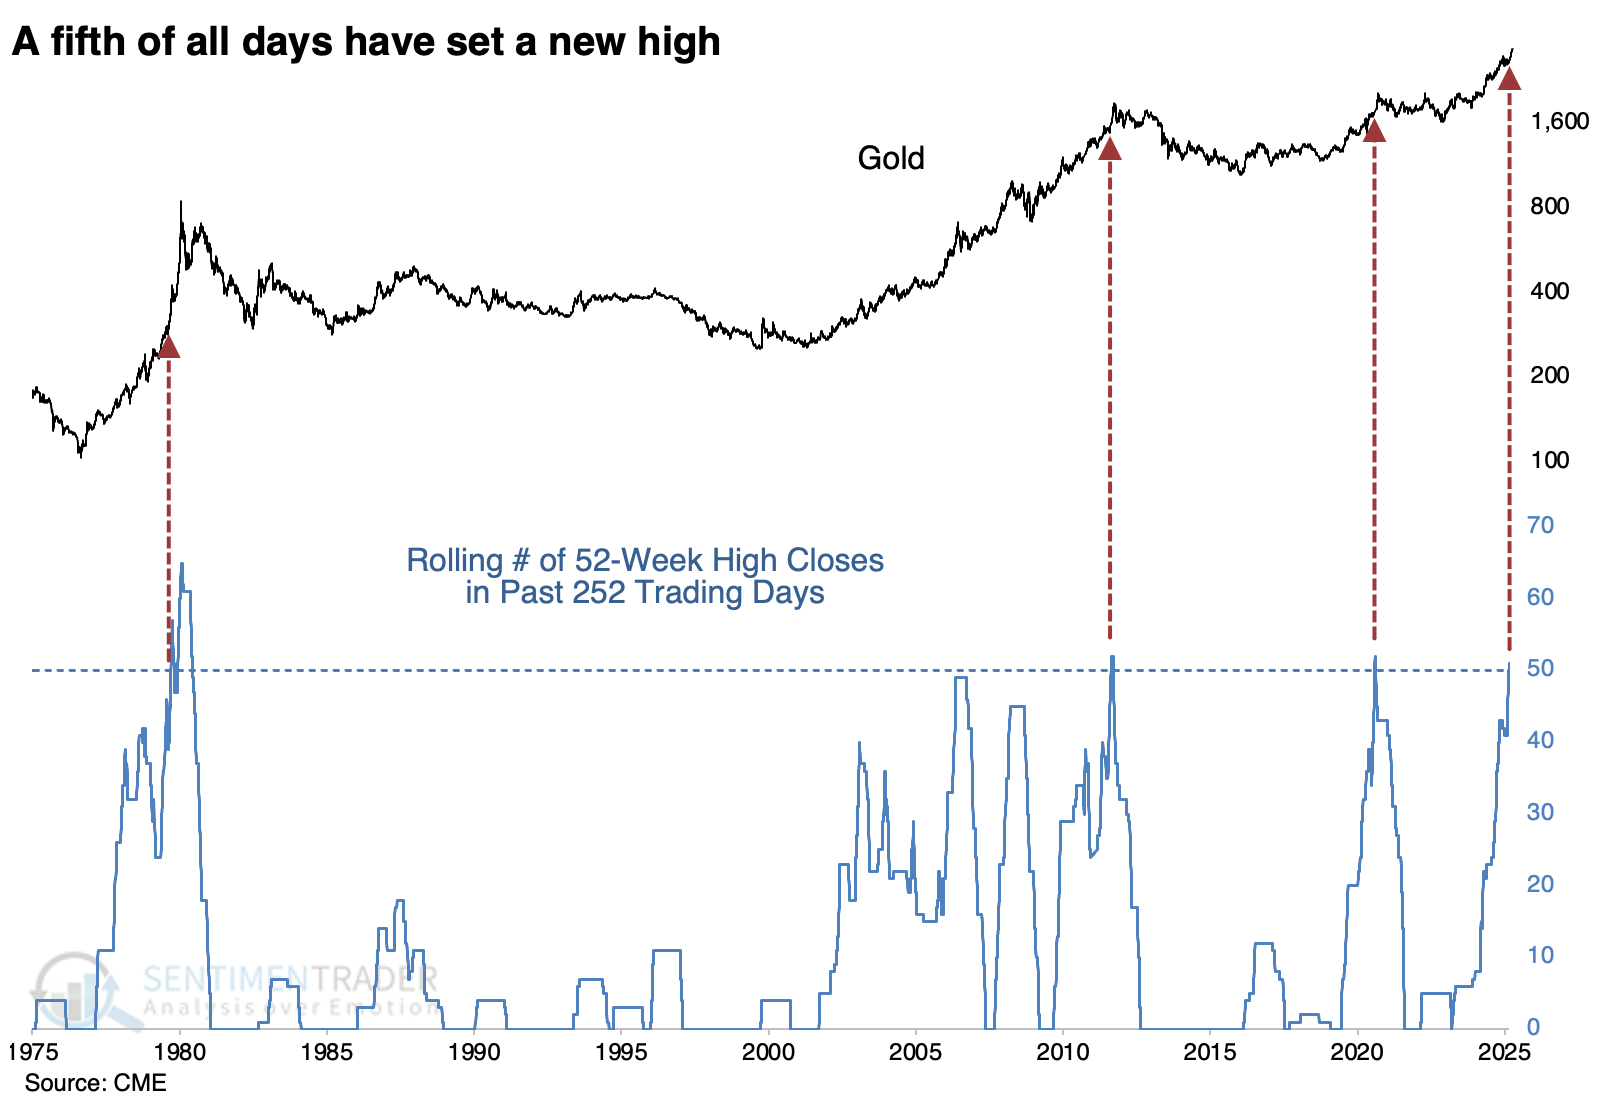
Traders jump in as new highs pile up
Other notable aspects of gold's rally include that a fifth of all trading days over the past year have seen the metal close at a new high. This ranks among the very best periods in 50 years, and the three comparable periods saw years of digestion.
Traders seem to be jumping on board. Over the past five sessions, an average of more than $800 million per day has flowed into GLD, the largest inflow since inception.
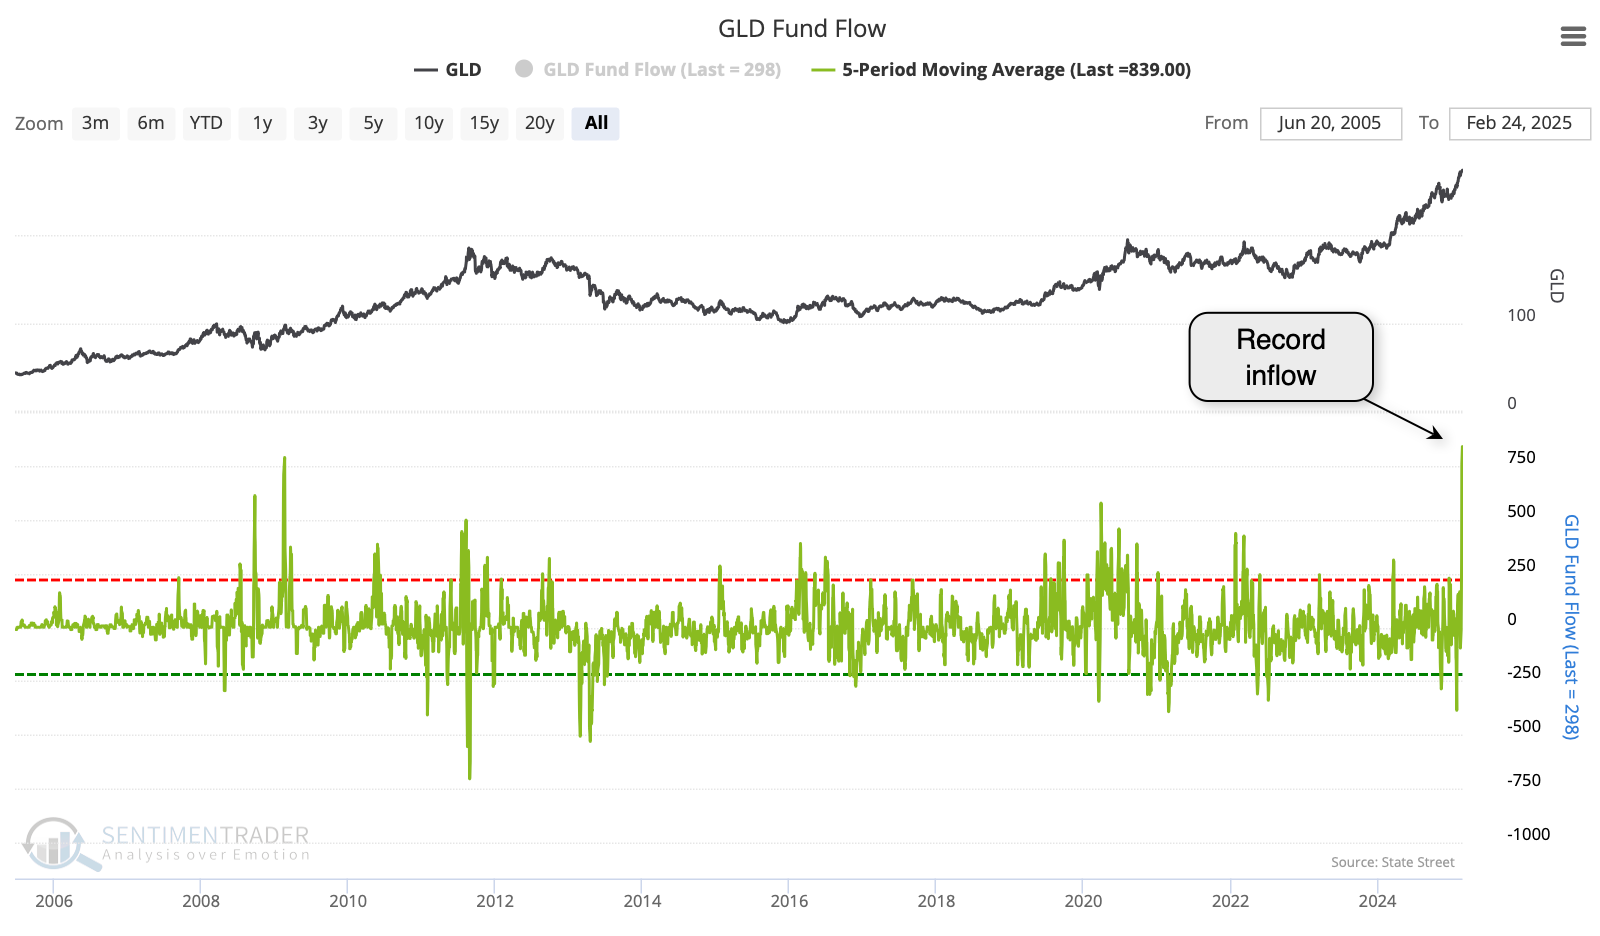
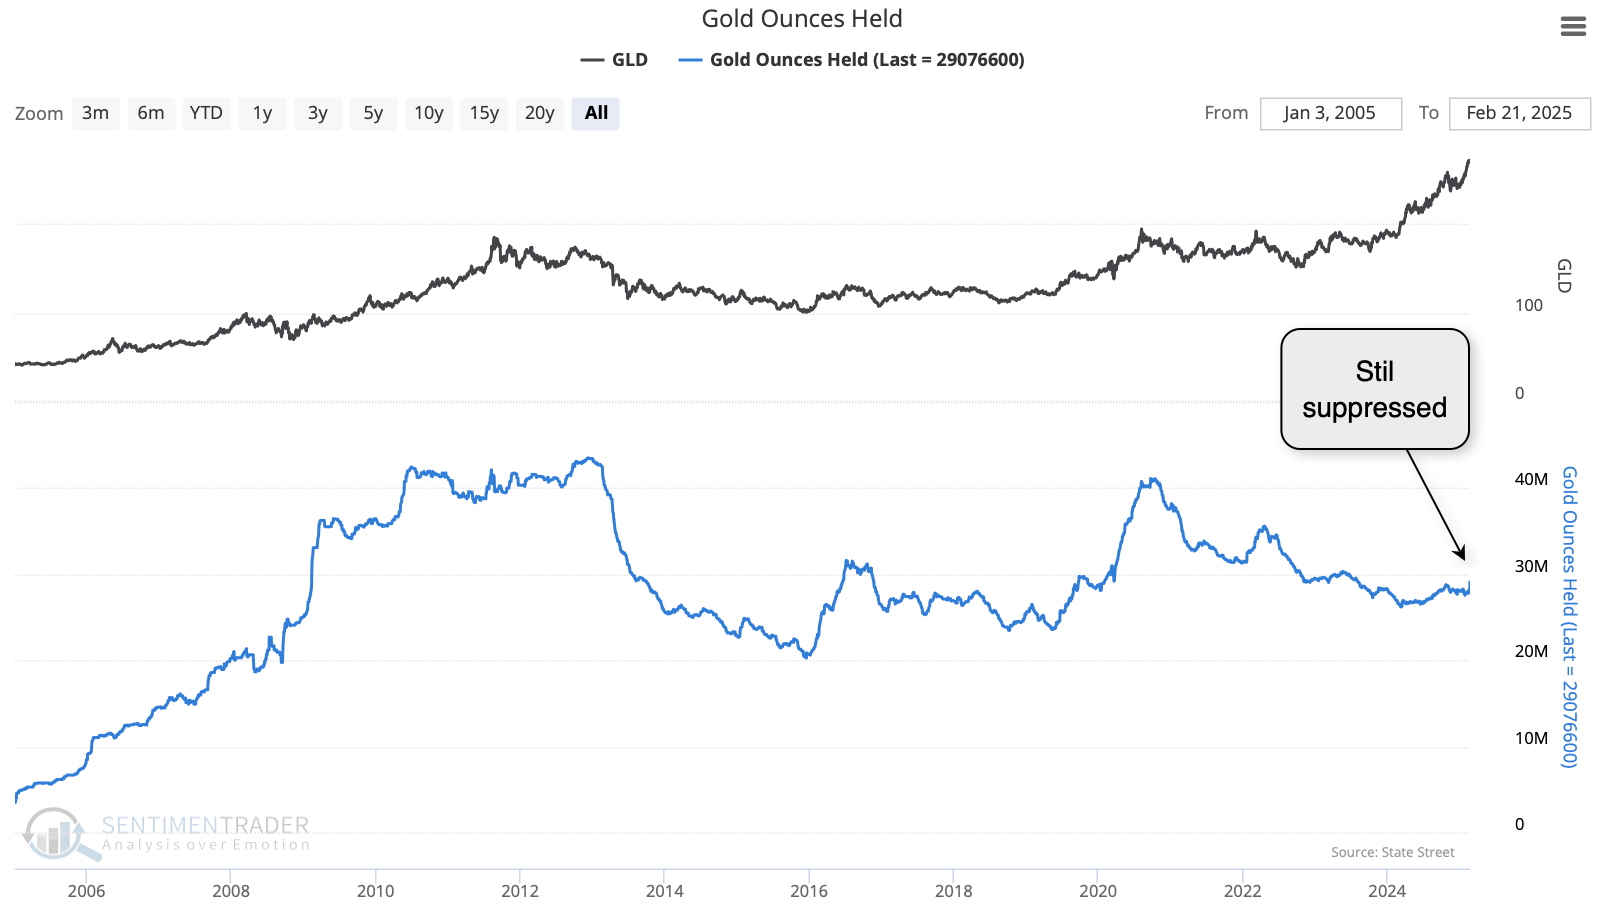
This surge has caused the assets under management in gold ETFs to rise, but it's still relatively low. This is one of the few indicators suggesting investors haven't fully embraced the rally.
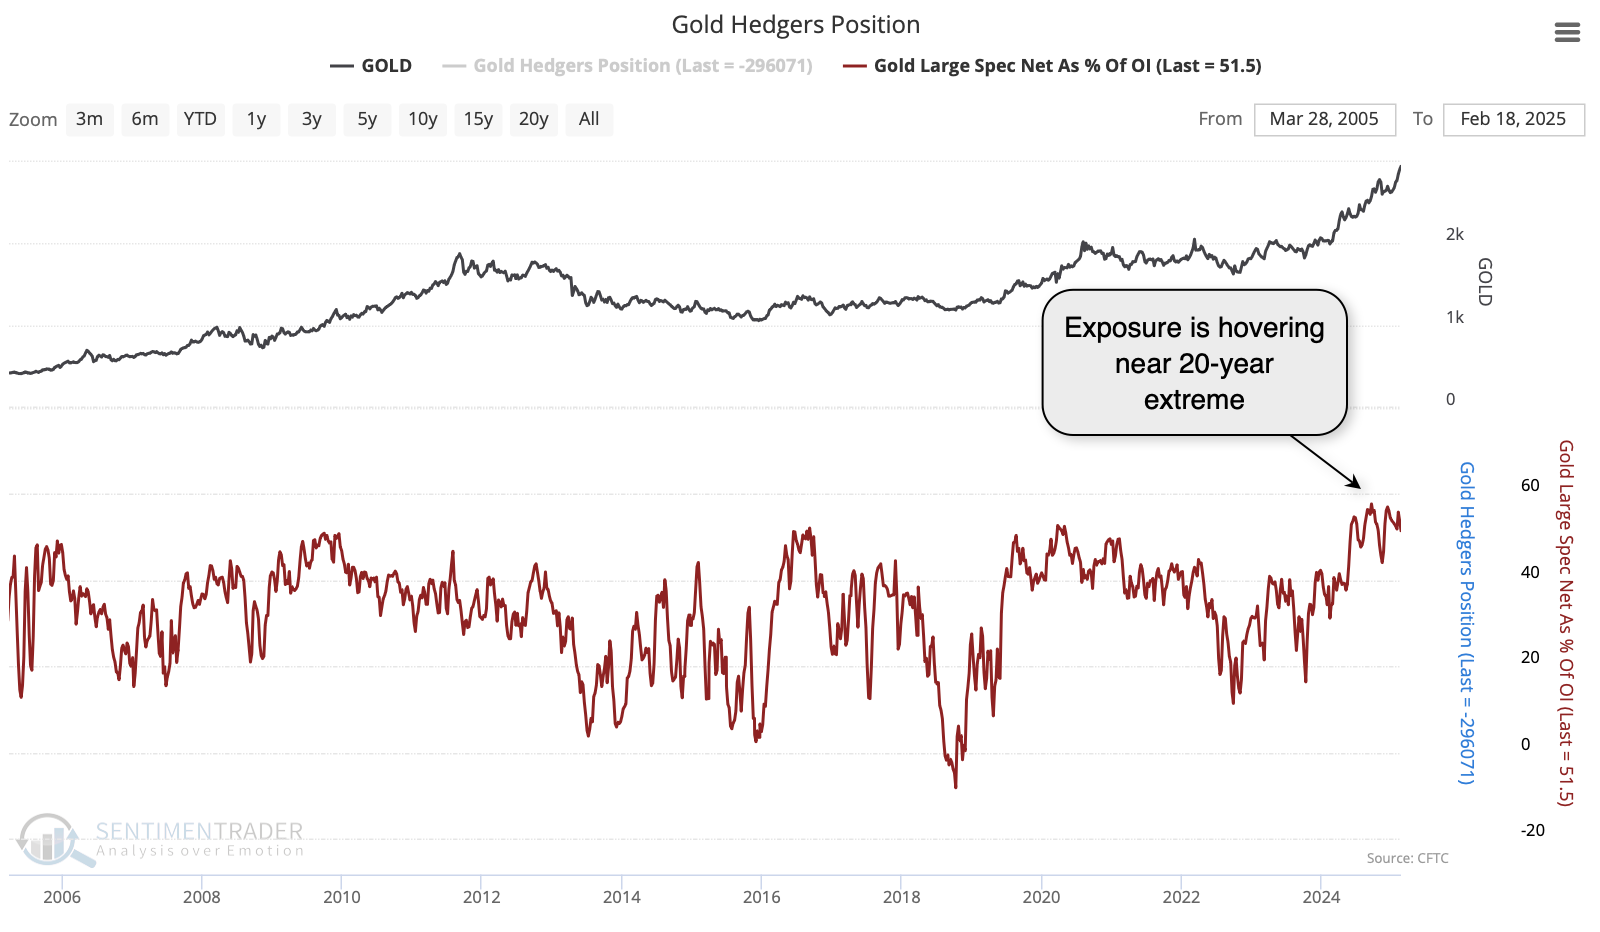
Speculators in gold futures are holding a near-record number of net long contracts as a percentage of open interest.
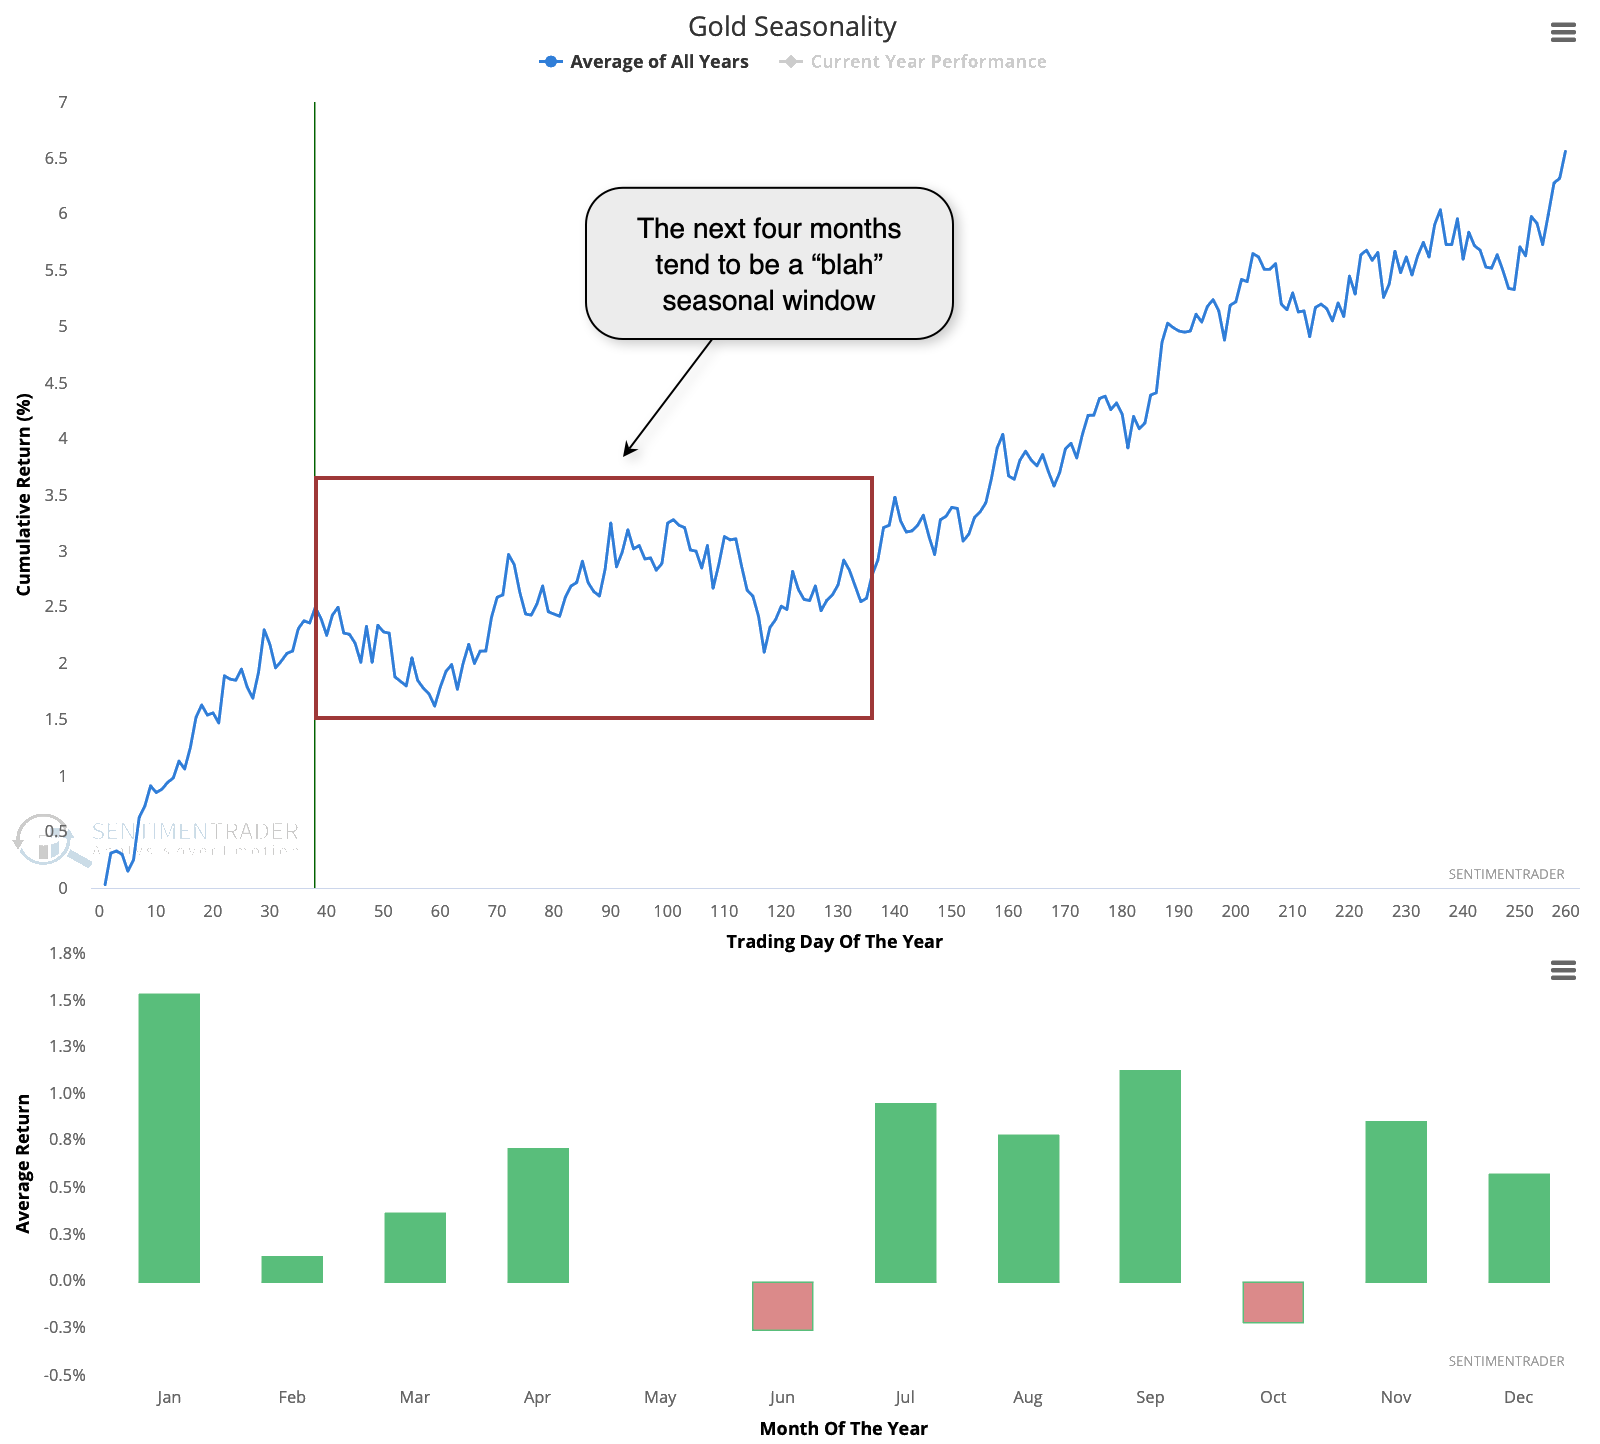
Seasonally, gold has tended to form at least a short-term peak right around now and generally didn't make much progress over the next four months.
What the research tells us...
It's been an exceptional year for many investors, with most major assets rallying, even including some of those like gold that are often held only as a buffer against possible losses. The rally in gold over the past year has been so substantial, with such limited volatility, that its "easiness" ranks among the best in 50 years.
As most of us know by now, when a market has been so easy, it tends to get tougher. That has been the case for gold, as its future returns have been somewhere between muted and horrid after periods like this. The only exception was the inflation panic in 1979 when it went on one more breathtaking run before a 20-year hibernation.
Traders have been jumping on the bandwagon lately, just as the metal has tended to see a seasonal soft spot. These are warning signs for those who have missed the rally and are looking to finally add some exposure.