
Gold's historic run of new highs suggests more upside

Key points:
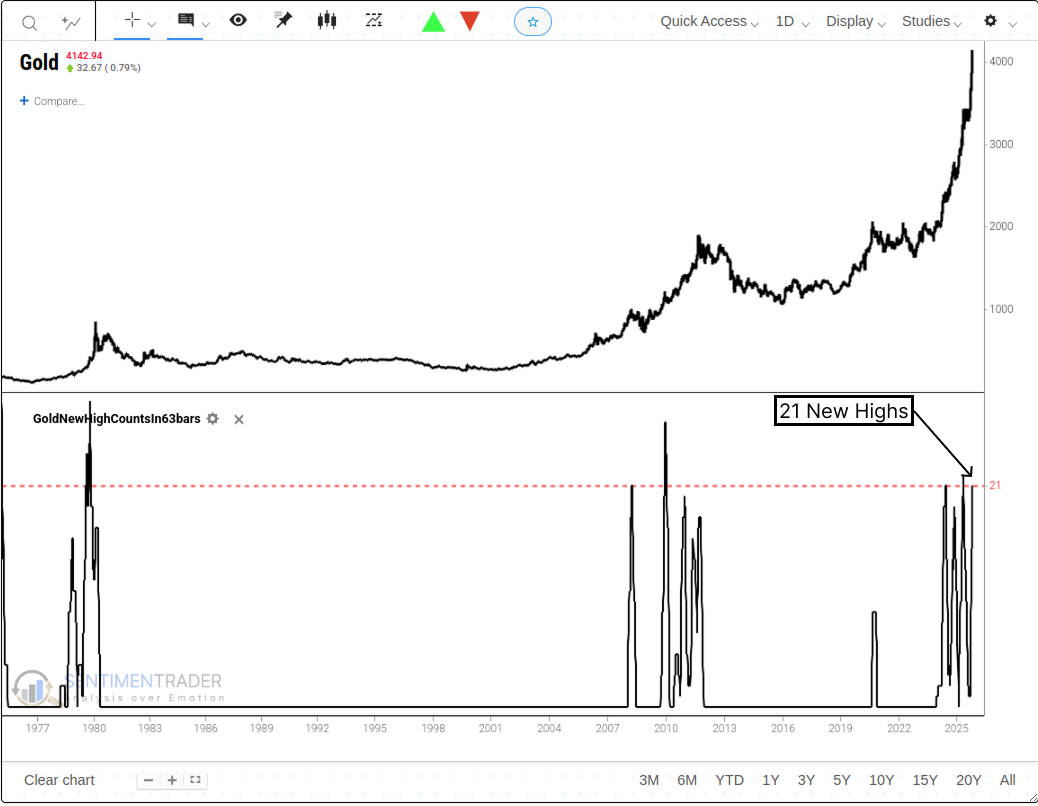
- Gold has closed at a new all-time high 21 times over the last 63 trading sessions.
- Similar bursts of new highs saw Gold futures show a median loss of -4.1% over the next month, with a win rate of only 16%.
- A year later, Gold futures rallied 80% of the time, and the S&P 500 also rallied 80% of the time.
The case for a sustained uptrend in Gold gains further credence
Recent research has highlighted the persistent strength in Gold, noting its impressive run of new highs over the past year. The conclusion was that the precious metal had more upside potential.
Although we'll only know in hindsight whether Gold is in a secular or cyclical uptrend, the case for a sustained advance gained further credence now that the precious metal has closed at a new all-time high an extraordinary 21 times over the past 63 sessions. As the chart shows, such a concentrated number of new highs is exceptionally rare, with precedents seen only during some of Gold's most powerful historical advances.
Comparable bursts of momentum preceded a challenging short-term outlook
While the sample size is small, whenever Gold futures have set this many new highs in a three-month period, the precious metal has shown a clear tendency to consolidate or correct. The performance one month after a signal has been remarkably poor, with a median return of -4.1% and a win rate of only 16%.
However, the long-term outlook appears much more favorable. One year later, Gold was higher 80% of the time with a powerful median return of +33.4%, suggesting the initial weakness has historically been a pause that refreshes the uptrend.
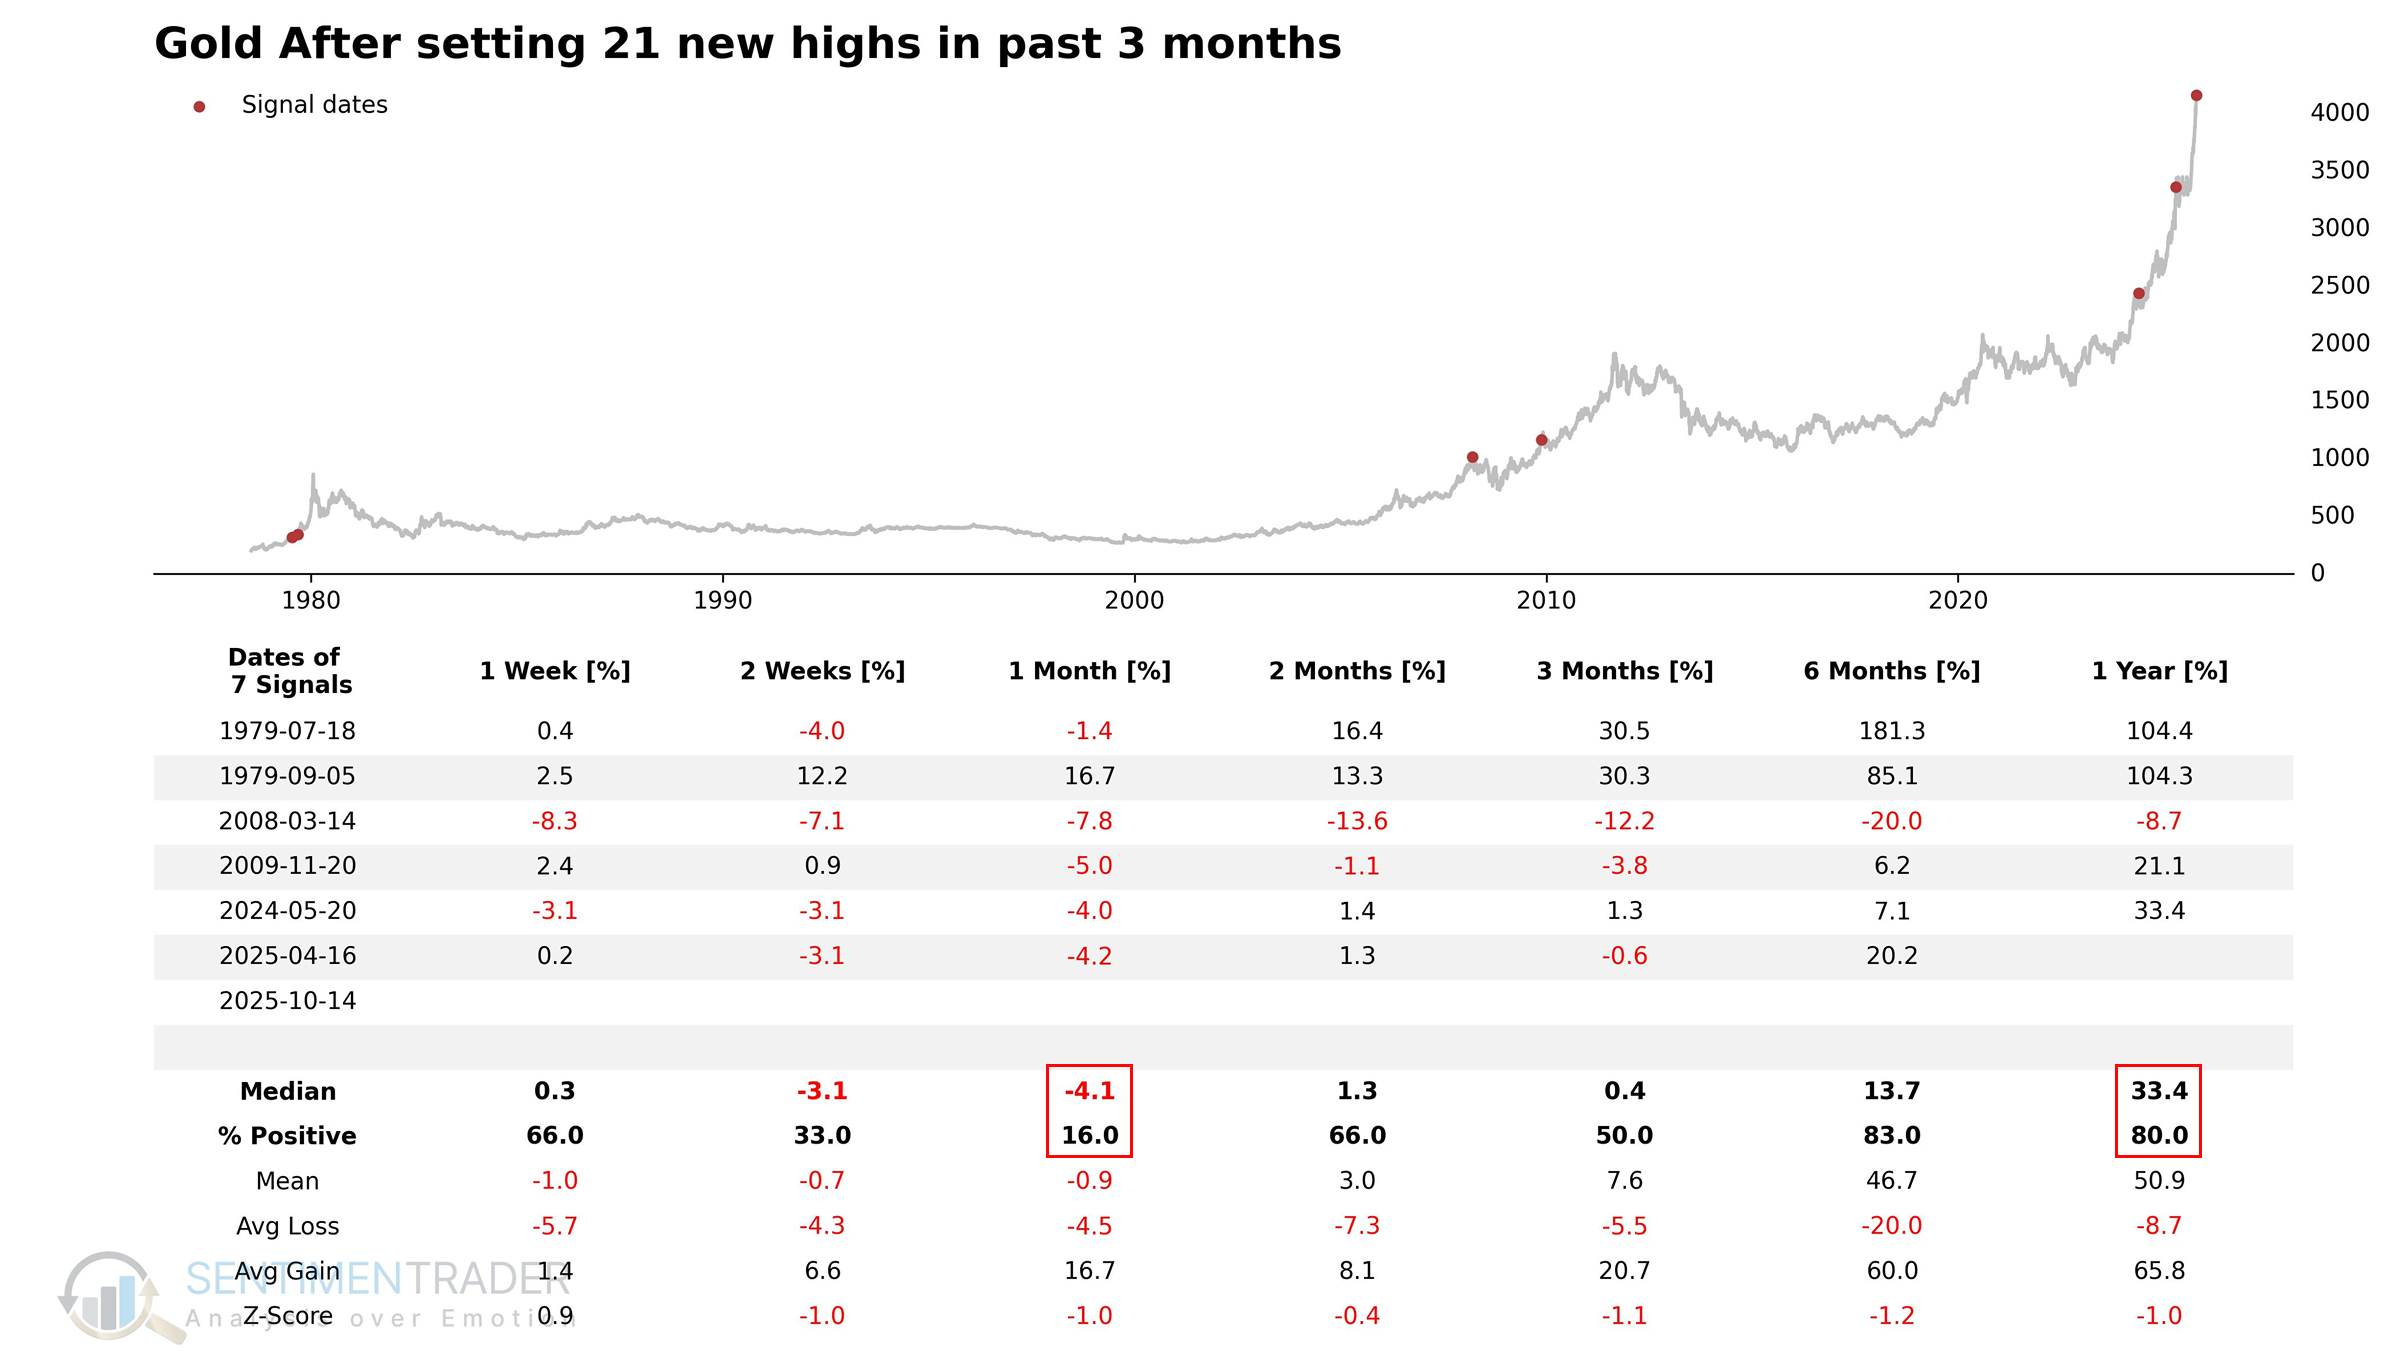
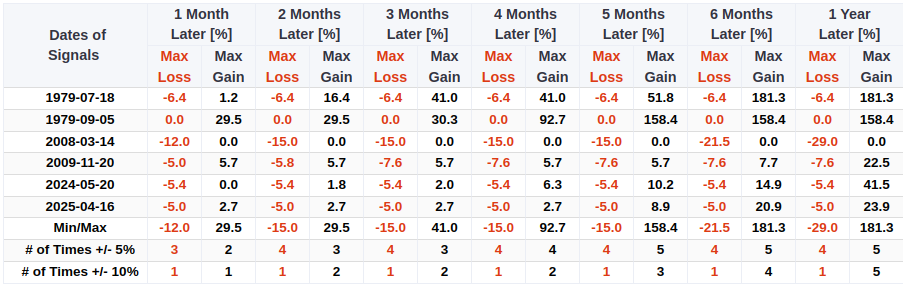
Over the subsequent twelve months, Gold futures experienced just one instance of a maximum loss exceeding -10%. The signal from March 2008 saw a drawdown of -29.0%, a reminder of the potential for volatility in extreme macro environments.
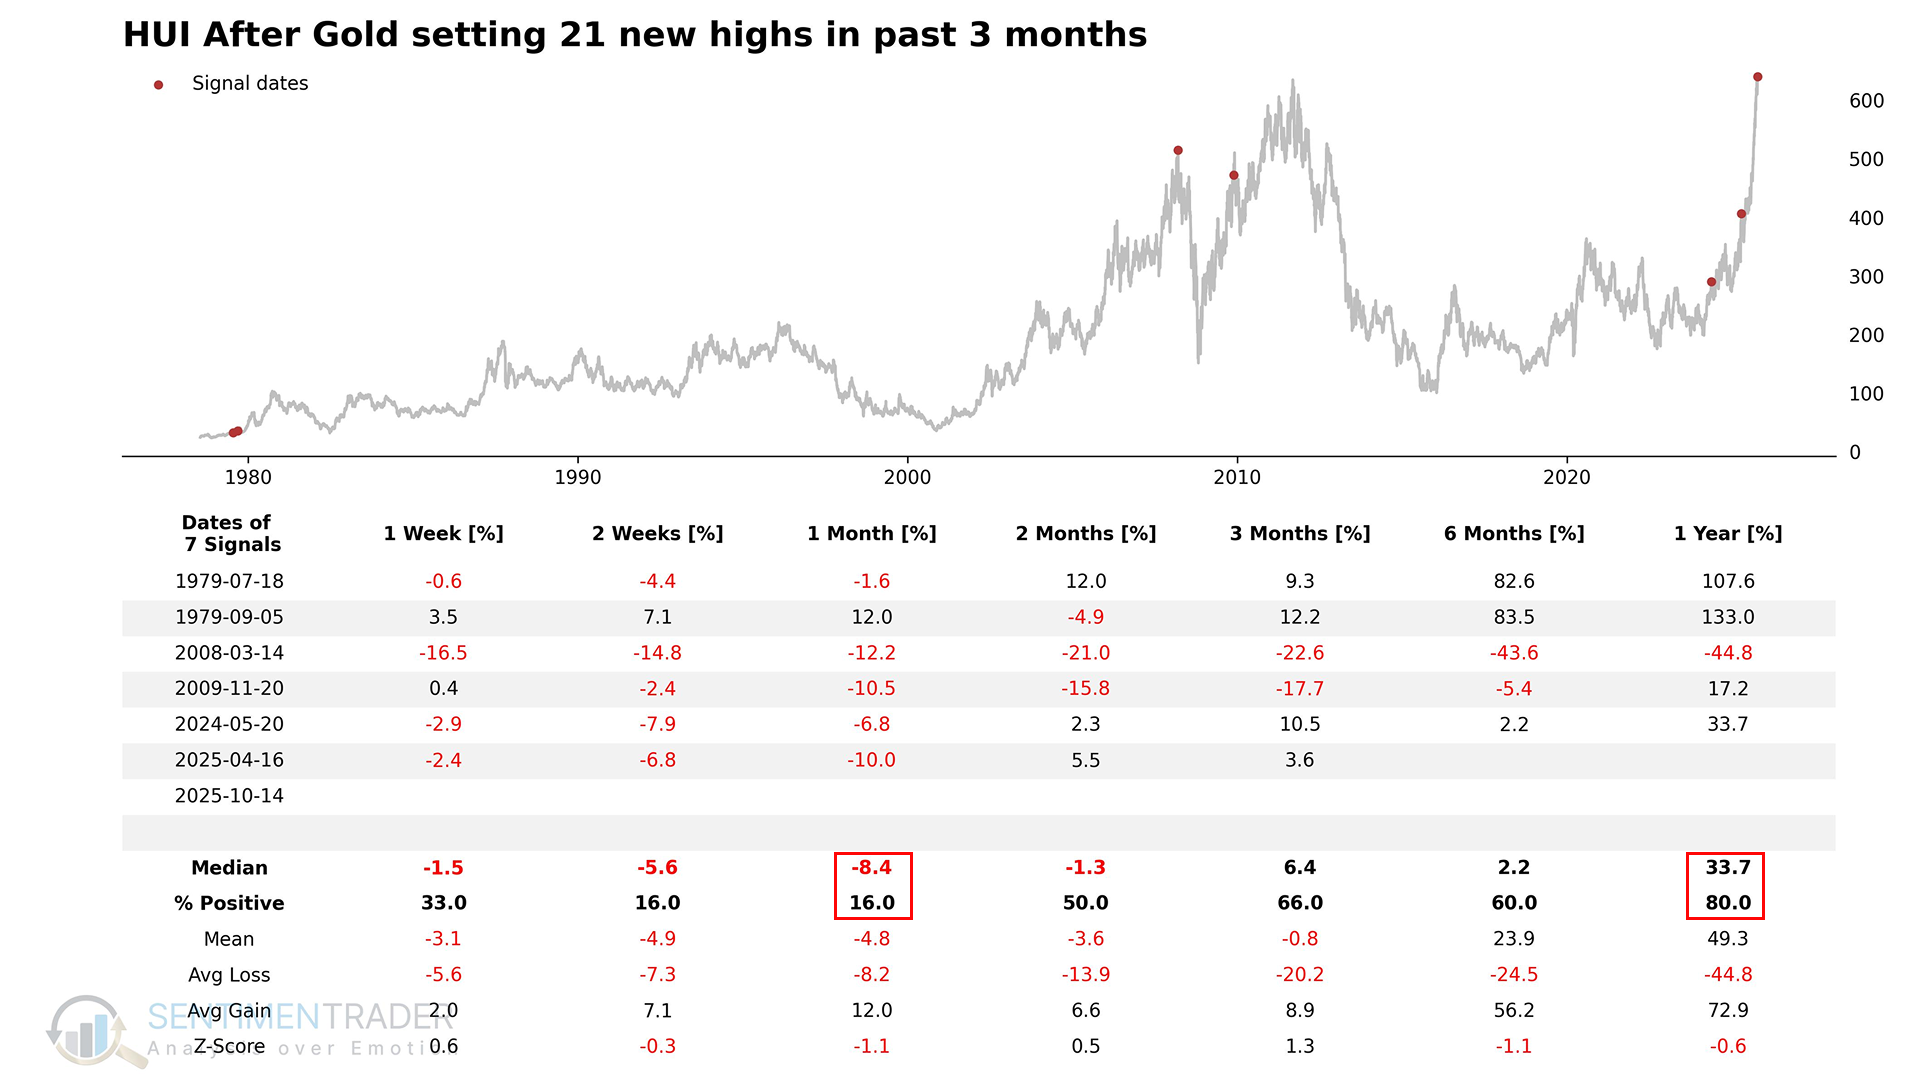
The Gold BUGS Index (HUI) tended to follow the precious metal's lead, but with amplified movements. The one-month median return was an even weaker -8.4%. However, a year later, the index rallied 80% of the time with a median return of +33.7%.
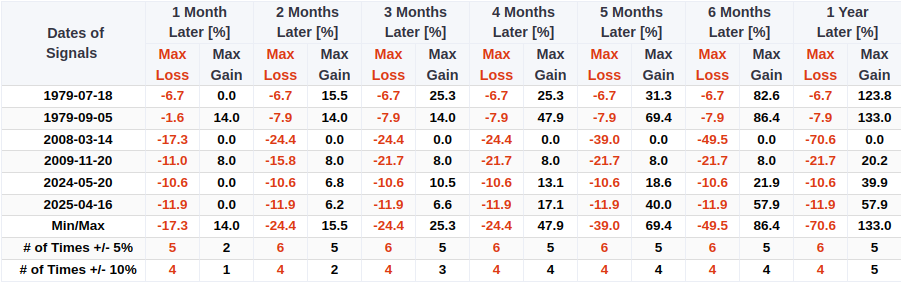
If you hold a position in gold miners or are thinking about one, remember that the upward trajectory could be volatile despite a bullish long-term outlook. In the one-year window, maximum losses of over -10% occurred in 4 out of 6 cases, with the 2008 signal seeing a staggering -70.6% drawdown.
How does Silver perform?
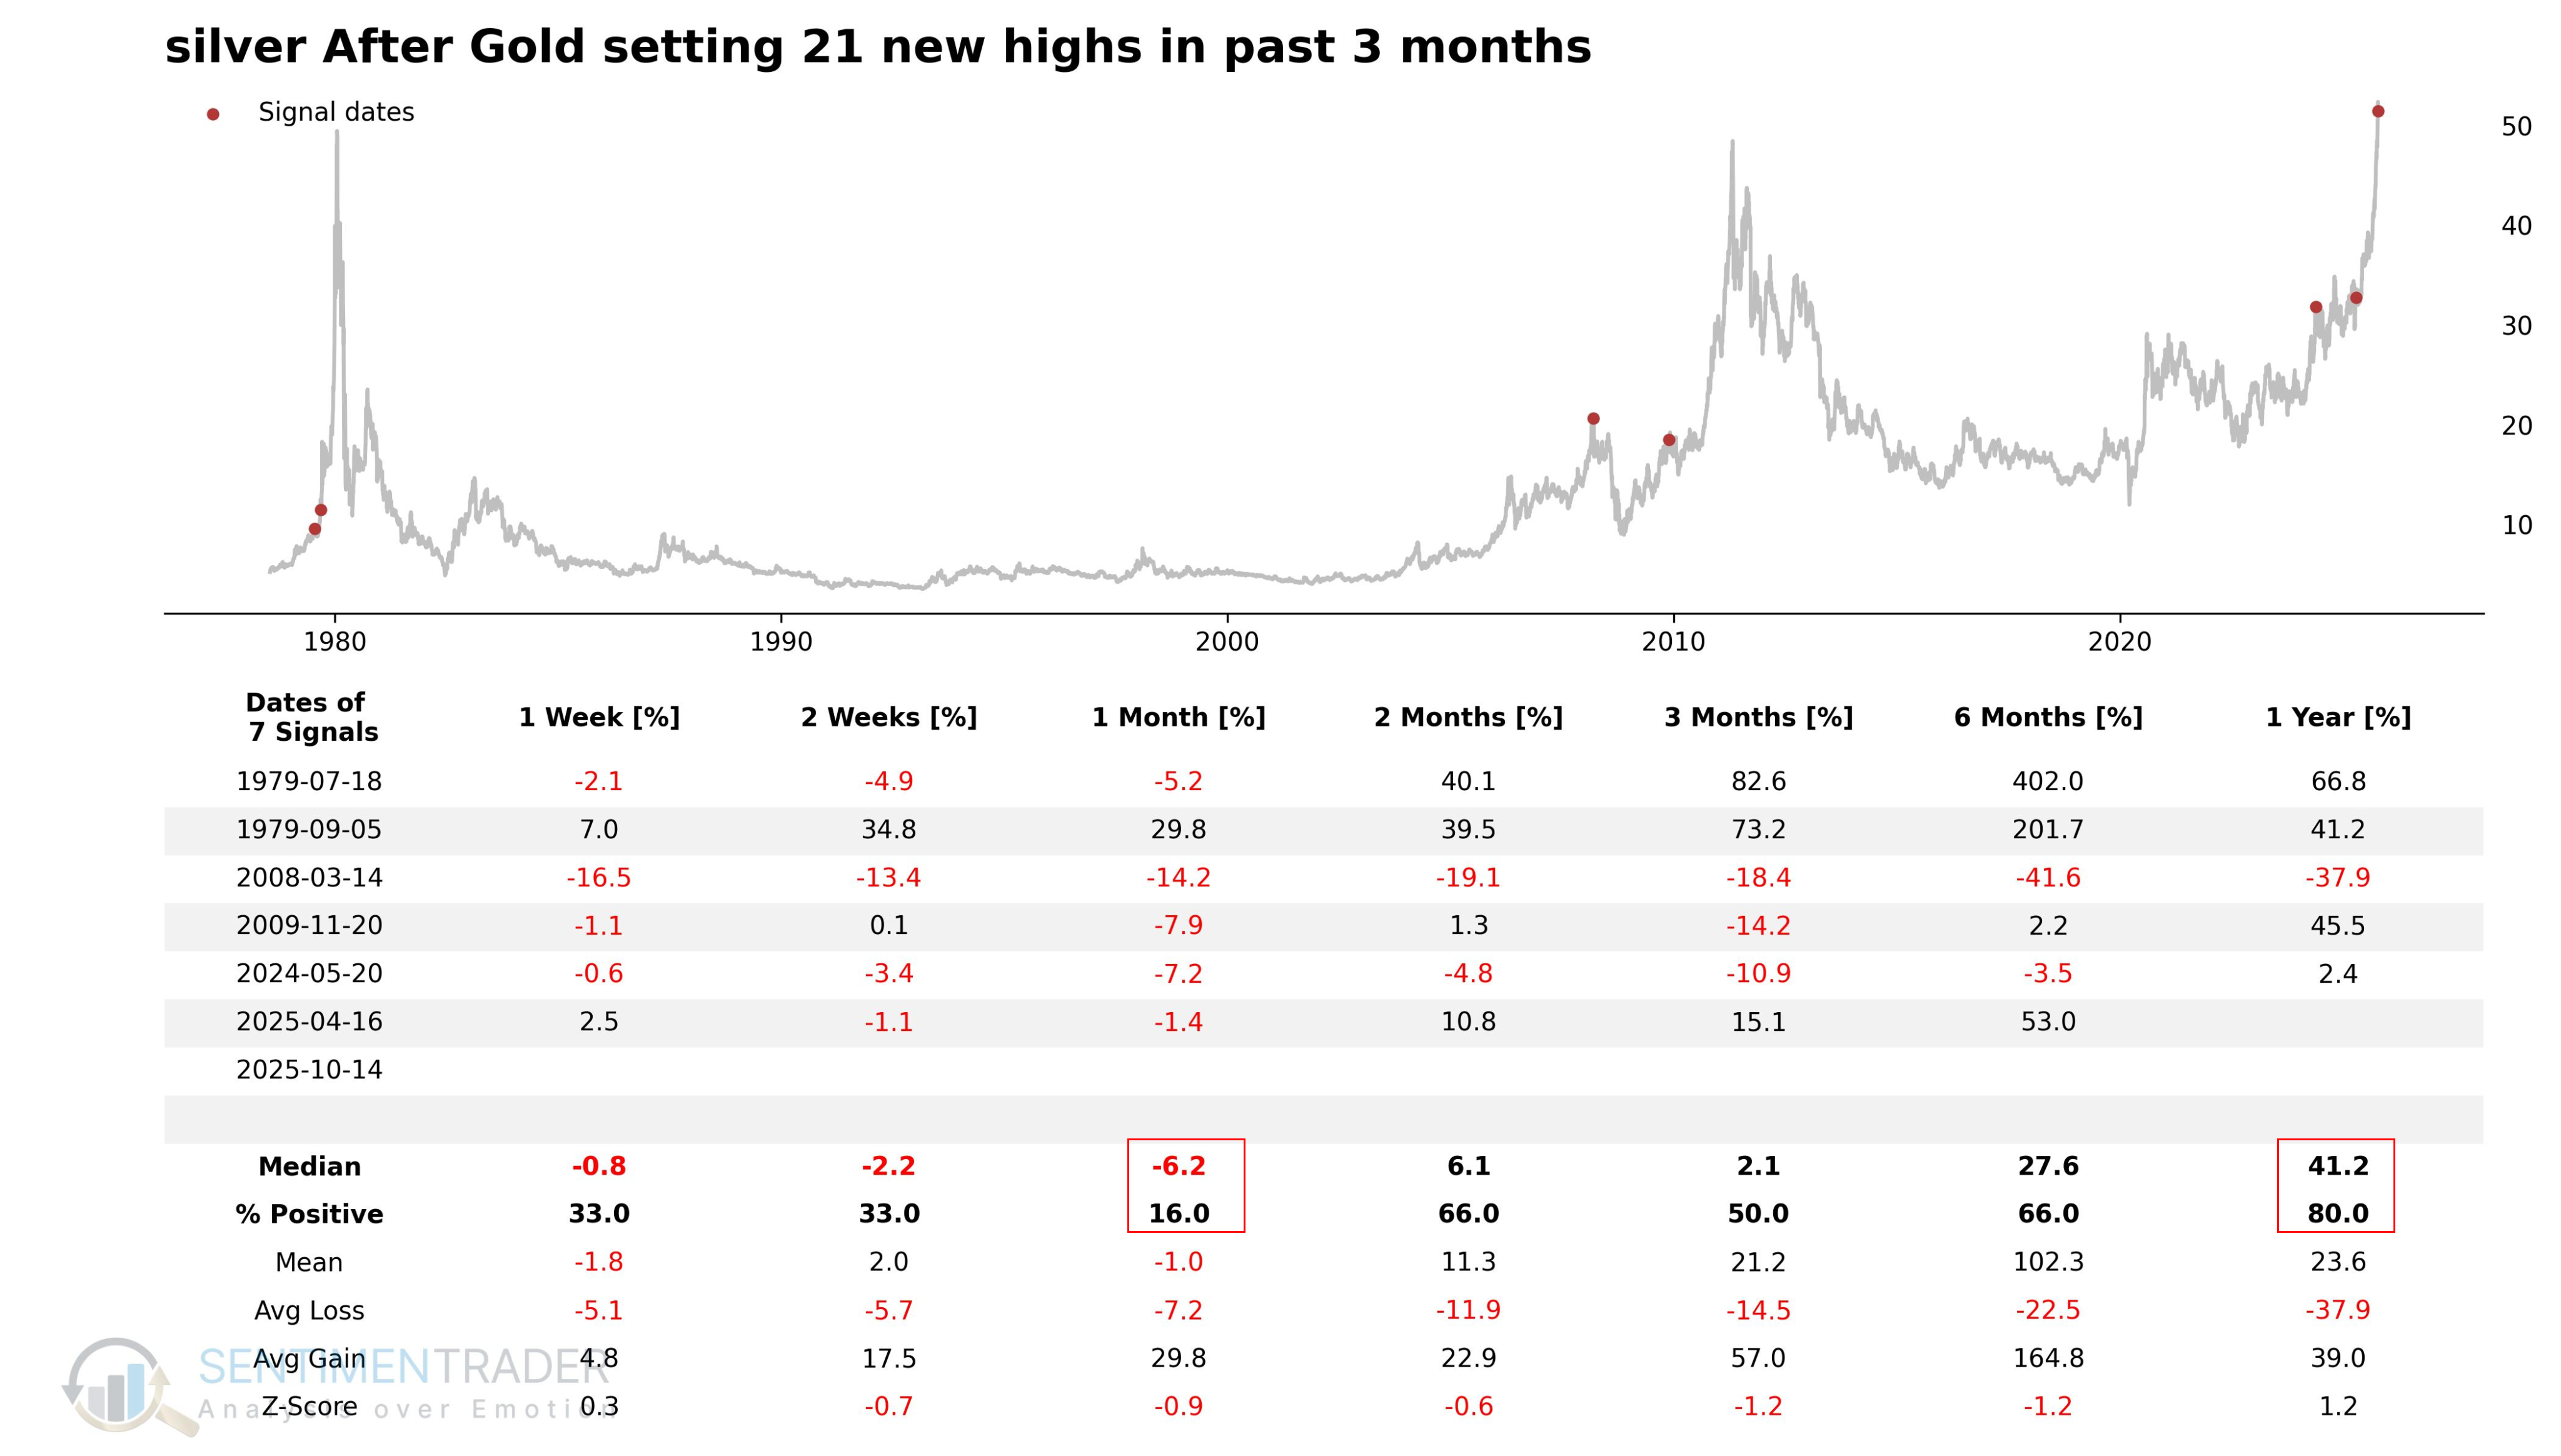
When Gold displays a persistent uptrend like now, Silver tends to tag along, though with its own volatile characteristics. It also showed pronounced weakness over the next month, with a median return of -6.2%. However, like gold miners, the path to higher prices was ultimately rewarding, with Silver rallying 80% of the time over the following year with a median gain of +41.2%.
What about stocks?
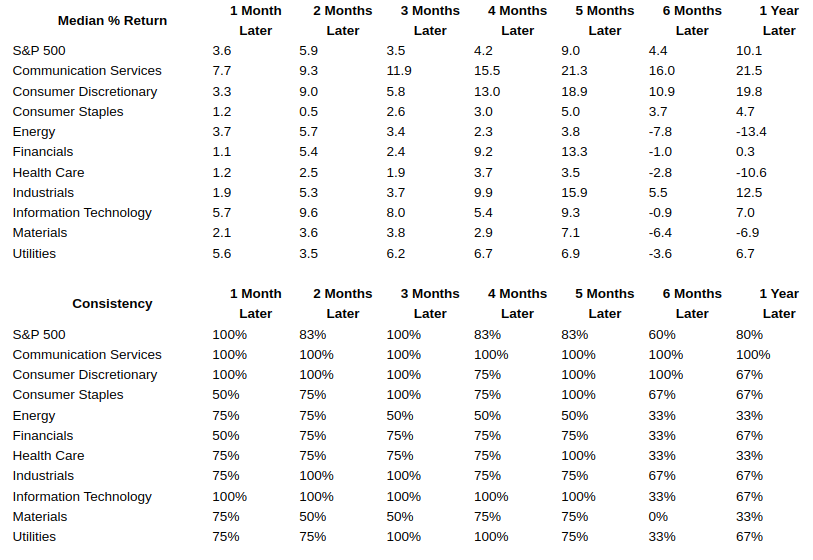
The S&P 500 and most sectors displayed an outlook that was the polar opposite of the precious metals complex. There was no short-term weakness. In fact, one month after the Gold signal, the S&P 500 rose 100% of the time with a median return of +3.6%. A year later, the world's most benchmarked index was higher 80% of the time. This suggests that the macro factor influencing Gold has not been a "risk-off" flight to safety, but rather something more consistent with a broad, reflationary environment that benefits multiple asset classes.
What the research tells us...
Gold has now closed at a new all-time high 21 times in the past three months, a rare display of momentum that indicates the rally in the precious metal has been powerful. Historically, after such periods of intense strength, Gold and its related assets have tended to experience a significant pullback over the next month before resuming their long-term uptrends. Interestingly, while the precious metals complex struggled in the short term, the S&P 500 and its sectors showed immediate and consistent strength. This suggests the environment has been broadly supportive of risk assets, not just a flight to the safety of Gold.