
Gold's historic run of new highs

Key points:
- Gold has set 37 new highs in the past year, one of the best runs in 50 years
- After it has reached this many new highs, gold typically rallied for weeks more before peaking
- Sustained runs in gold were not a consistent caution sign for stocks, as the S&P 500 (and energy stocks) tended to do well
A historic run of new highs
Despite a jump on renewed geopolitical tensions, gold didn't quite make it to another record high on Tuesday. Even so, it remains oh-so-close and on the cusp of adding to its 37 new highs in the past year, similar to a stretch in early 2020.
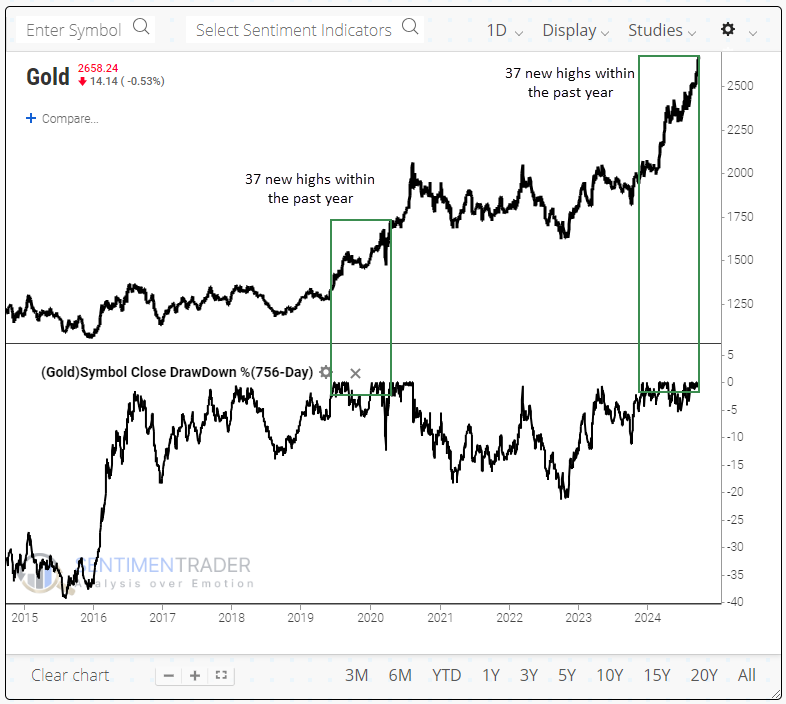
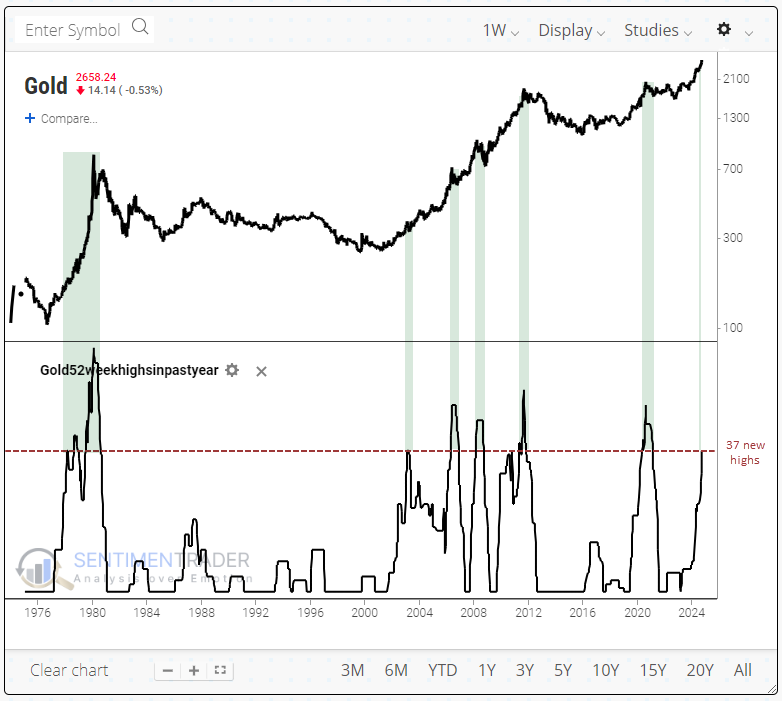
A rolling one-year total of 37 new 52-week highs is impressive. During the past 50 years, there haven't been many streaks like this, with most of them confined to the great bull runs of the late 1970s and early 2000s.
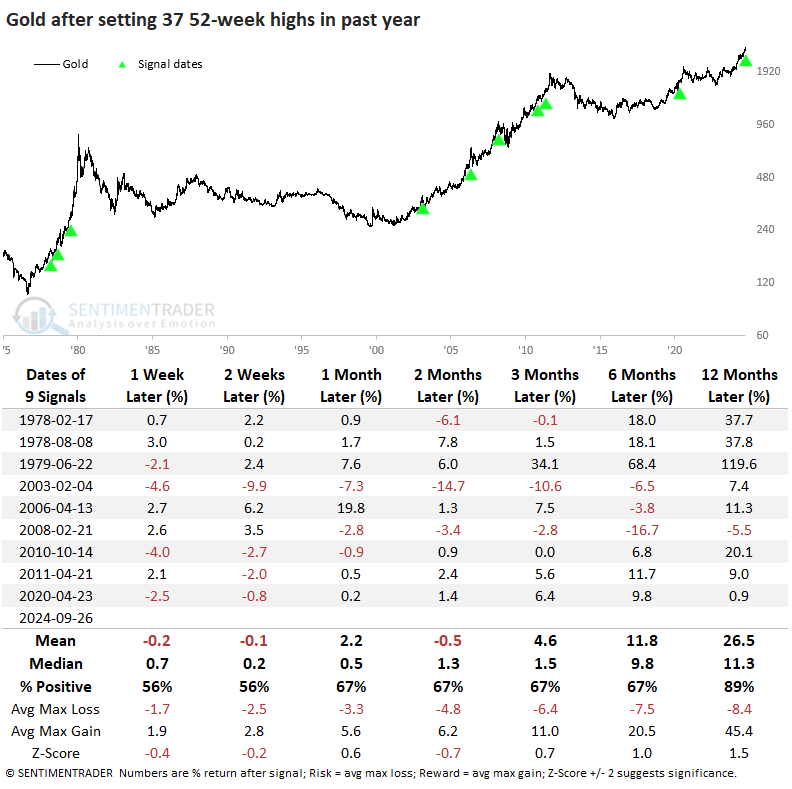
It's hard to tell from the chart, but by the time gold reached 37 new highs in a year, it was at or near a peak a couple of times, leading to double-digit drawdowns. As seen in the table below, that was more of an exception than a rule. It shows gold's returns once it reached its 37th 52-week high over a rolling 252-day period.
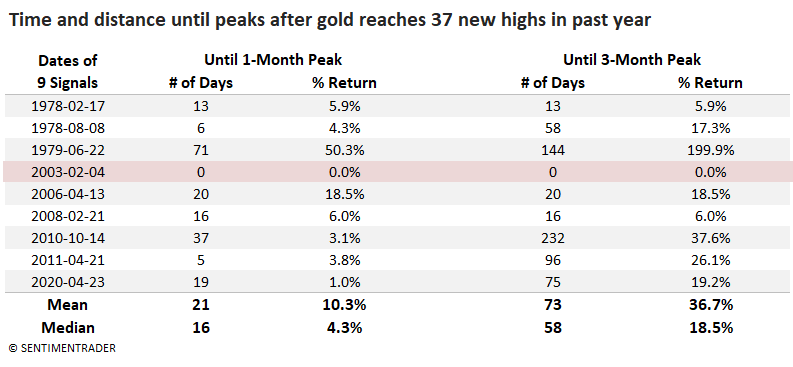
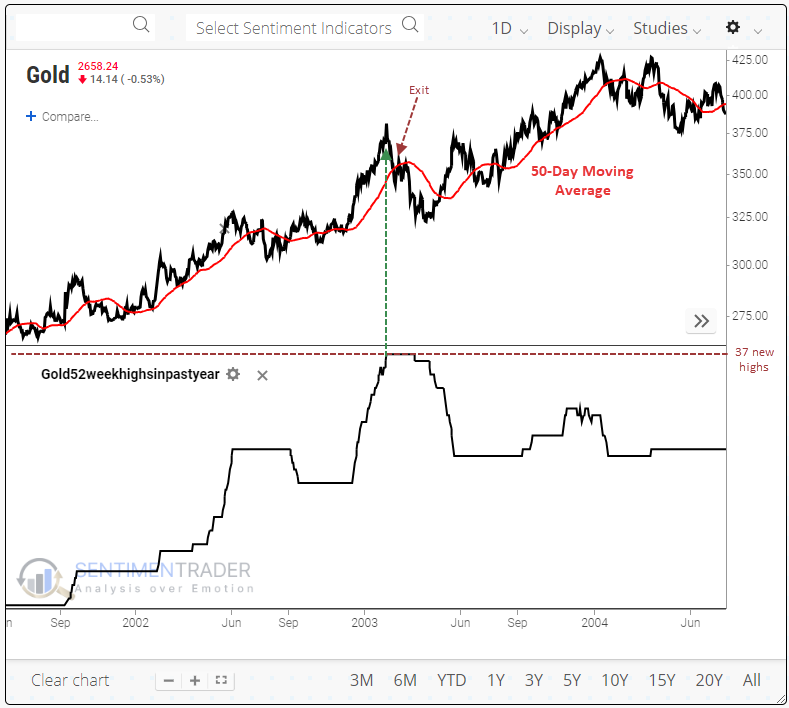
The only signal that coincided with a meaningful peak was in February 2003. The table below shows how long it took and how much gold rallied before it carved out a 1-month and a 3-month peak.
We can see that gold rallied a median of 16 days and an additional +4.3% before it reached a one-month peak, meaning the highest price in the one month before and after that price. Most of those were temporary peaks, however. It took gold a median of 58 trading days and a further +18.5 % gain before it reached a more meaningful three-month peak.
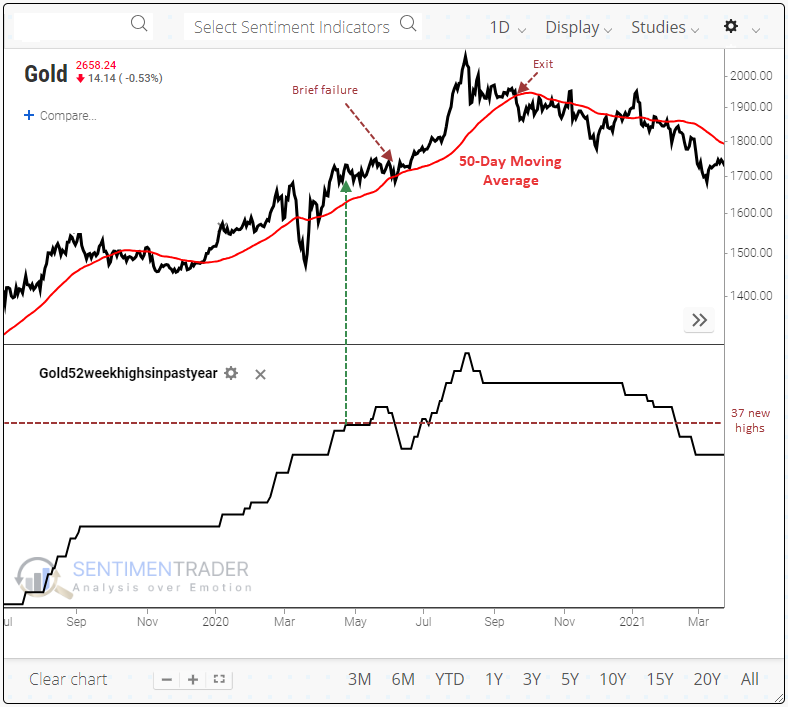
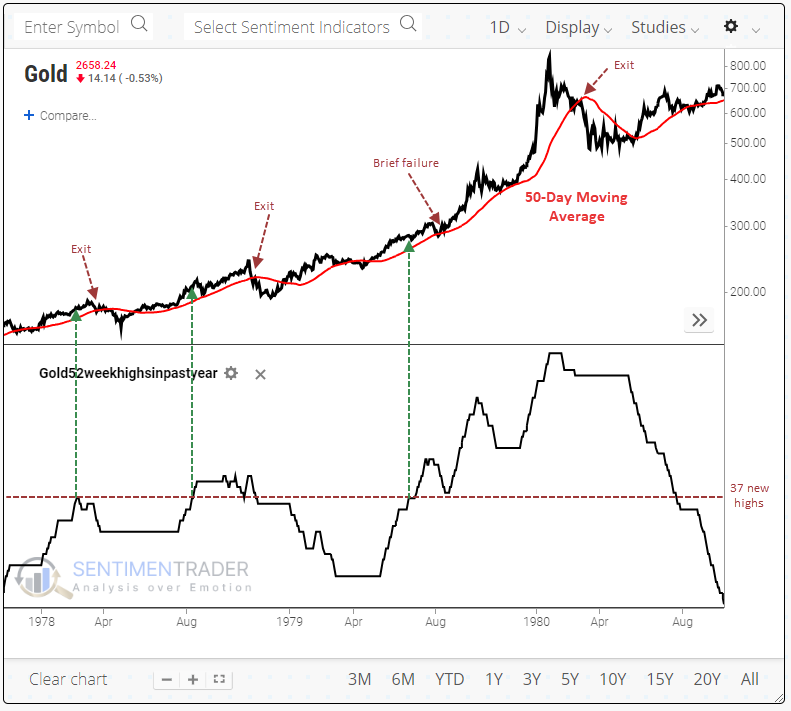
While the 2003 instance is troubling, the overall suggestion for gold investors is that there should be more gas in the tank before a substantial pullback. There are an innumerable number of trend-following systems to help determine when that exit signal might occur, but using a simple 50-day moving average proved to be an okay heads-up that the momentum had run its course.
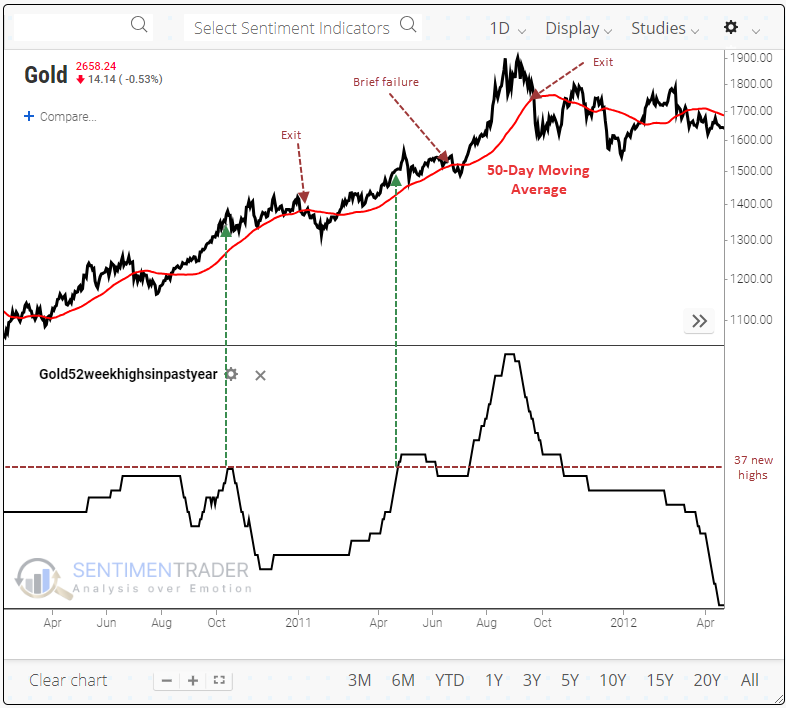
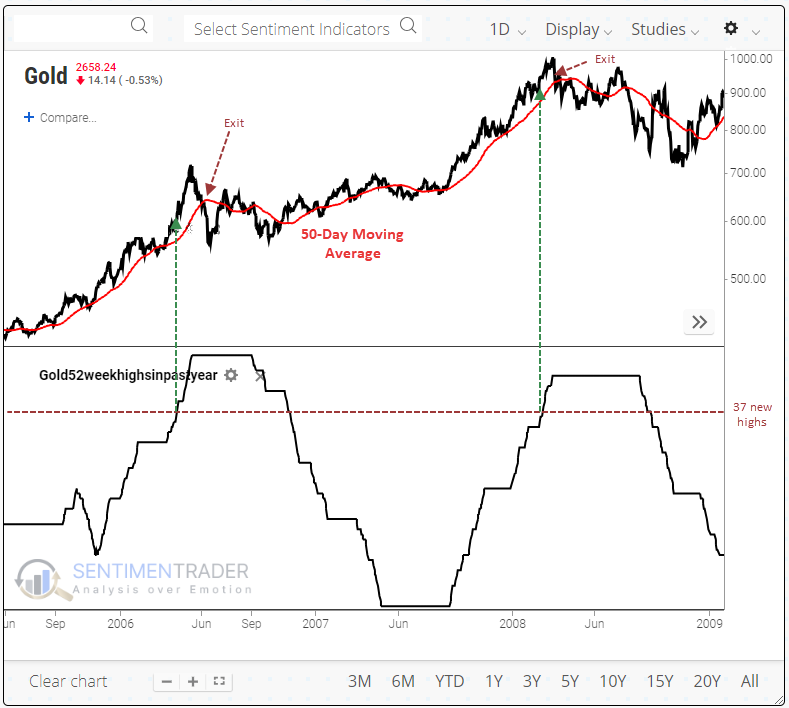
The charts below show each of the signals in the table above, with the green vertical arrow highlighting the 37th new high in the past year. The "exit" tag shows a sustained violation of gold's 50-day moving average. Three of the signals witnessed a violation of the 50-day that was only brief and minor, so requiring more than a 1% drop below the 50-day or multiple days below the average would have helped avoid those fakeouts.
How about stocks?
A soaring gold market always unnerves equity investors. We usually hear theories that "gold knows something," which makes people nervous about their stocks.
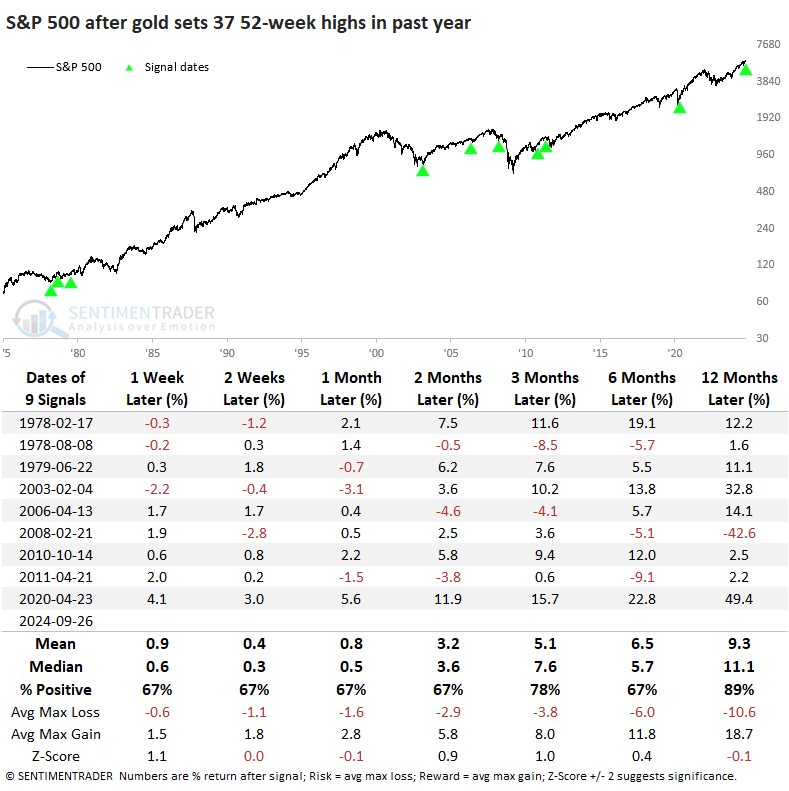
There didn't seem to be much to that theory. The table below shows returns in the S&P 500 after those gold signals, and for the most part, it held up just fine. The S&P lost more than -10% within the next six months only twice (and one of those was *just barely*). The only signal that proved prescient was amid the global financial crisis, and that's a big exception, so there's that.
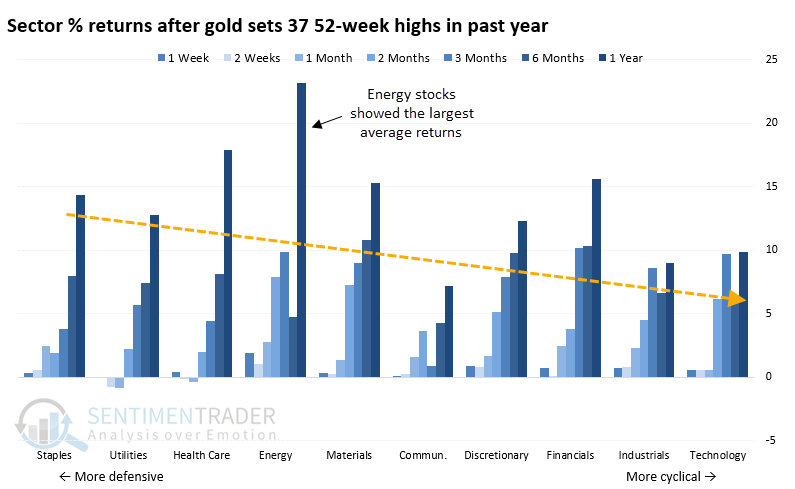
Energy stocks enjoyed the most impressive one-year return after gold had set so many new highs. Three months later, those stocks were higher every time, averaging about +10%. A year later, that sector averaged about a +24% return. There was a rough pattern of diminishing returns as the sectors moved from the more defensive to the more cyclical.
What the research tells us...
Gold has been getting a lot of attention, and for good reason. Sentiment has become extremely optimistic, which is troublesome because its returns have been poor after extremes like this. Even so, there are times when momentum rules all and can steamroll sentiment or any other factor. We seem to be in one of those moments.
The most compelling part of this run of new highs is that by the time it gets to this point, gold has rarely peaked. On average, it took weeks before even a one-month high and several months before a multi-month peak. That suggests giving the yellow metal some room and watching for a violation of a relatively longer moving average.