
Gold - Part II (the bad news)

Key Points
- One of the primary seasonal cycles for gold is in an unfavorable period (and will remain there for some time)
- A key momentum indicator for gold also remains unfavorable at the moment
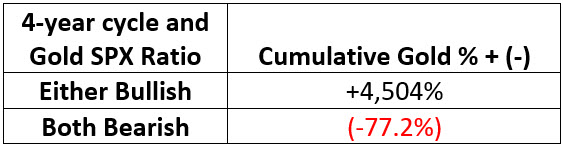
- When both of the indicators are unfavorable, gold performance has historically been abysmal
Gold versus the 4-year cycle
Seasonal and cyclical trends in the financial markets are too often treated as something mystical by adherents - and as a result, are too often dismissed out of hand by many other individuals. But the reality is that seasonal and cyclical trends are much like any other indicator - pieces of the puzzle to be added or subtracted from the weight of the evidence. When used in this manner, seasonal tendencies can offer extremely useful clues in many markets.
Under the category of "hiding in plain sight," the gold market has operated on a fairly reliable 4-year cycle for almost five decades. Let's take a closer look at the results.
- The first bullish 4-year cycle began on 12/31/1976 and ended 12/31/1980
- From there, the first bearish 4-year cycle began on 12/31/1980 and ended on 12/31/1984
- Bullish and bearish 4-year cycles have alternated ever since
- The most recent bearish 4-year cycle began on 12/31/2020
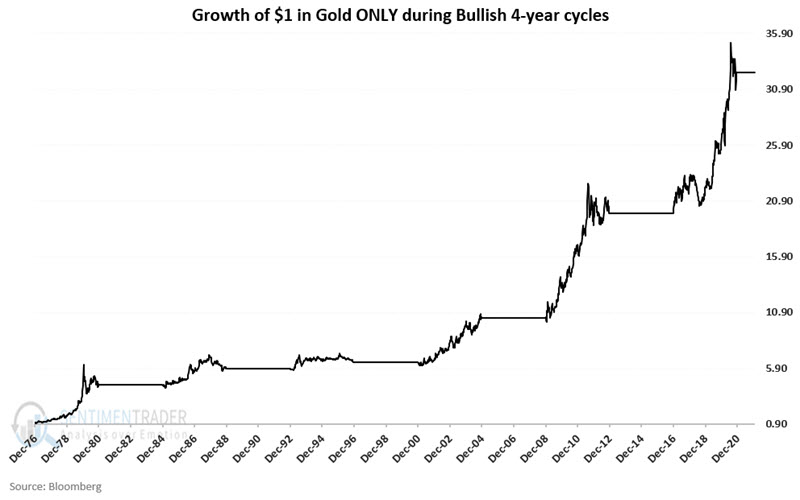
The chart below displays the growth of $1 invested in gold ONLY during bullish 4-year cycles since 1976.
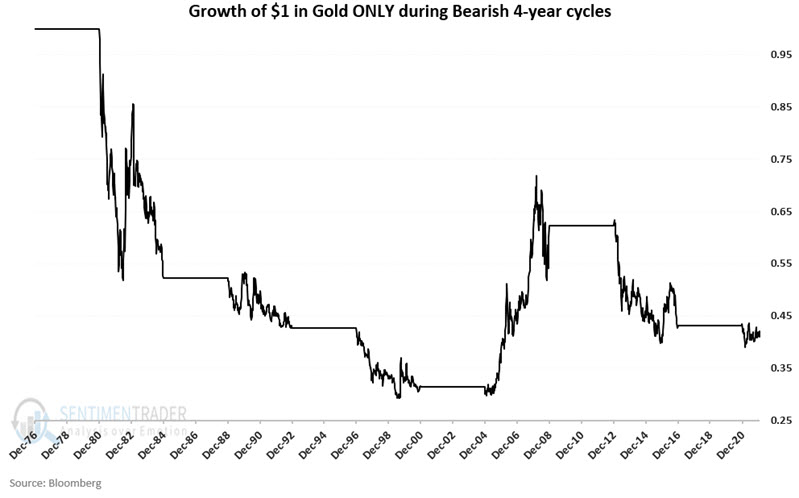
The chart below displays the growth of $1 invested in gold ONLY during bearish 4-year cycles since 1976.
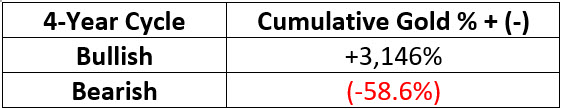
The contrast in results is fairly stark. The table below displays the cumulative % performance for gold during bullish and bearish 4-year cycles from 12/31/1976 through 2/4/2022.
Gold versus the S&P 500 Index
I am about to discuss a method I learned from Mark Ungewitter, former Senior Vice President and Senior Investment Officer of Charter Trust Company in Concord, NH. The chart below is from www.Stockcharts.com. The chart shows the price of gold divided by the price of the S&P 500 Index (designated by entering "$GOLD:$SPX" as the Symbol) along with a 200-week exponential moving average of this ratio.
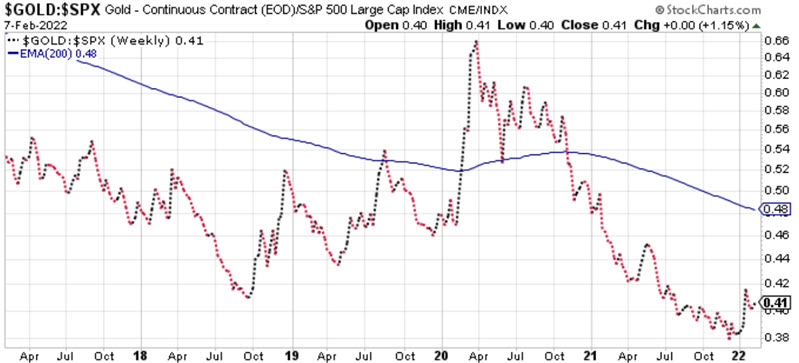
The above chart can be reviewed once a week. In a nutshell:
- It is considered BULLISH for gold when this ratio is ABOVE the 200-week moving average
- It is considered BEARISH for gold when this ratio is BELOW the 200-week moving average
At present:
- The ratio is BELOW the moving average, so the indicator is still considered to be bearish for gold
- A rise back above the 200-week moving average would suggest a bullish new up leg for the price of gold
Using the Gold/SPX ratio for timing
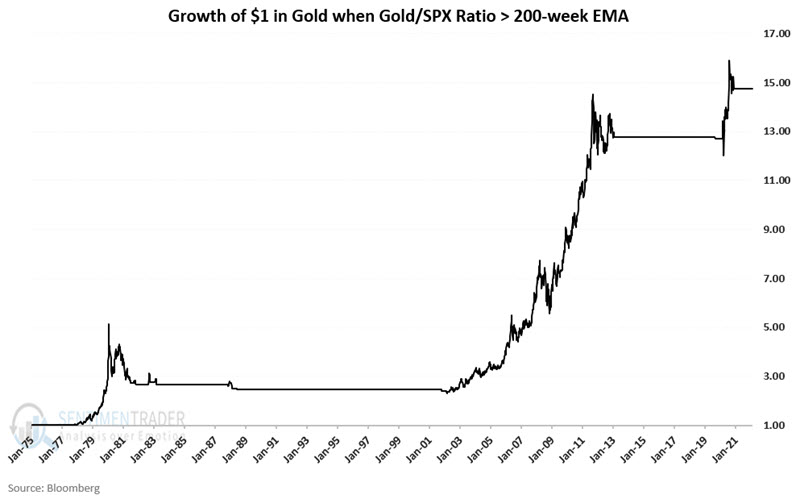
Let's look at the actual performance of gold during these two different scenarios. The chart below displays the cumulative growth of $1 in gold ONLY when the Gold/SPX ratio is ABOVE its 200-week EMA.
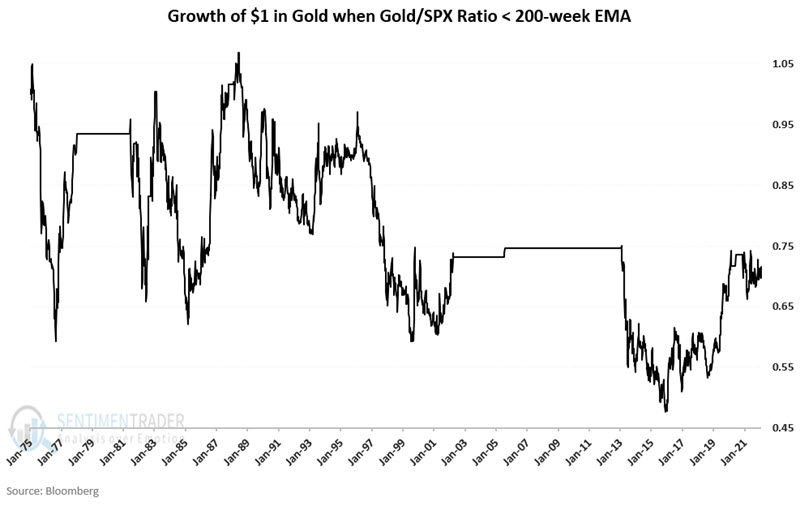
The chart below displays the cumulative growth of $1 in gold ONLY when the Gold/SPX ratio is BELOW its 200-week EMA.
The table below displays the cumulative performance for gold based solely on the method described above from January 1975 into February 2022.
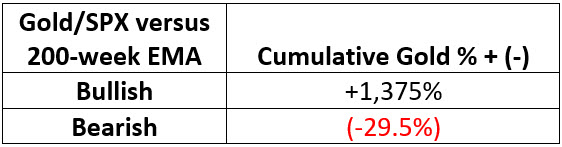
At present, the Gold/SPX ratio remains below its 200-week EMA.
Putting the two together
Now let's consider the performance of gold based on the status of the two indicators above since January 1975 (NOTE: For this test, the period from 1/1/1975 through 12/31/1976 is considered part of a bearish 4-year cycle).
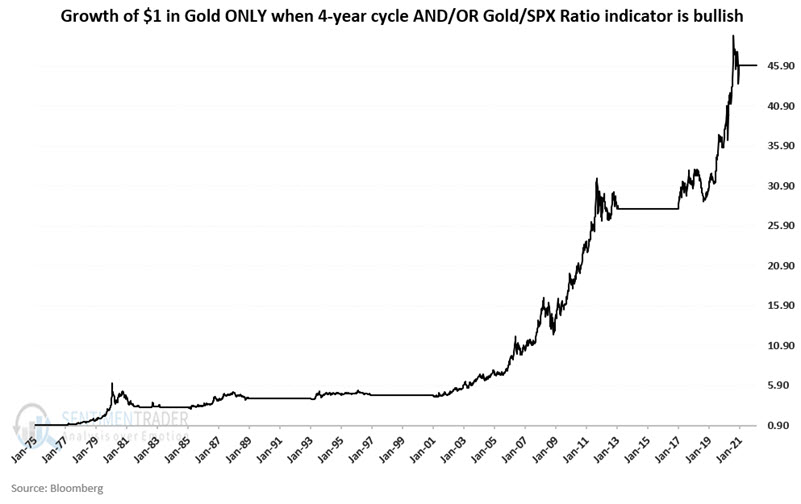
The chart below displays the cumulative growth of $1 in gold when EITHER of the two indicators above is bullish.
The chart below displays the cumulative growth of $1 in gold when BOTH of the two indicators above are bearish.
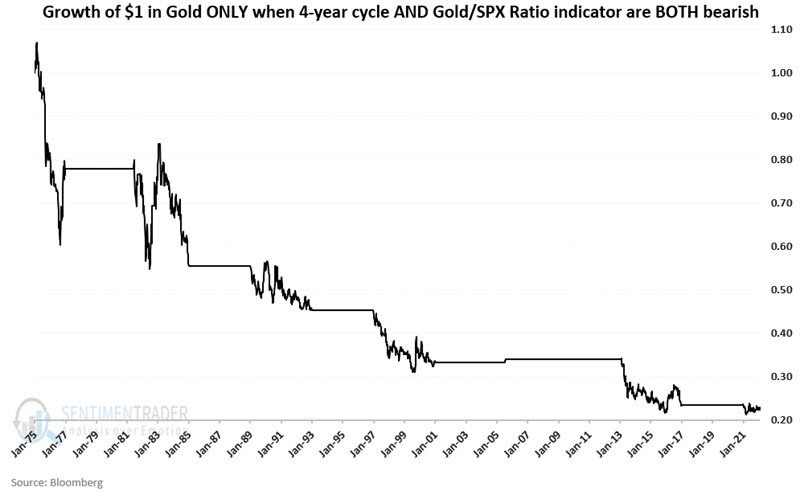
The table below displays the cumulative performance for gold based solely on the methods described above from January 1975 through May 2021.
What the research tells us…
None of what appears above means that gold cannot stage a meaningful rally. In fact - as we saw in Part I, one indicator suggests good performance for gold in the next 1 to 3 months. Nevertheless, based on the indicators detailed above, gold still has some "proving" to do before investors should feel comfortable piling into a meaningful position.