
Gold - Part I (the good news)

Key Points
- Gold and the U.S. Dollar enjoy a generally inverse relationship
- At times, the action of the dollar can influence - or at least suggest - the price direction for gold
- Fluctuations in U.S. Dollar sentiment can also at times suggest a price direction for gold
Gold versus the U.S. Dollar
The chart below displays a weekly price chart for gold futures in the top clip and U.S. dollar futures in the bottom clip (courtesy of ProfitSource).
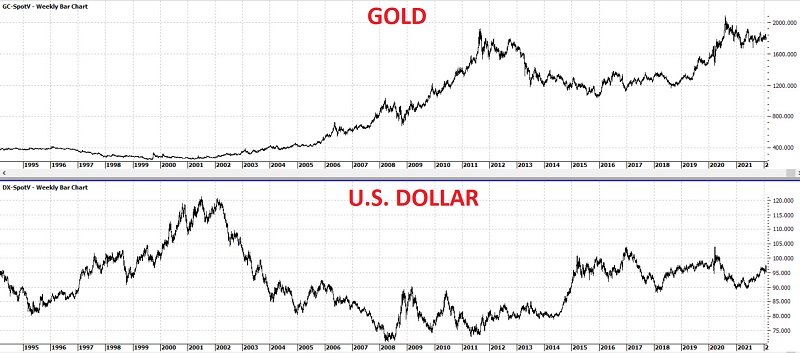
The generally inverse relationship between the two is fairly obvious to the subjective eye. But objectively using this relationship to identify trading opportunities is a different topic.
U.S. Dollar Optix versus gold - a positive development
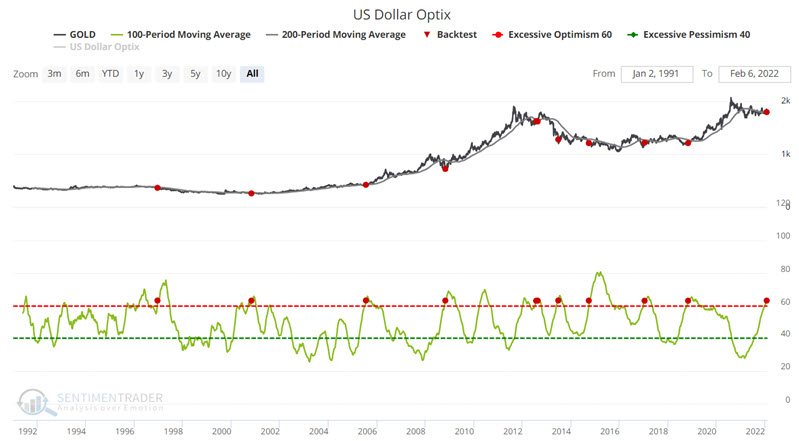
The chart below displays the price action of gold versus its own 200-day moving average in the top clip and 100-day moving average for U.S. Dollar Optix in the lower clip. The red dots highlight those times when the U.S. Dollar Optix 100-day average crossed above 63 while gold was below its 200-day moving average. You can run this test in the Backtest Engine. A new signal occurred on January 28th, 2022.
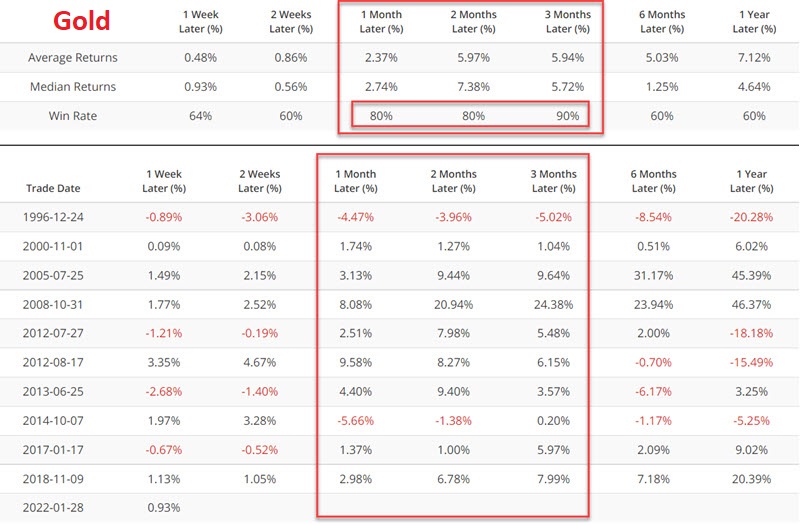
The table below displays price performance for Gold following the signals shown above. The key thing to note is the tendency for price strength for gold in the one-to-three-month periods after a signal.
Using an ETF instead
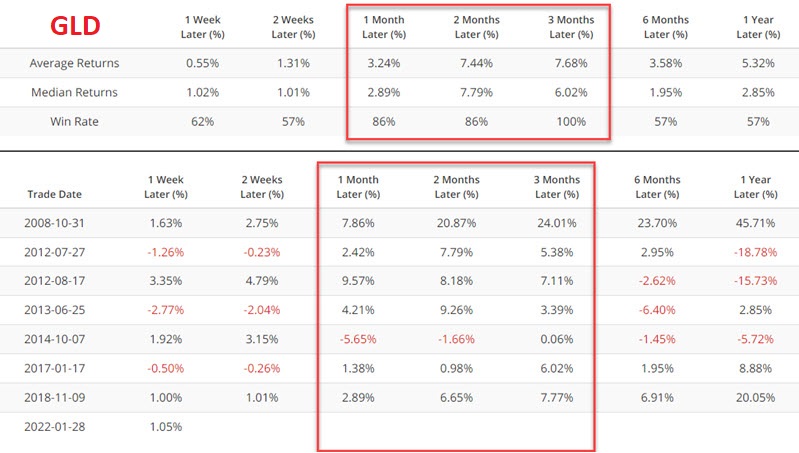
GLD (SPDR Gold Shares) is an ETF that allows traders to trade gold like they trade shares of stock. This ETF has a shorter history as it started trading in 2004. The table below displays price performance for GLD following the signals shown above. Shorter-term traders who do not wish to trade gold futures should note the tendency for strength in this ETF in the one-to-three-month period after a signal.
U.S. Dollar Optix versus gold - what to watch out for
Before getting too carried away, let's reiterate the short-term nature of the signal above. Let's consider what happens to gold when dollar sentiment reverses. The red dots in that chart below highlight those times when the U.S. Dollar Optix 100-day average crossed below 62 (with no moving average filter for gold). You can run this test in the Backtest Engine.
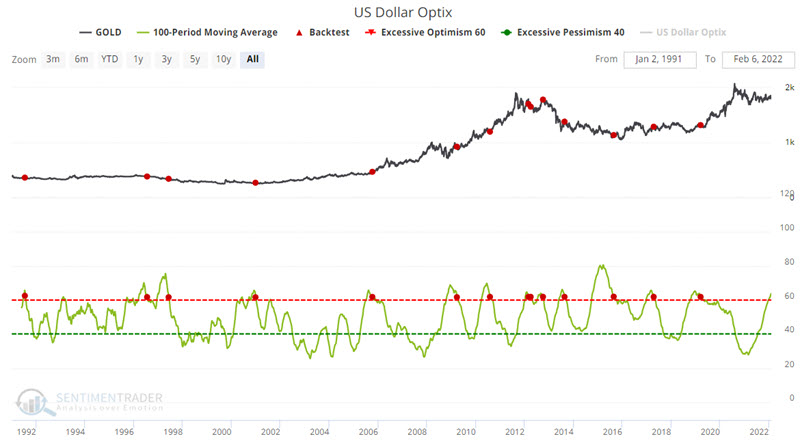
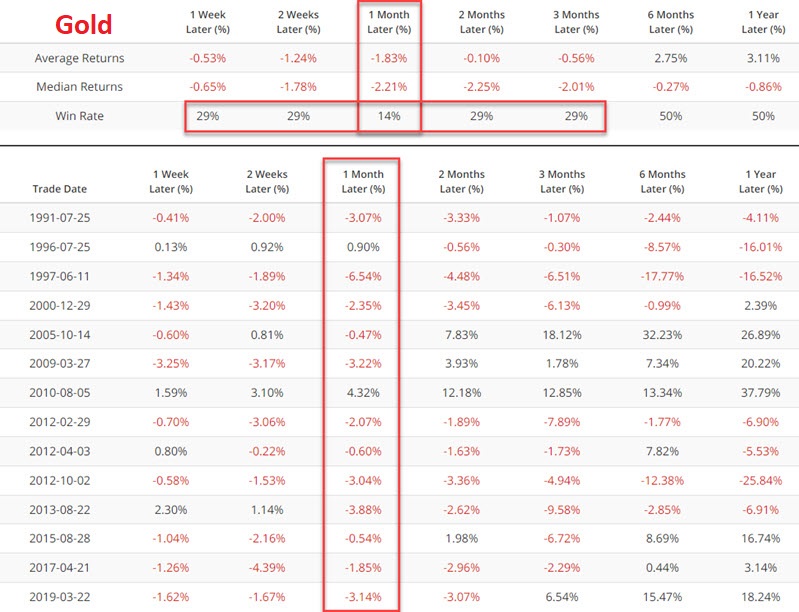
The table below displays price performance for Gold following the signals shown above. The key thing to note is the tendency for price weakness for gold in the one-week to three-month periods after a signal - particularly one 1-month out.
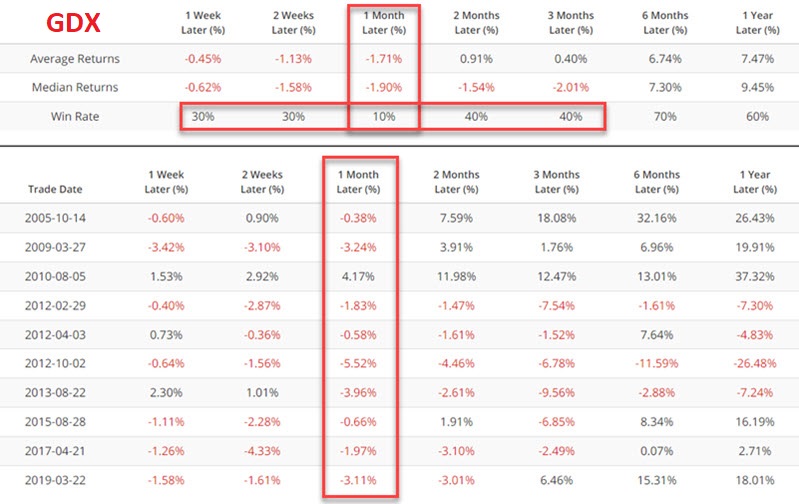
Running the same test with GLD since 2004 generates similar results.
What the research tells us…
Gold has been a disappointing performer - virtually unchanged since June of 2020 (and October of 2012, for that matter). As we will discuss in Part II of this short series, gold still has some serious "proving" to do before we can put much faith in the din of never-ending cries of "gold is about to soar!"
Nevertheless, the first signal above suggests that gold could witness a decent rally in the next several months.