
Gold miners try again

Key points:
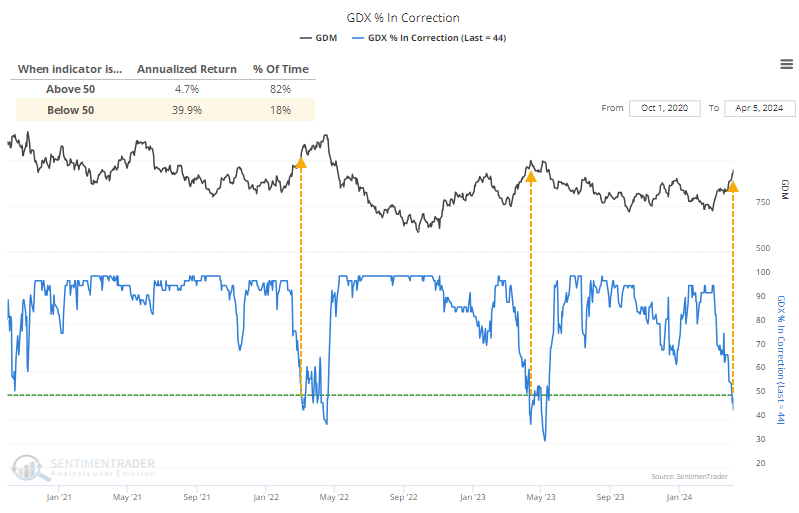
- Fewer than half of gold mining stocks are in correction territory, more than 10% off their 52-week highs
- Nearly a third of miners hit 52-week highs in the past week
- Similar bouts of positive momentum tend to punish late buyers
Most miners are out of correction territory
Gold mining stocks are perking up after a mostly brutal couple of years. The problem is that gold bugs are a relatively small group of investors and either don't have the buying power or willingness to persistently push the stocks higher.
Over the years, we've repeatedly seen that upside momentum in gold mining stocks tends to be very temporary. Once a decade at most, they'll enjoy a secular rise that runs roughshod over overbought readings. Outside of those spectacular moments, bouts of positive momentum tend to get hammered.
We can see that just in the past couple of years. Whenever fewer than half of the miners were mired in a correction - meaning at least half of them were within 10% of their 52-week highs - the GDX fund soon peaked. The annualized return of GDX is excellent as long as fewer than 50% of miners are in a correction; the problem is when it ticks back above 50%, and that's most of the time.
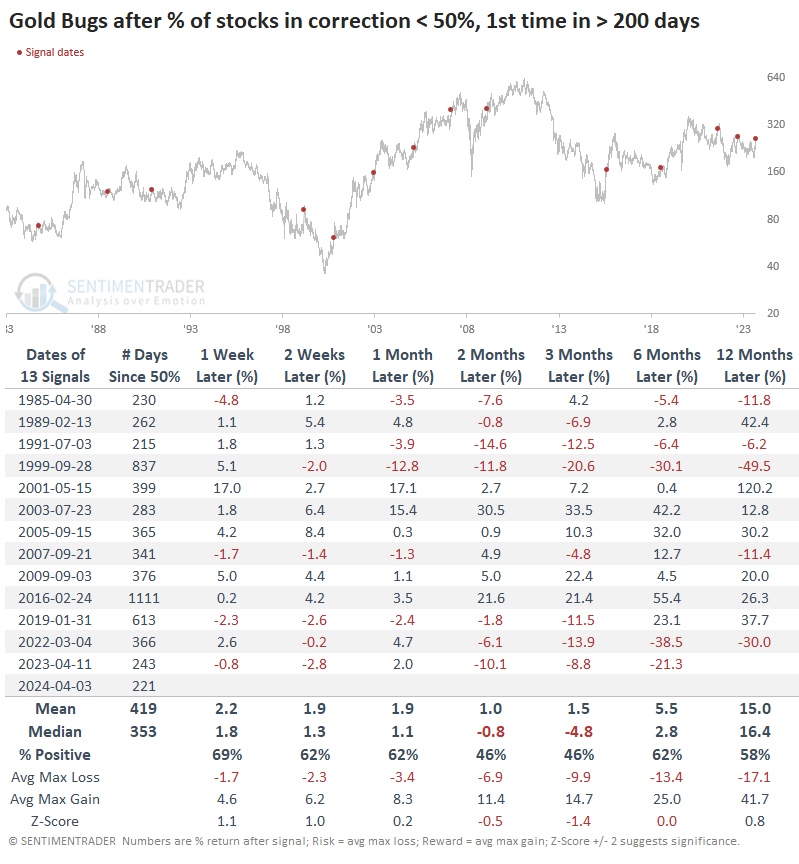
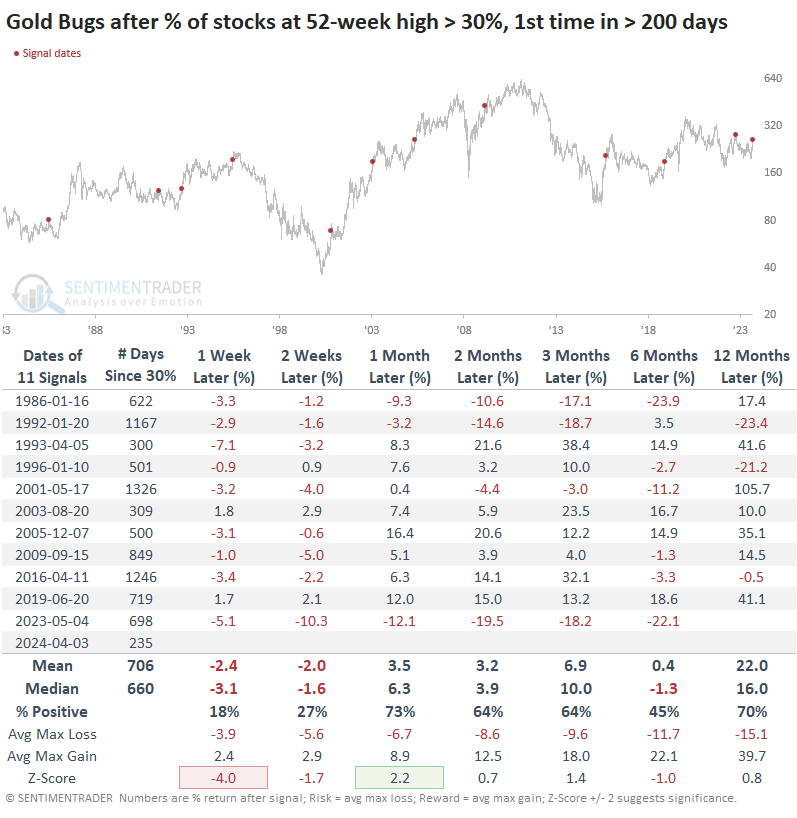
The table below shows why it has been so difficult for investors in the sector to make money. When enough stocks recover to within 10% of their highs after a long stretch below, the Gold Bugs index has tended to see waning momentum over the next two to three months.
The last three signals preceded double-digit drawdowns with little upside over the next few months, while in the early 2000s, the group shrugged off any concerns.
The chart below shows how an investor with $10,000 would have done with miners under three strategies:
- Buy and hold (black line)
- Only hold miners when fewer than 50% of them are in corrections (green line)
- Only hold miners when more than 50% of them are in corrections (red line)
We can see clearly that the equity curve was highest when fewer stocks were in corrections. This is normal behavior for a sector. Holding a gold mining index only when most of them were in corrections was a good way to destroy capital.
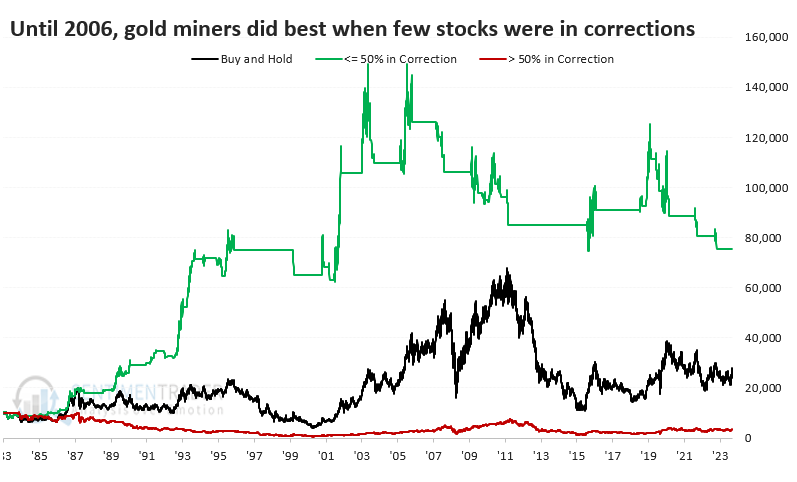
However, it's also evident that the green equity curve peaked in 2006. For almost two decades since then, it has actually been the worst-performing out of the three strategies.
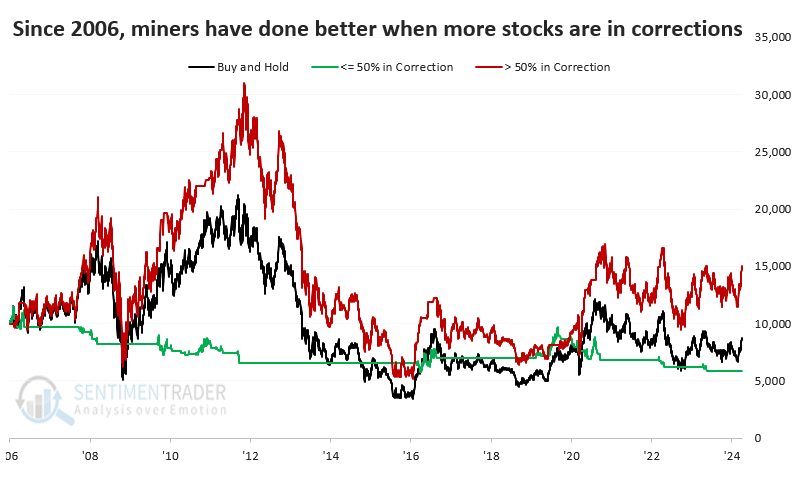
The suggestion here is that taking a more mean-reversion type of attitude has been a better bet in recent decades, so jumping on improving trends has been more dangerous.
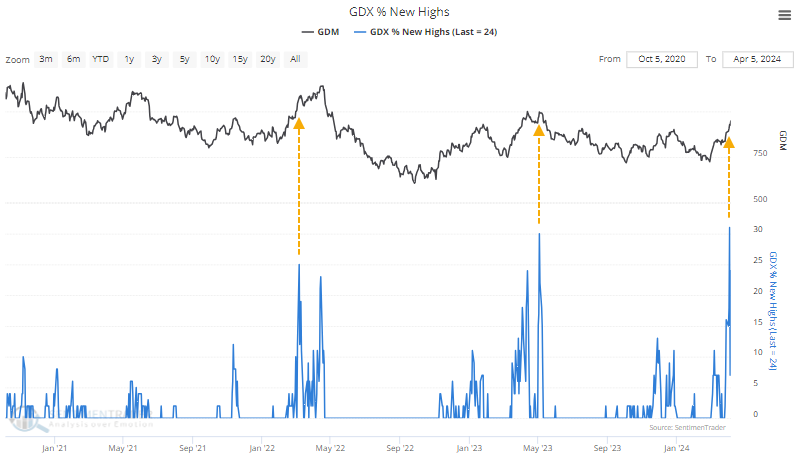
Most new highs in almost 4 years
We can see something similar with the percentage of miners hitting new highs. More than 30% of the stocks hit a 52-week high in the past week, the largest percentage since August 2020. That might be a good sign of strength, but again, this sector is notorious for rug-pulls just when things start to look bright like the last two times.
The table below shows how investors were immediately punished for chasing these stocks higher, with exceptionally poor returns in the short term. But other than the last signal in 2023, they showed a solid tendency to rebound in the weeks and months ahead. Returns were volatile and inconsistent, another hallmark of this group.
What the research tells us...
More and more gold mining stocks are recovering from a brutal few years. As of late last week, enough stocks had recovered that it usually coincides with persistent bull market conditions in the typical sector. The issue for gold bugs is that this is not a typical sector - it has periodic returns of astronomical proportions that punctuate long periods of malaise.
Those periods of malaise have a nasty habit of punishing investors who try to jump on positive momentum. Just when the outlook for miners starts to look sunny, it is overshadowed by thunderstorms of sellers. The biggest clue as to whether this time is different (gulp) is if buyers persist in the coming weeks. We rarely see that during periods of malaise, so it would be a good sign that we're in the beginning stages of one of those once-a-decade positive environments.