
Gold miner uptrends relax after a major surge

Key points:
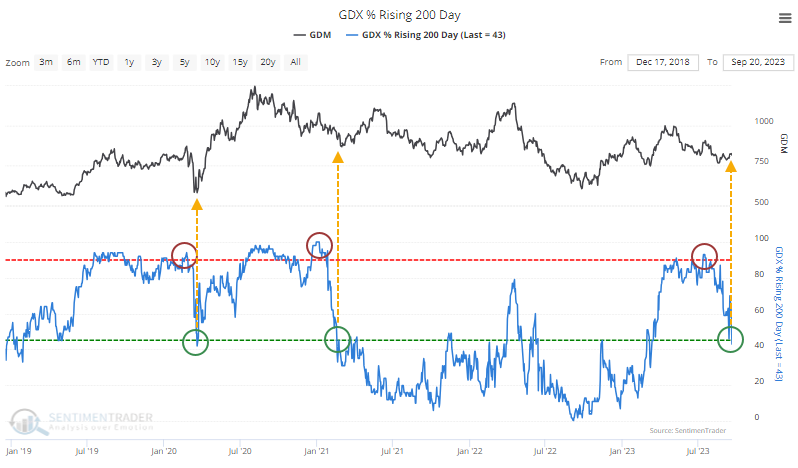
- Persistent long-term uptrends among gold miners have plunged since July
- More than 90% of mining stocks had a rising 200-day average, now fewer than half do
- Similar cycles mostly preceded rebounds for the sector
Gold miner trends take a big hit
Gold bugs have been having a tough time of it, which is par for the course. Investors who are bullish on the companies that mine precious metals often have to suffer tortuous years of malinvestment for the hope of those glorious months when everyone rushes into the space at the same time.
Even though the stocks have somehow held up in recent weeks despite rising rates and a rocky stock market, more and more of the stocks in the sector have seen their long-term trends turn sour. The percentage of gold mining stocks with a rising 200-day moving average has cratered to less than half of what had been almost universal uptrends.
Since gold miners are such a consistently underperforming group, traditional mean-reversion methods can be sketchy. The sector doesn't always respond very well to modest oversold readings.
And the current reading isn't really all that oversold; it's just below neutral. But context is important, and the context here is that earlier this year, almost all the stocks were in major and persistent long-term uptrends. That's important.
The last two times we saw a cycle like this, it indicated that investors had temporarily taken a hiatus during up cycles, and a substantial rebound was imminent. Within the next three months, the HUI Gold Bugs index had rallied more than 80% (in 2020) and 21% (in 2021).
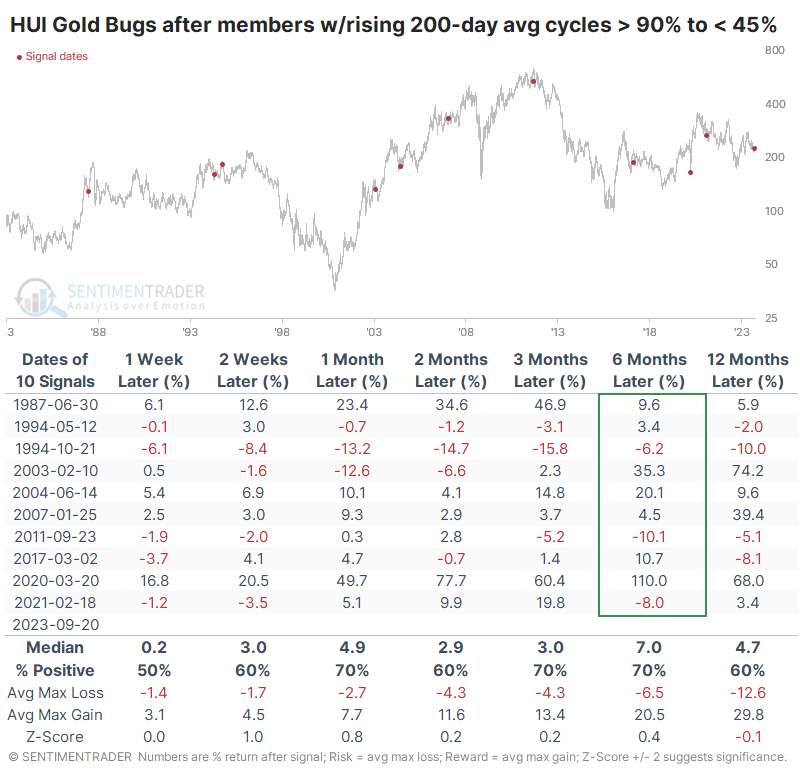
The table below shows the history of these cycles going back 40 years. The results aren't exceptionally consistent, but their performance over the next six months is the most interesting aspect. Seven of the ten showed a positive return, with only a single double-digit loss. For the broader stock market, that wouldn't be anything special, but it's better than we usually see for a group like gold bugs.
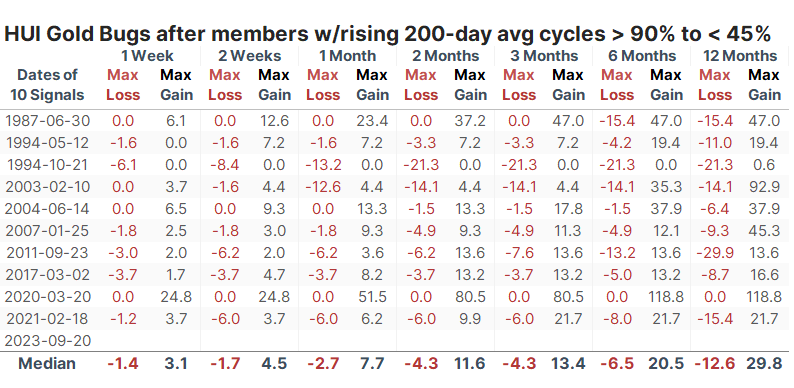
The table of maximum gains and losses across time frames shows that risk was higher than we usually like to see, but at least over the next six months, the average reward was more than three times larger than the average risk. There was one signal with more than a 20% decline within six months, but five signals with more than a 20% gain at some point (and one that just barely missed). Again, this wouldn't be all that compelling for a broader index, but it's pretty positive for gold bugs.
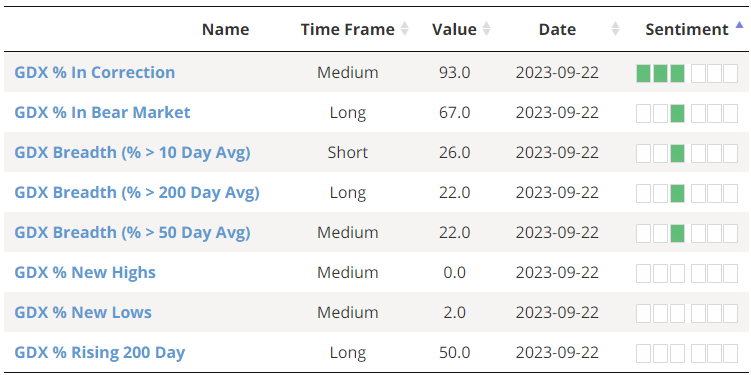
Other metrics that we calculate are mostly inconclusive. There are a few oversold readings, but nothing that's extraordinarily compelling.
What the research tells us...
Gold miners are a sector that some investors love and will stick with through almost anything. For most others, they're a niche fetish that is best avoided. When they work, they can provide amazing returns and act as a diversifier for a portfolio. But those times are rare and often fleeting. There aren't many signs that the group is either washed out or showing compelling momentum. It's kind of in an in-between phase.
At least one metric that calculates sustained long-term trends has cycled into a mild oversold region after an upside thrust, and these cycles have a moderately interesting history of preceding medium- to long-term gains for gold bugs. It's not a table-pounding buy signal by any stretch; it's more of a modest piece of evidence that miners may be in the midst of one of their not-underperforming stages.