
Gold Market Bullish Narrative vs Rare Signals

Key Points
- Long-term capital fuels gold's bullish consensus, pushing prices to new highs.
- Gold's rare 52-week highs signal 1-year pullbacks (excluding extreme inflation).
- GDX (gold miners) shows unprecedented breadth exhaustion, with 50/200-day MA breadth at extreme highs for over 20 days.
- Clash between bullish narrative and signals pushes gold market risks to recent peaks.
A Market in Contradiction
On the surface, gold's bullish logic has solid market recognition. Since 2025, gold prices have kept breaking key resistance levels, with the market viewing sustained long-term capital allocation as the core driver. Global reserve asset adjustment is trending-major economies favor non-sovereign credit assets, and inflows into gold ETFs remain historically high. These factors together build the "long-term gold bullish" narrative.
Beneath this optimism, however, rare quantitative signals flash intensely. These are not ordinary "overbought noise" but "extreme condition indicators" that only appear at critical historical turning points: gold's new high frequency has hit a decades-long threshold, and gold miners' sector uniformity has broken historical records. For investors, the core question has shifted from "Do bullish reasons hold?" to "When consensus conflicts with rare signals, which side will the market take?"
Capital Flows
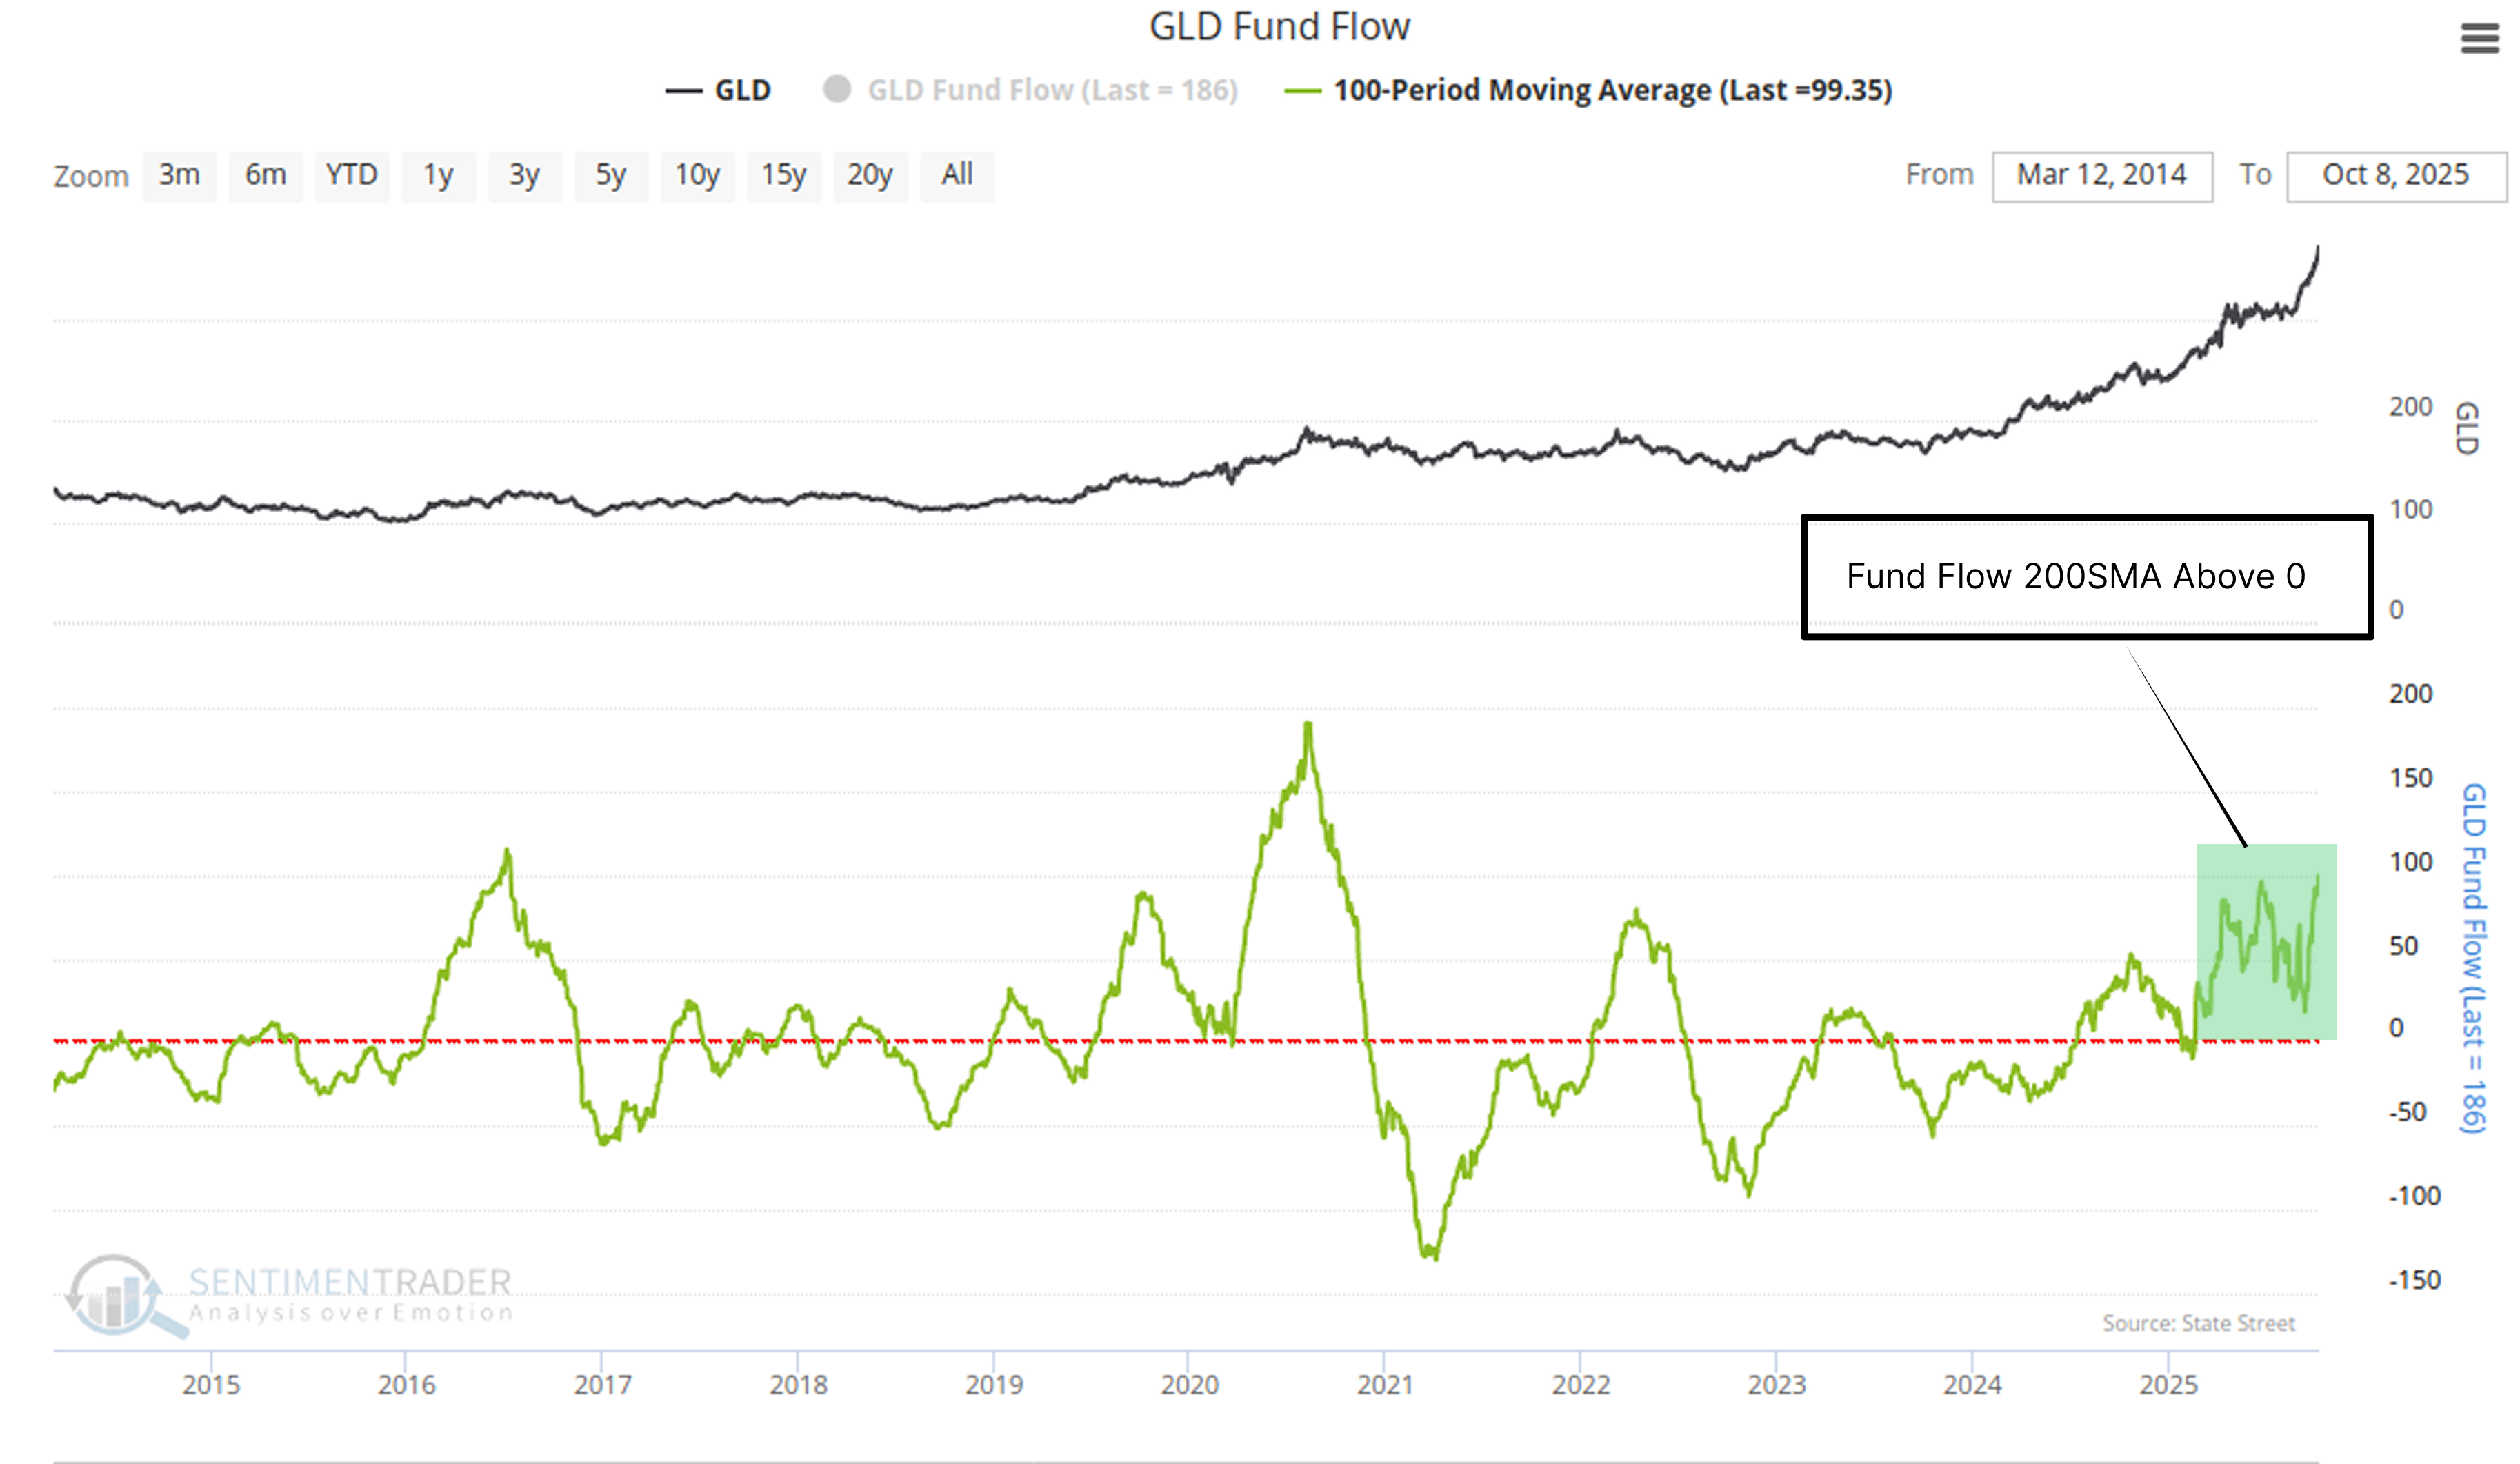
The bullish narrative's structural support comes from sustained long-term capital inflows. As a key gold market indicator, GLD Fund Flow data shows current consecutive net inflow duration has entered a rare range since 2006-this signal's historical performance provides key quantitative backing for the bullish logic.
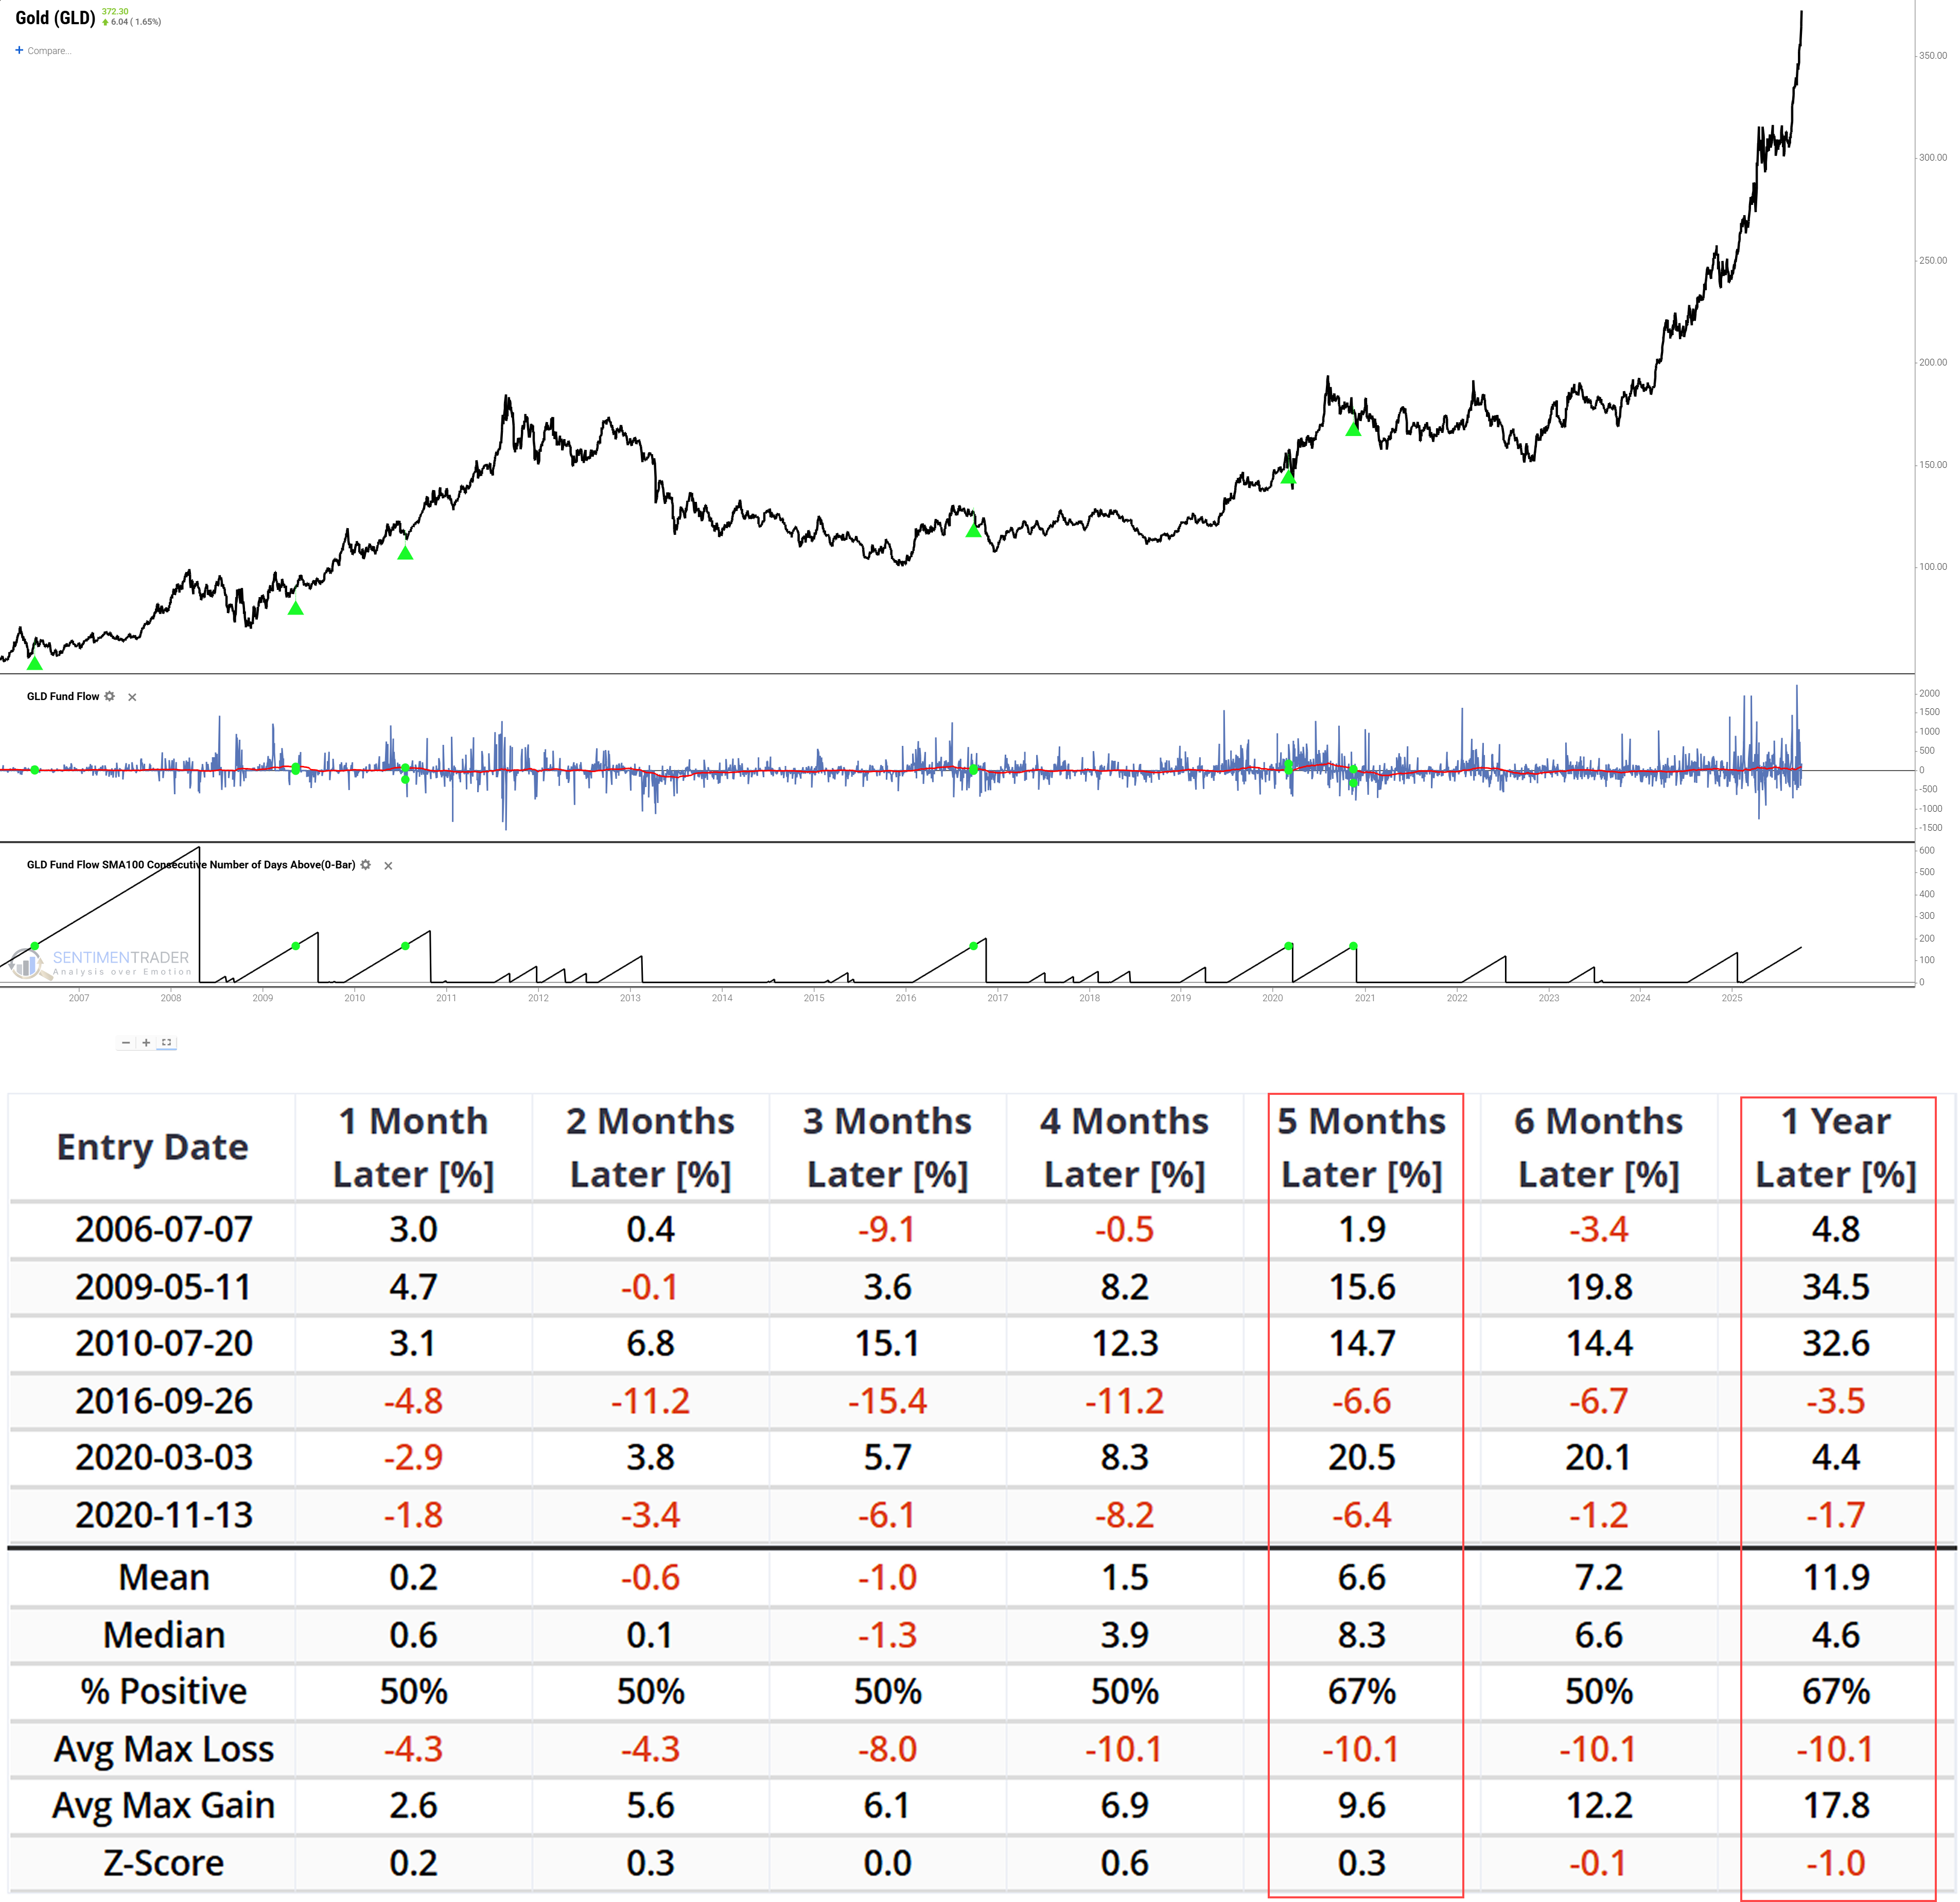
Historical backtests of this signal show clear differences: its short-term (1-3 months) support is unstable, with a median return of -1.3% and 50% positive returns-meaning capital inflows can't fully avoid short-term volatility. But in the medium-to-long term (5+ months), the signal's positive bias emerges: 5-month median return rises to 8.3%, 1-year positive returns hit 67%, and average profits exceed potential losses. This "short-term volatility, long-term support" trait is the core quantitative basis for the current bullish narrative.Related Backtest Click Here.
Historical Insights from New High Signals
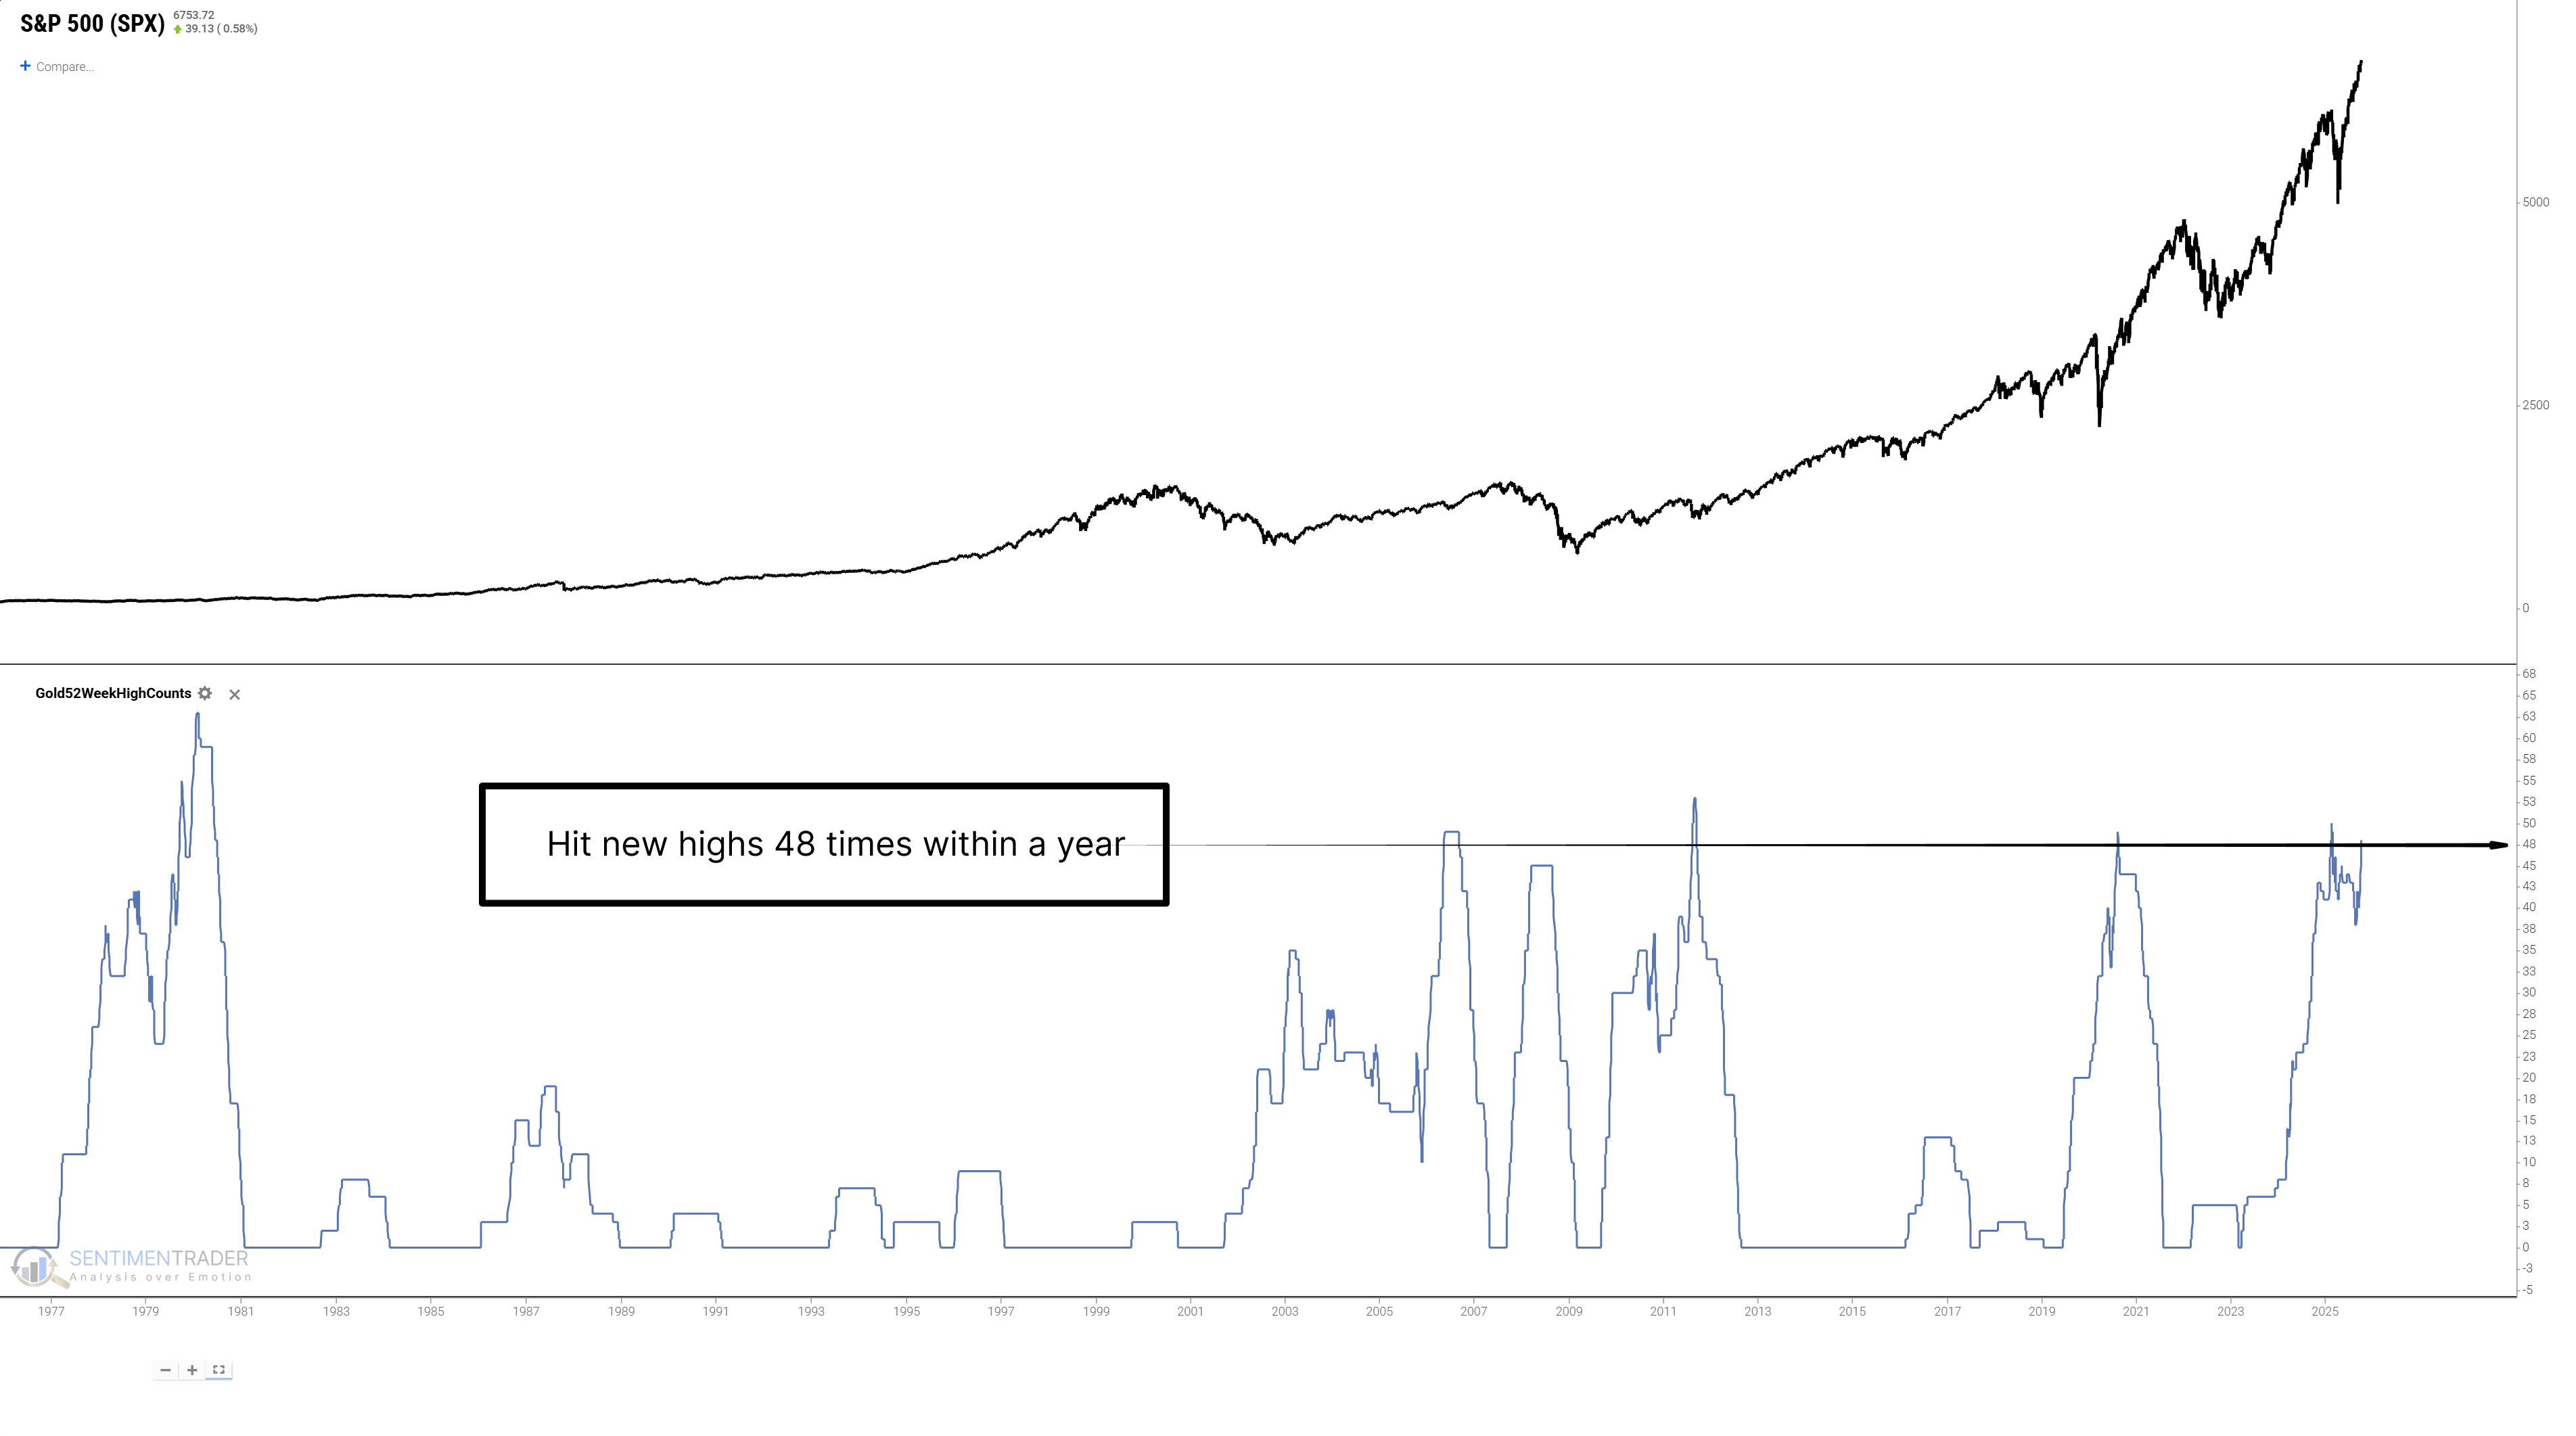
The market's contradiction starts with warnings from gold price behavior. When gold hits a specific number of 52-week highs in a year, this rare signal has high historical reference value-since the 1970s, it has triggered only 5 times, and almost always points to cyclical peaks except in special macro scenarios.
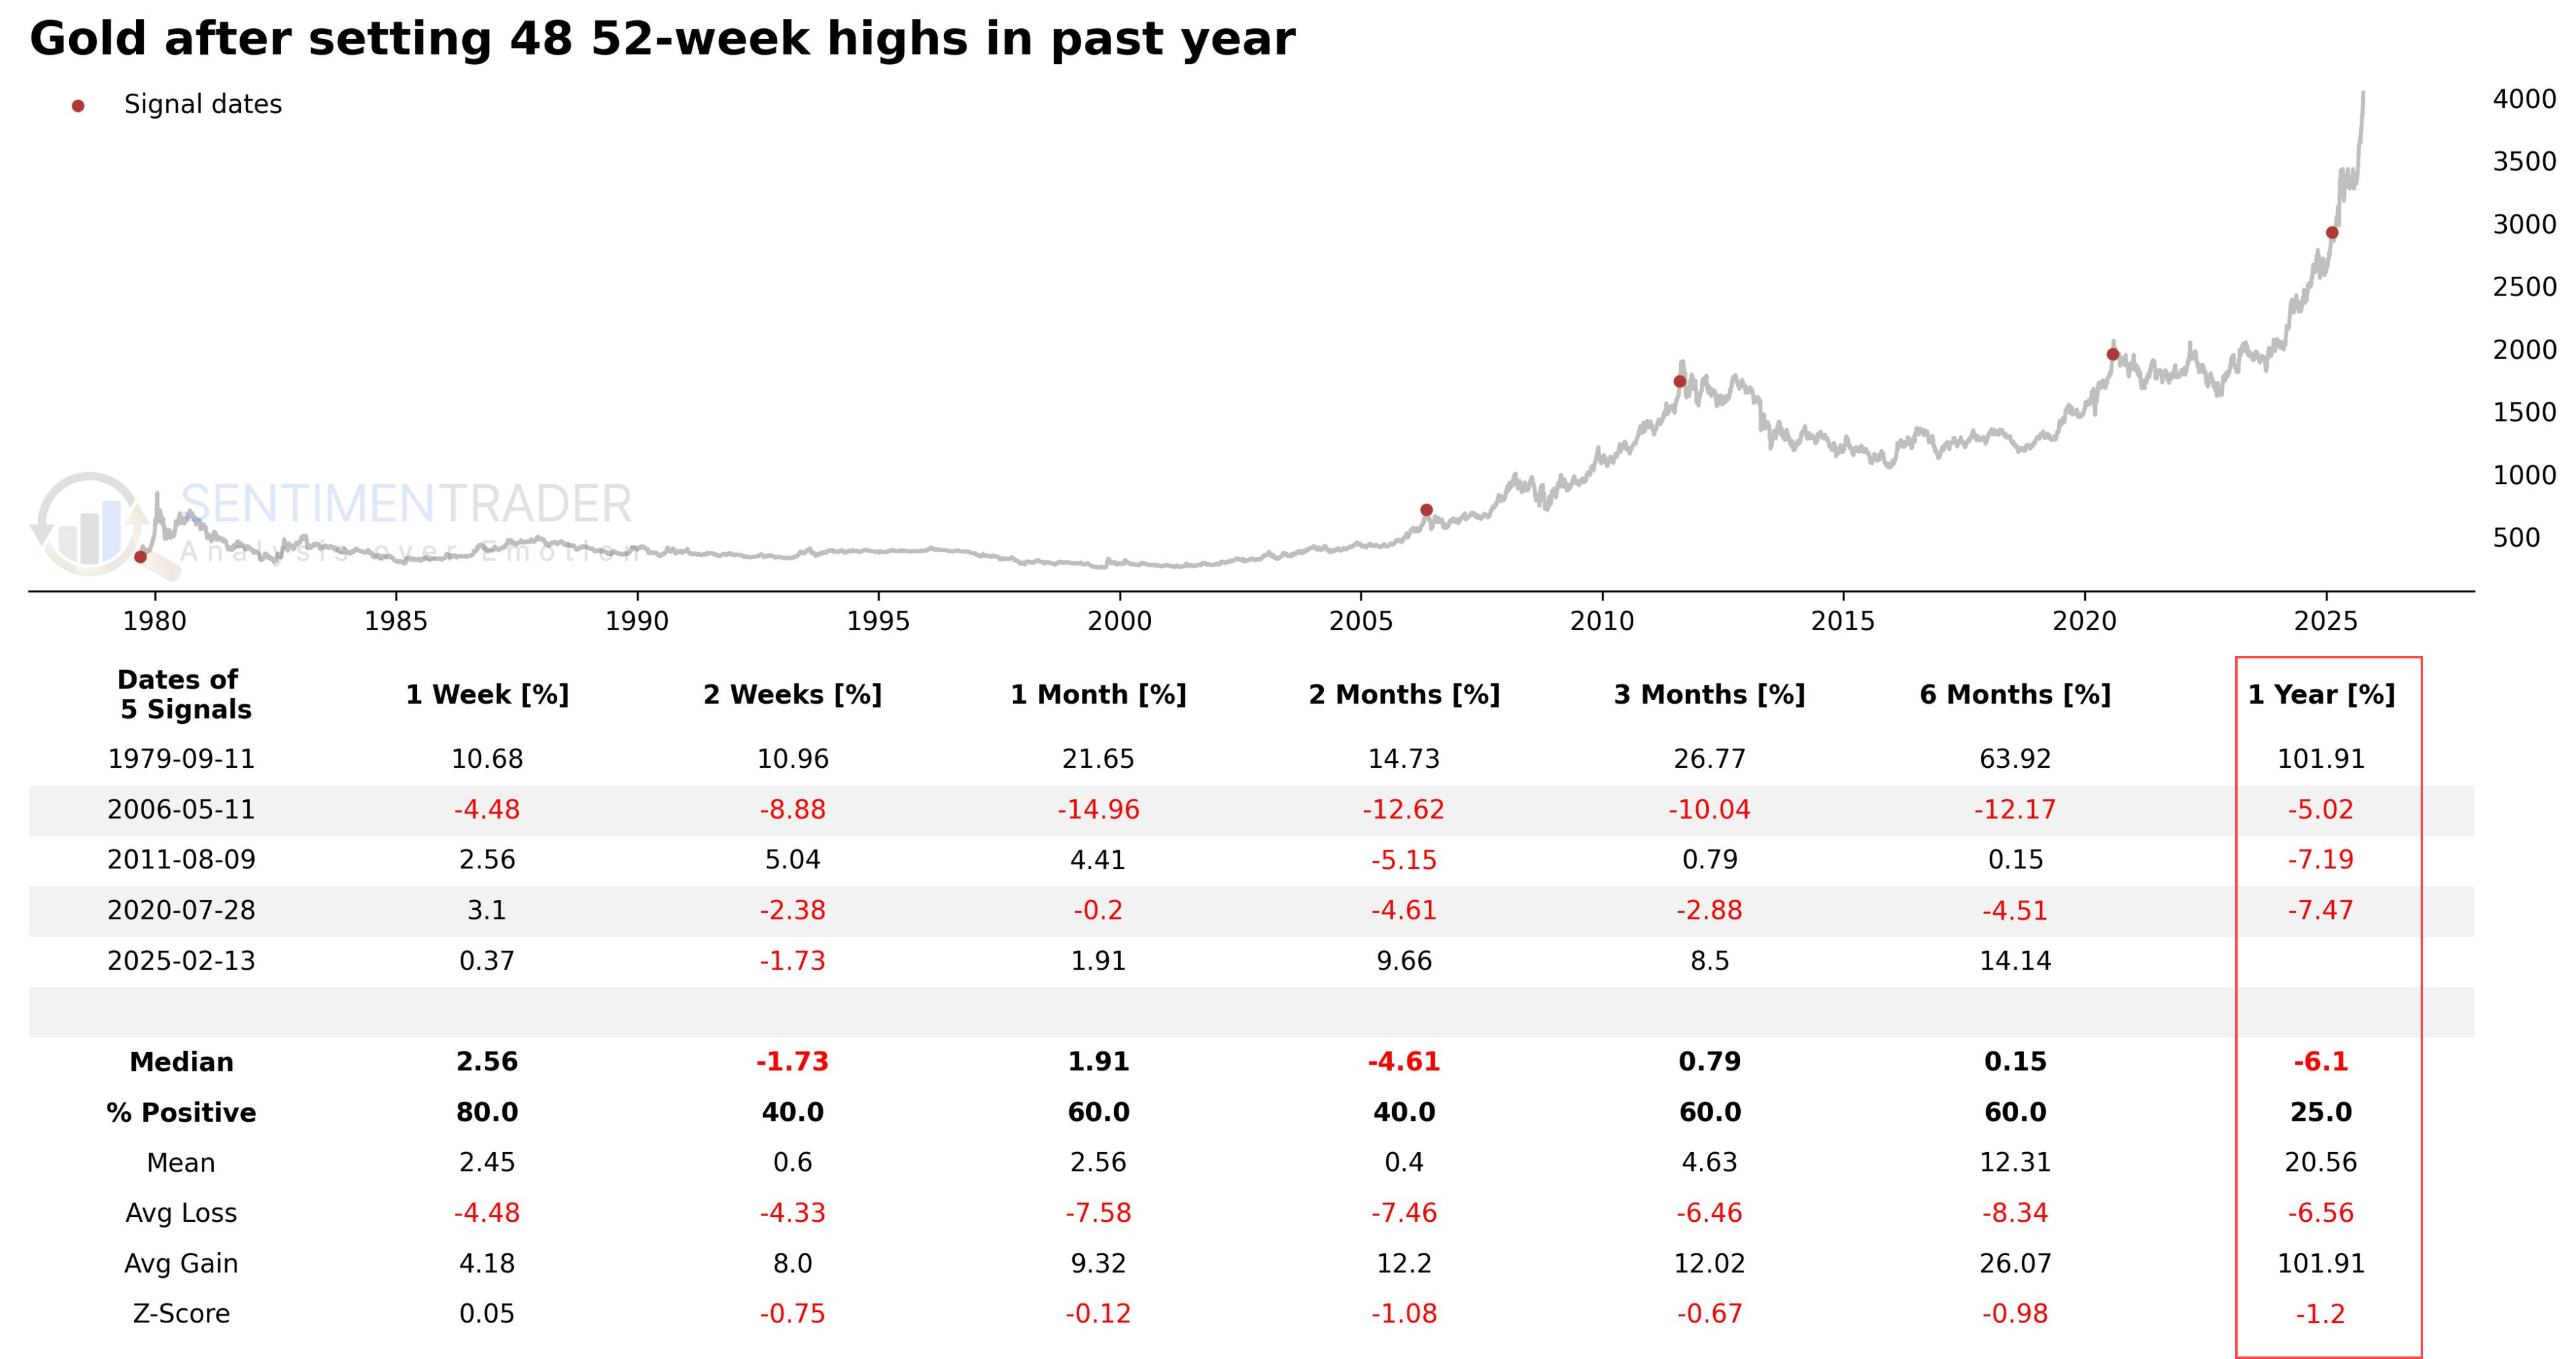
Data shows a clear "short-term bull trap, long-term pullback" pattern: 1-week positive returns hit 80% (median 2.56%), explaining why investors still chase the rally after the current breakthrough. But after 2 weeks, the trend reverses-median return drops to -1.73%, positive returns halve to 40%, and risks unwind quickly.
More concerning is long-term performance: except for late-1970s extreme inflation, 1-year returns were negative in the other three signal-triggered cases (median -6.1%, 25% positive returns). While the current market has long-term allocation support, it differs fundamentally from historical extremes and is closer to "trend exhaustion" in a regular cycle-meaning historical pullback patterns will likely take effect.
Extreme Exhaustion in Gold Miners
The key to understanding current market fragility lies in gold miners (GDX)-the "speculative engine" of the gold industry chain. As a gold market leading indicator, GDX's sector breadth has reached unprecedented extremes: both medium-term (50-day MA) and long-term (200-day MA) component stock trend uniformity have hit all-time highs. This "broad-based overbought" condition has almost always ended in deep pullbacks historically.
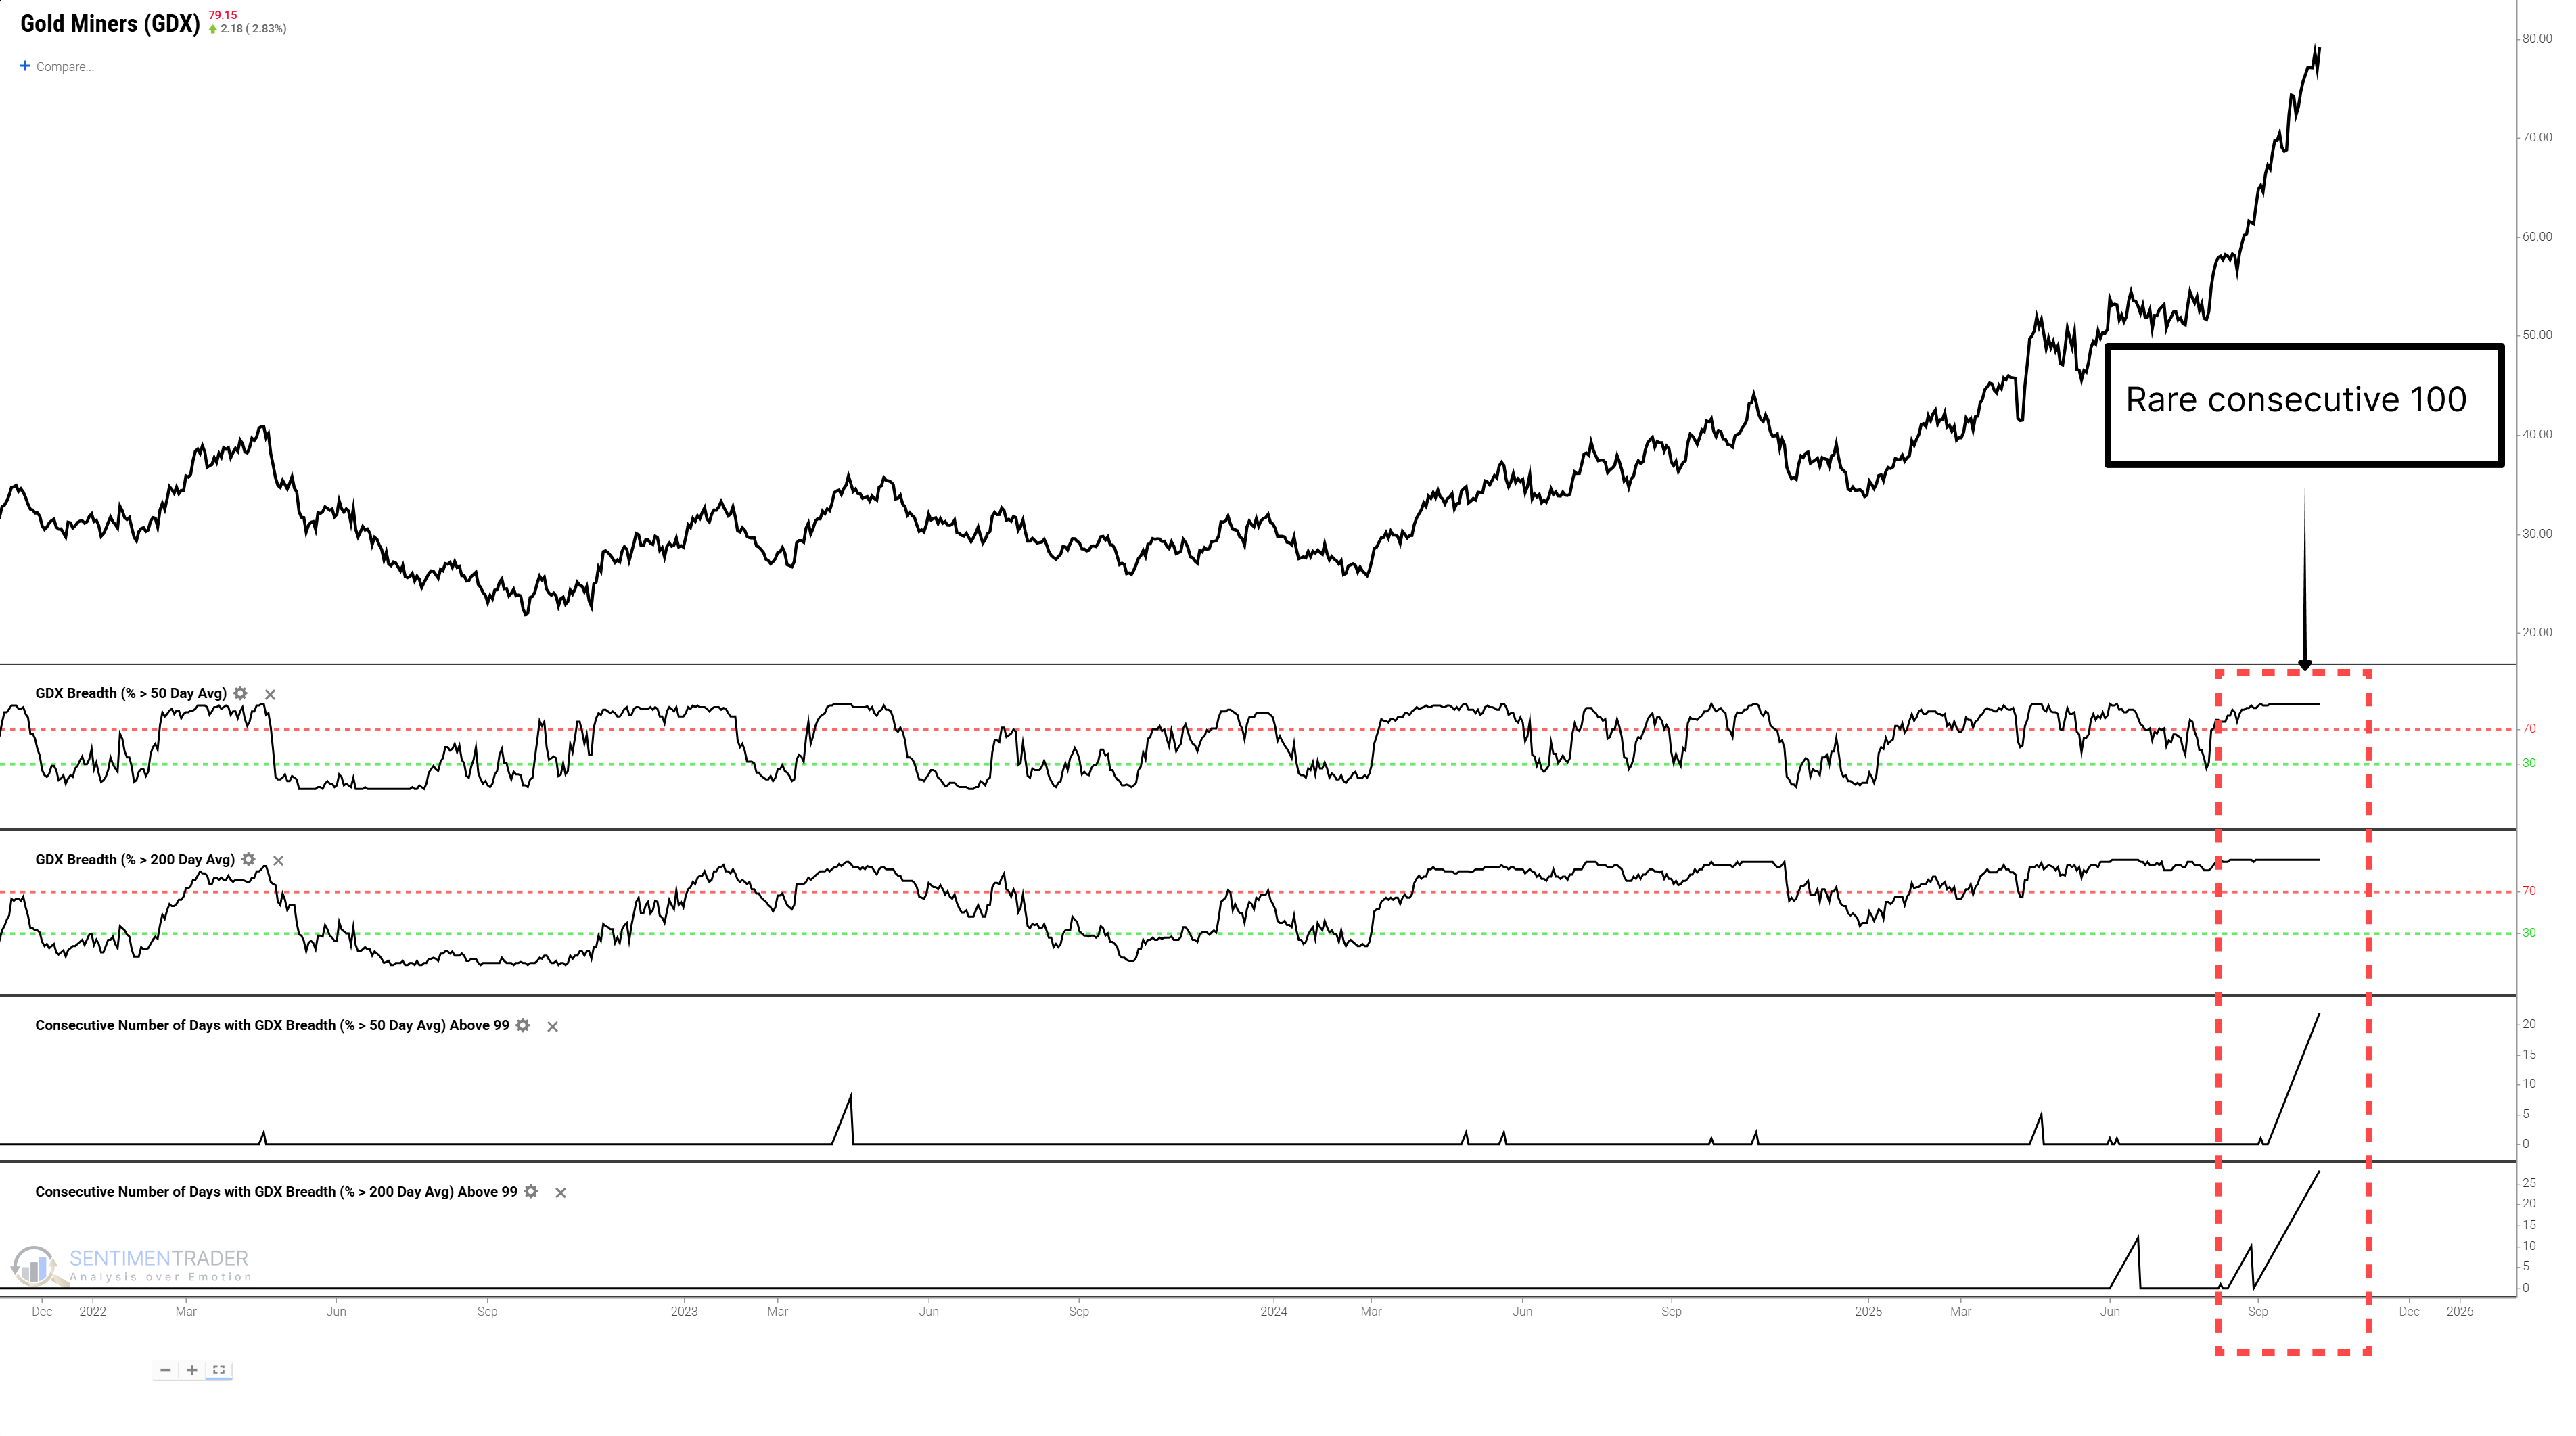
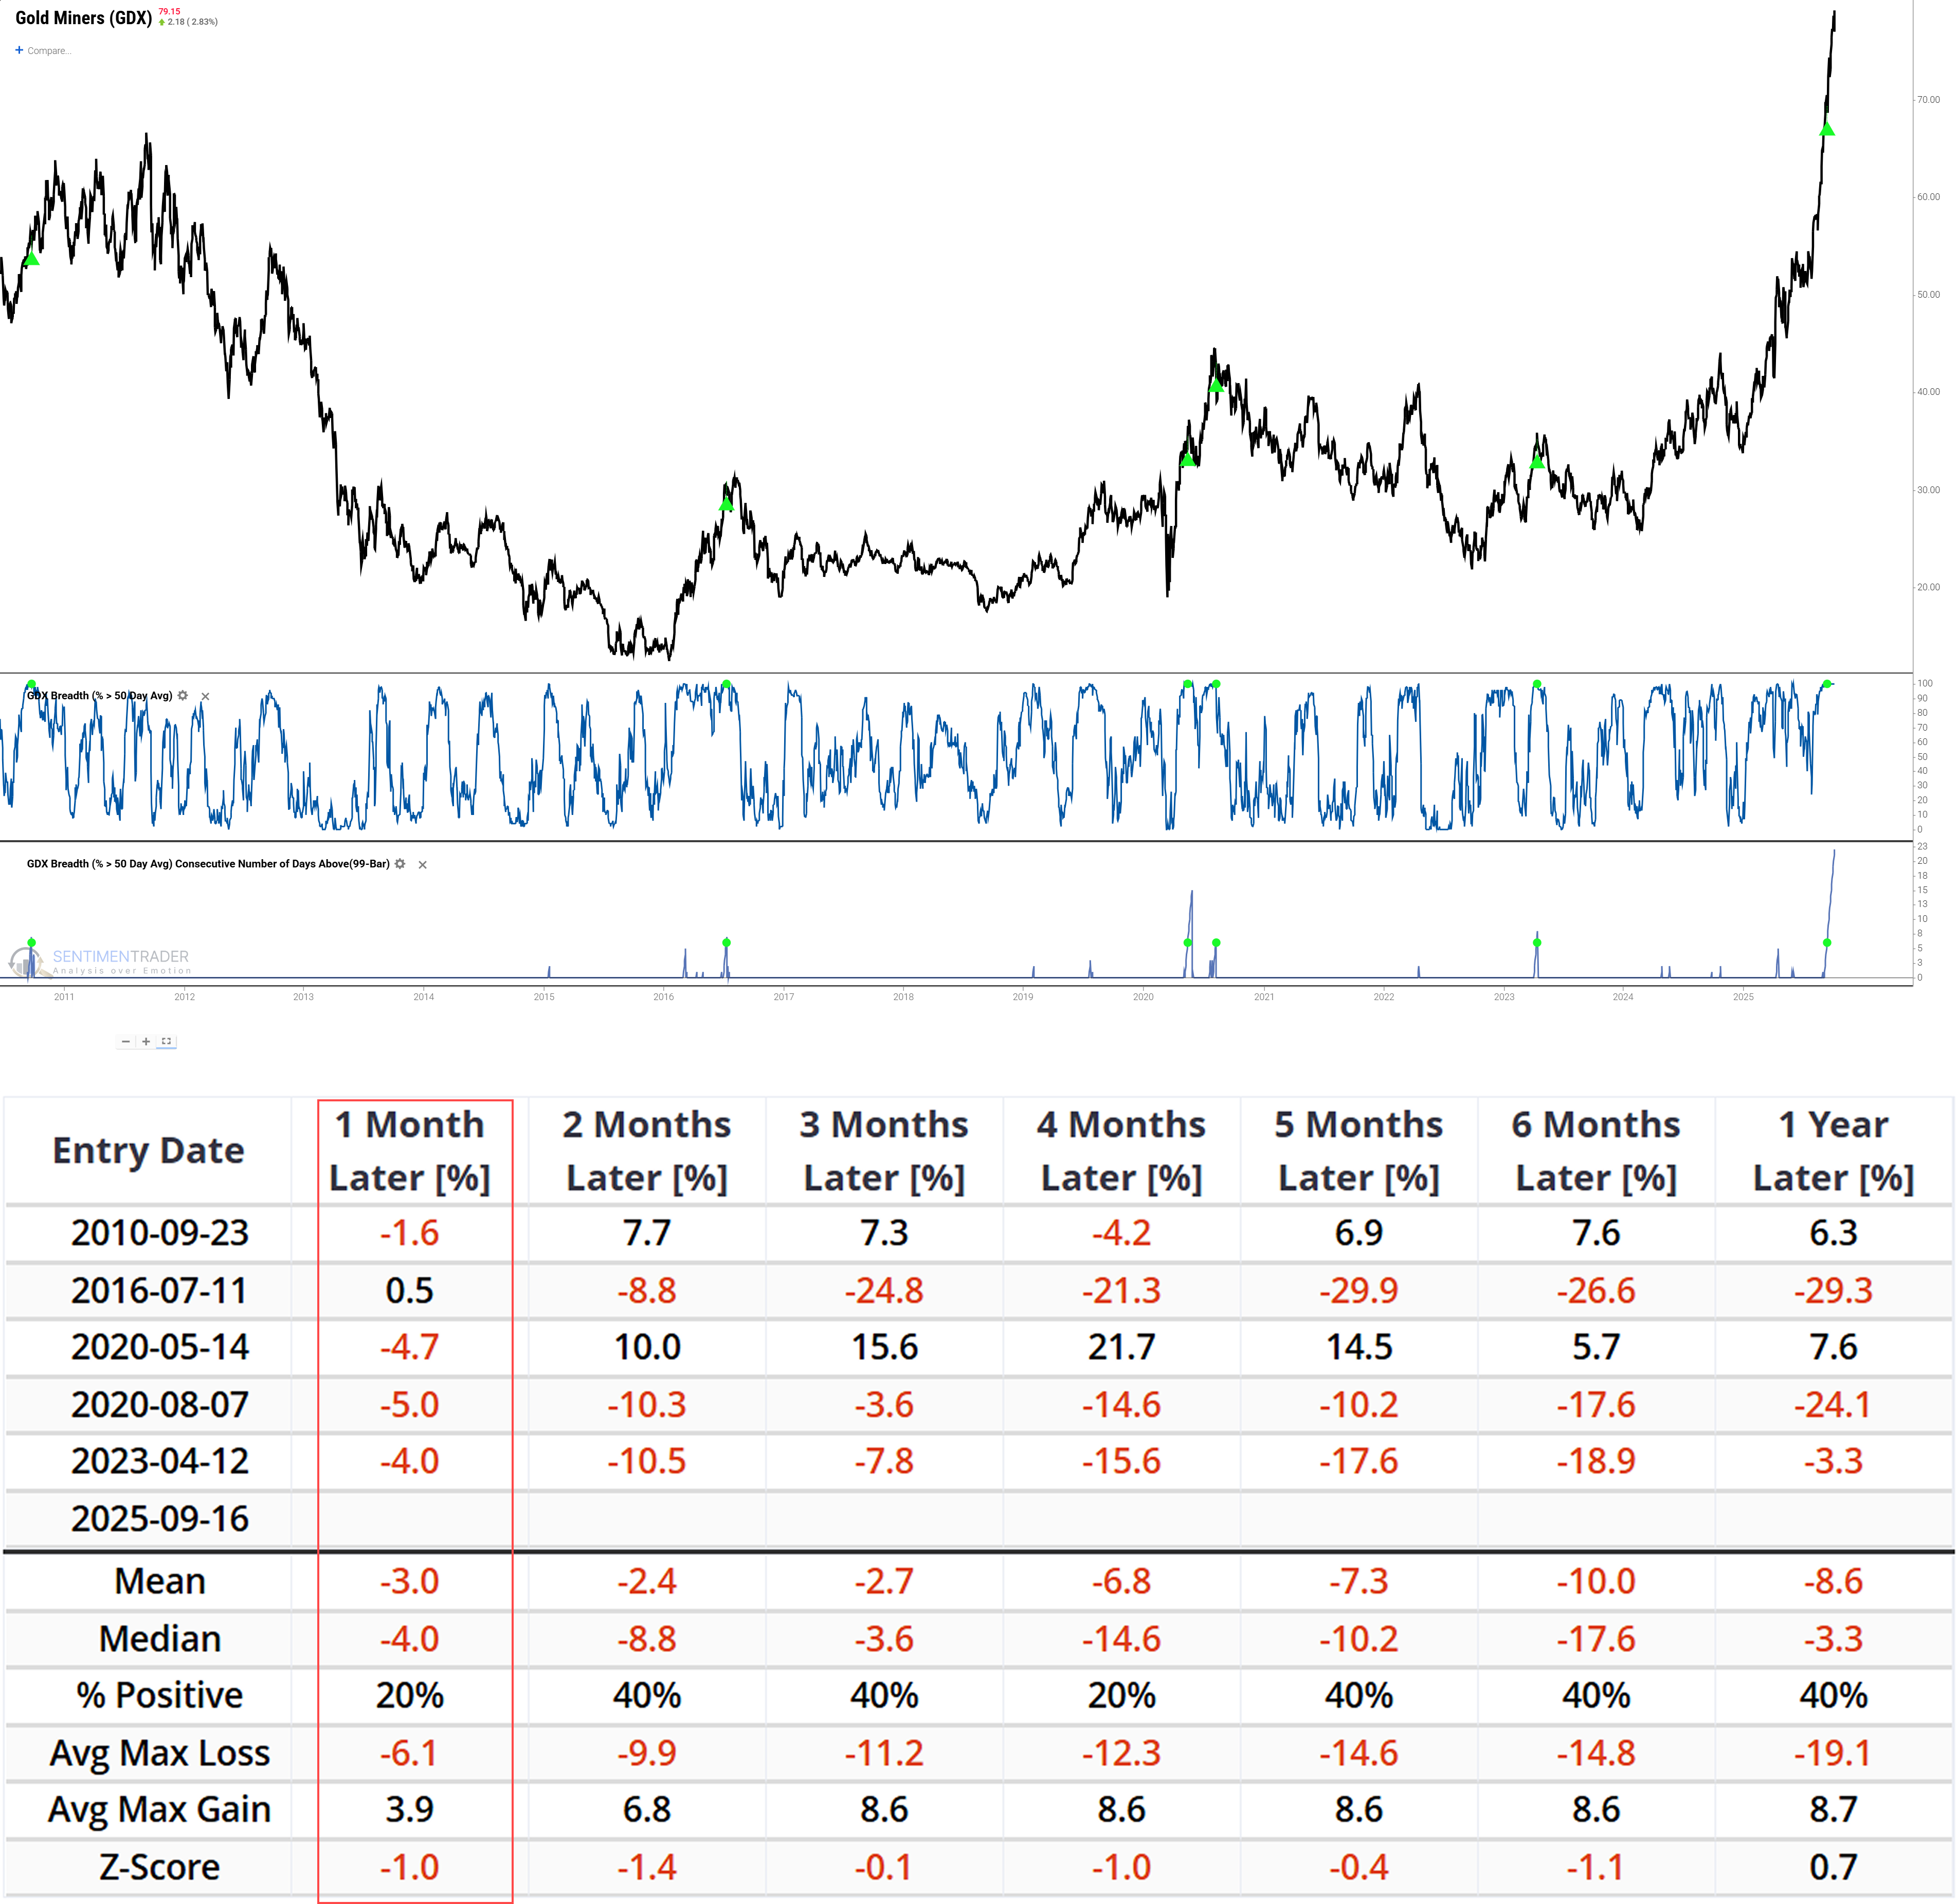
Tracking the "percentage of GDX components above 50-day MA" shows this ratio's duration at extreme highs has set a historical record. Backtests of similar historical extremes highlight acute short-term risks: 1-month median return is -4.0% (20% positive returns), meaning the market will adjust short-term in most cases. Even if some see medium-term rallies, 6-month median return is -17.6%-pullback pressure after medium-term momentum exhaustion can't be avoided. The current record-breaking extreme breadth duration further amplifies this short-term risk.Related Backtest Click Here.
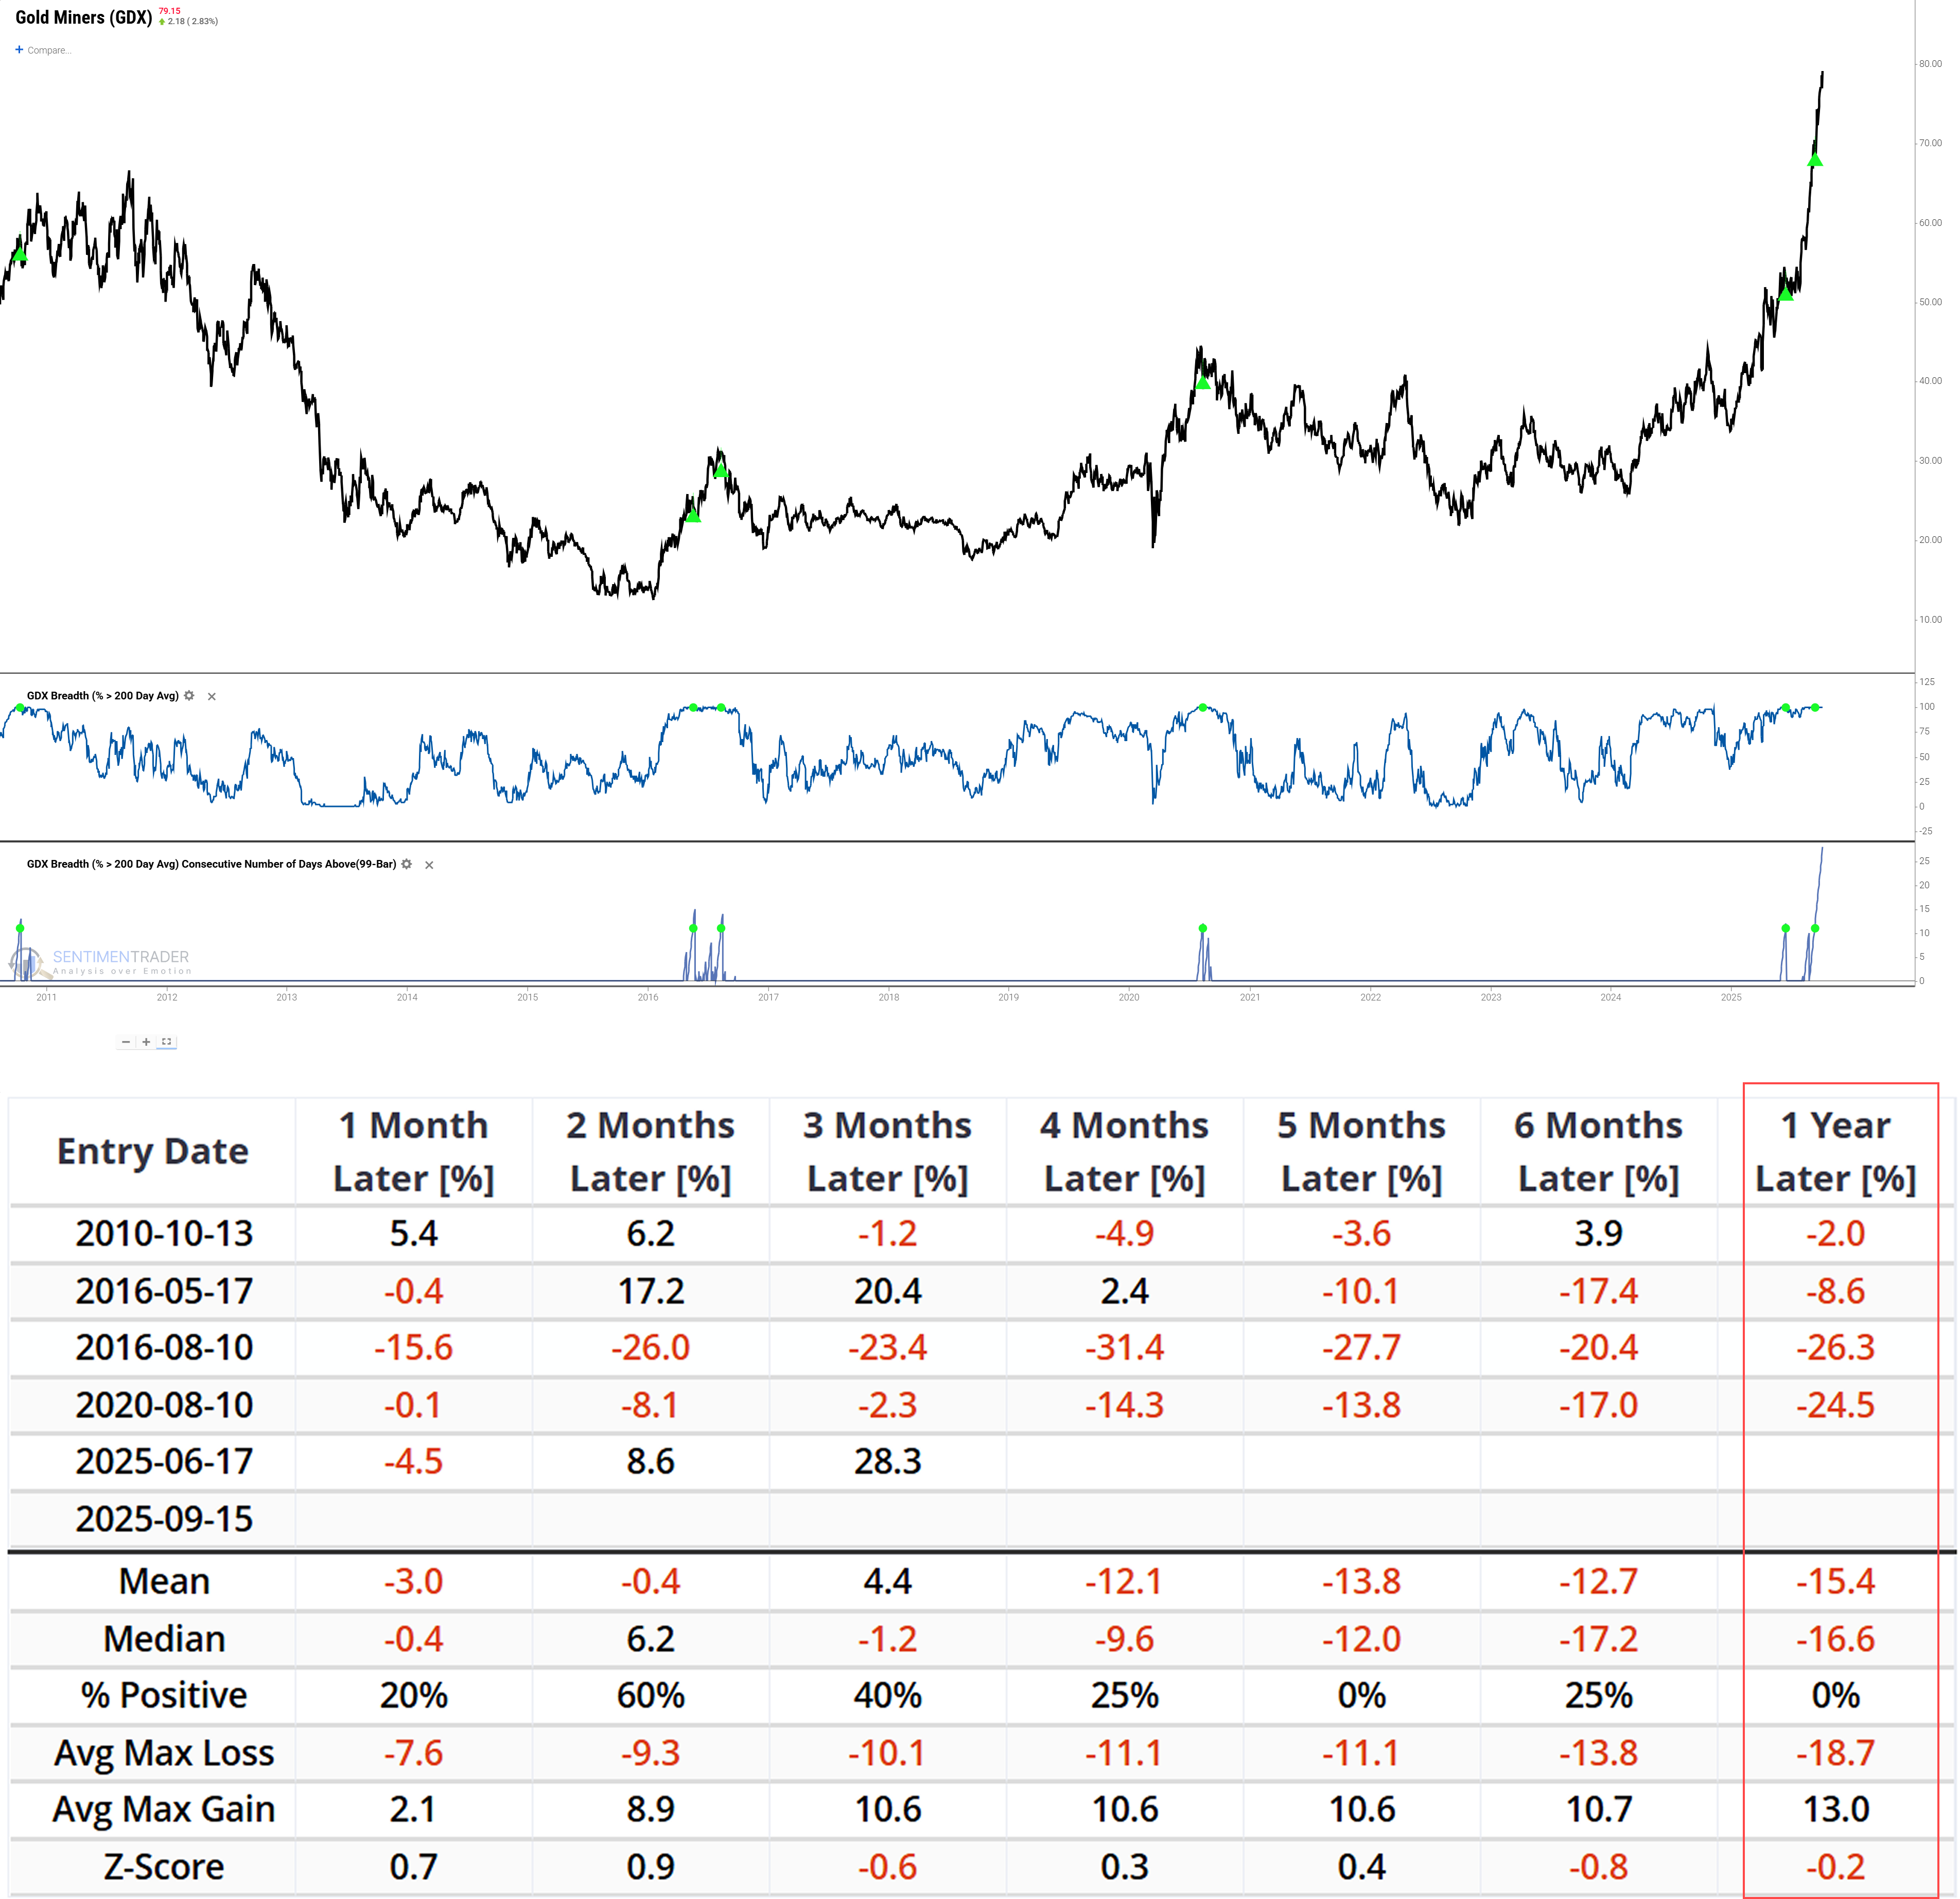
Extending to the long term (200-day MA), GDX's breadth signal is more decisive: days at extreme highs far exceed historical cases, and the few near-similar scenarios reveal the inevitability of long-term pullbacks.
The data's critical insight is "long-term pullback inevitability": 1-year positive returns are 0% (median -16.6%), meaning long-term pullbacks are unavoidable regardless of short-term rallies. The current record extreme breadth duration implies pullback magnitude and length may surpass historical cases-this unprecedented sector uniformity is essentially a signal of full market momentum exhaustion.Related Backtest Click Here.
What the Research Tells Us...
The gold market's core conflict is not whether bullish reasons hold, but whether consensus can overcome rare quantitative signals. Long-term capital demand remains, but gold's new high frequency and miners' breadth exhaustion form a "peak signal cluster"-not noise, but "trend exhaustion."
For investors, the biggest risk is ignoring signal extremeness. Long-term support remains, but short-term pullback risks have risen sharply. Rational moves: stay cautious, control positions, and treat potential pullbacks as long-term opportunities instead of chasing the current rally.