
Gold has entered a seasonally favorable period

Key Points
- There are two periods during the calendar year that tend to favor gold
- One occurs between mid-summer and early fall
- The other happens near year-end into the new year
- The remaining time of year has seen gold register a net loss in value
- Gold recently entered the 2nd favorable seasonal period
Gold Seasonality
The chart below displays the annual seasonal trend for gold futures. The green boxes highlight the seasonally favorable periods, while the red boxes highlight the seasonally unfavorable ones.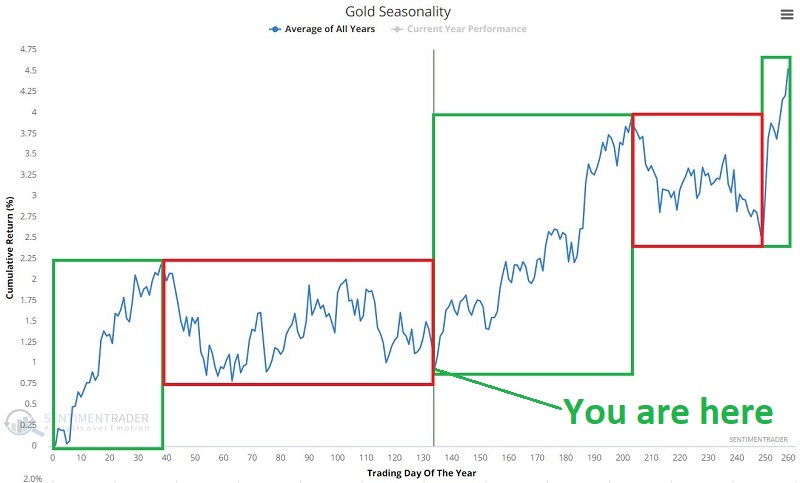
Favorable Period #1: TDY #250 through TDY #38
The first favorable period begins near the end of the year and extends almost two months into the following year. This period extends from the close on Trading Day of the Year (TDY) #249 through TY #38 of the next year.
The chart below displays the cumulative hypothetical gain from holding a long position in gold futures only during this period every year starting 12/31/1974. Through 7/8/2022, the cumulative hypothetical gain was +$139,664.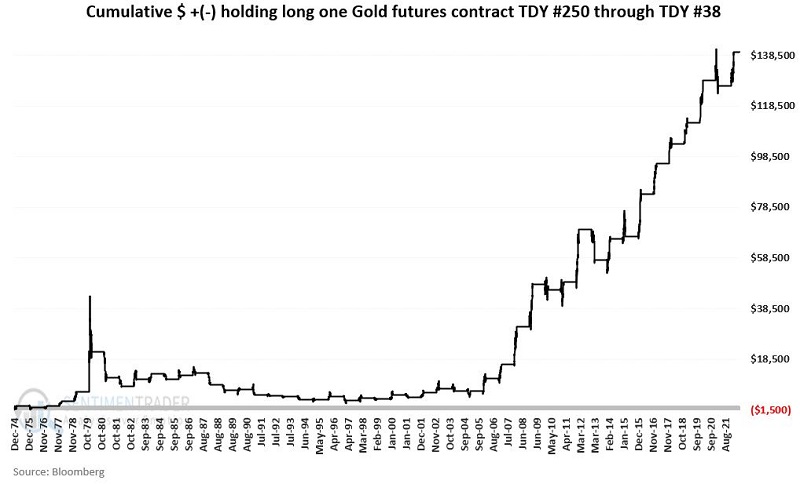
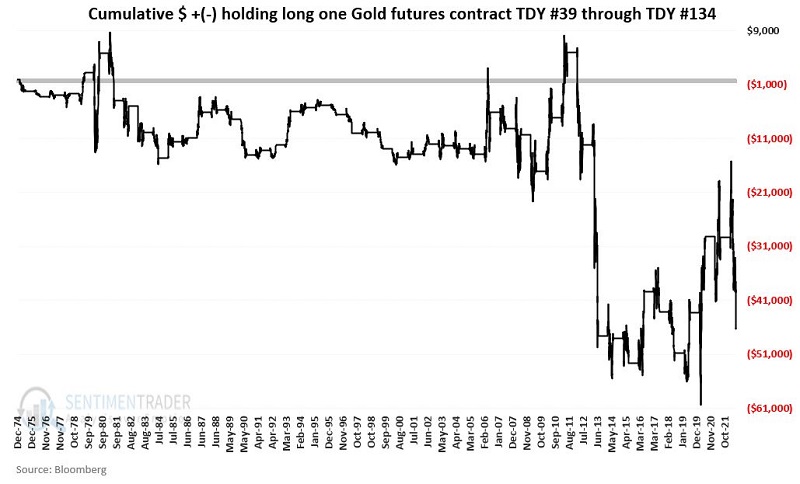
Unfavorable Period #1: TDY #39 through TDY #134
The first unfavorable period begins at the close of TDY #38 and extends through TDY #134. The chart below displays the cumulative hypothetical gain from holding a long position in gold futures only during this period every year starting 12/31/1974. Through 7/8/2022, the hypothetical cumulative loss was -$46,173
Favorable Period #2: TDY #135 through TDY #188
The second favorable period begins at the close of TDY #134 and extends through TDY #188. The chart below displays the cumulative hypothetical gain from holding a long position in gold futures only during this period every year starting 12/31/1974. Through 7/8/2022, the cumulative hypothetical gain was $114,630.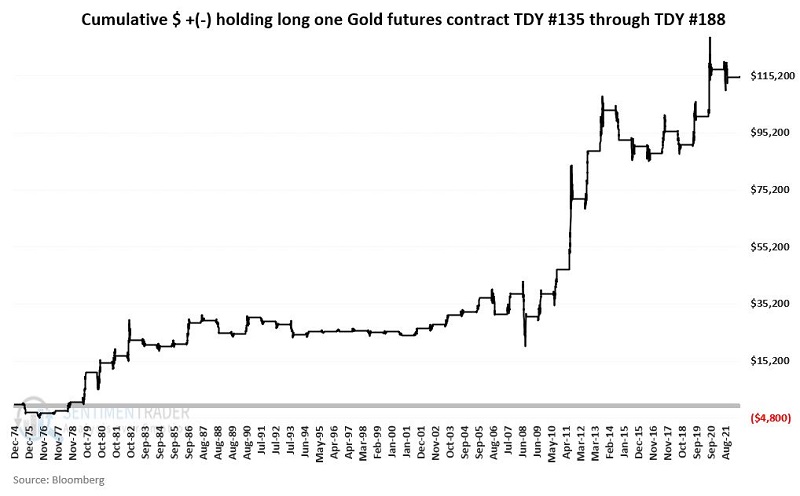
Unfavorable Period #2: TDY #189 through TDY #249
The second unfavorable period begins at the close of TDY #188 and extends through TDY #249. The chart below displays the cumulative hypothetical gain from holding a long position in gold futures only during this period every year starting 12/31/1974. Through 7/8/2022, the hypothetical cumulative loss was -$52,490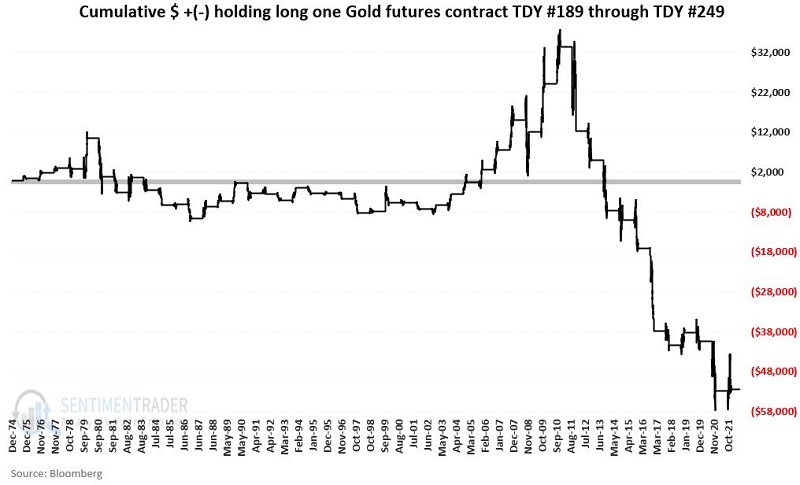
Summary of Favorable and Unfavorable Periods
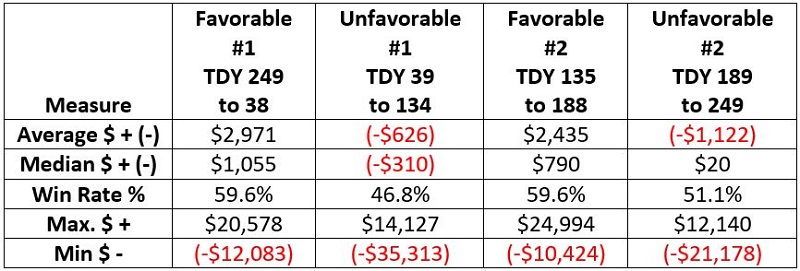
The table below summarizes gold performance during each favorable and unfavorable period.
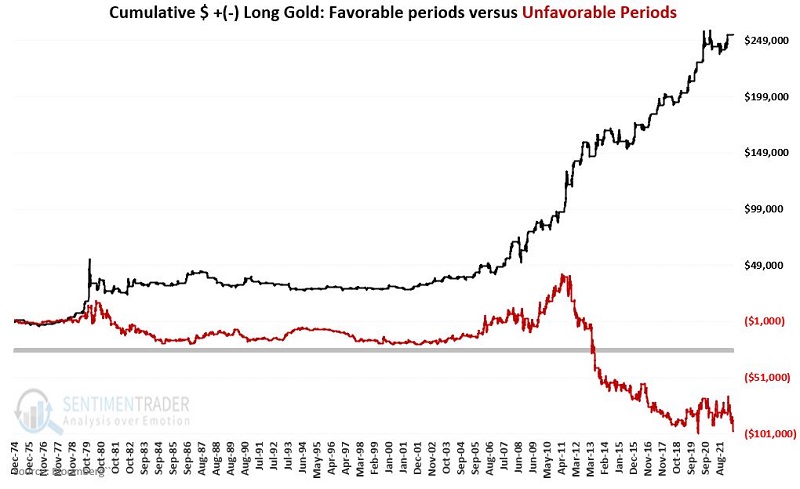
- The black line in the chart below displays the cumulative hypothetical gain from holding gold futures only during the two Favorable seasonal periods each year
- The red line in the chart below shows the hypothetical cumulative loss from holding gold futures only during the two Unfavorable seasonal periods each year
For 2022:
- Favorable Period #2 extends from the close on 7/7/2022 through the close on 9/22/2022
- Unfavorable Period #2 extends from the close on 9/22/2022 through the close on 2/27/2023
What the research tells us…
Gold just entered Favorable Period #2. Does this mean that "Happy Days are here again" and that gold is destined to rally in the months ahead? Not at all. One can make a powerful argument that if 8% inflation isn't enough to get gold to move, a simple turning of the calendar is not likely to have much of an effect. The bad news regarding seasonality is that there is no guarantee that a given seasonal trend will "work this time around." However, another tendency to note is the tendency for seasonality to work well when people least expect it to. If gold will gain some upside momentum in 2022, the period between now and late September is an excellent time to look for such a move.