
Going off the beaten path with German small caps

Key points:
- The German small-cap sector recently poked its head above a crucial moving average
- The start of a favorable seasonal window is fast approaching
- Combining seasonal and price filters can keep investors on the right side of this streaky sector
Start with a simple price trend filter
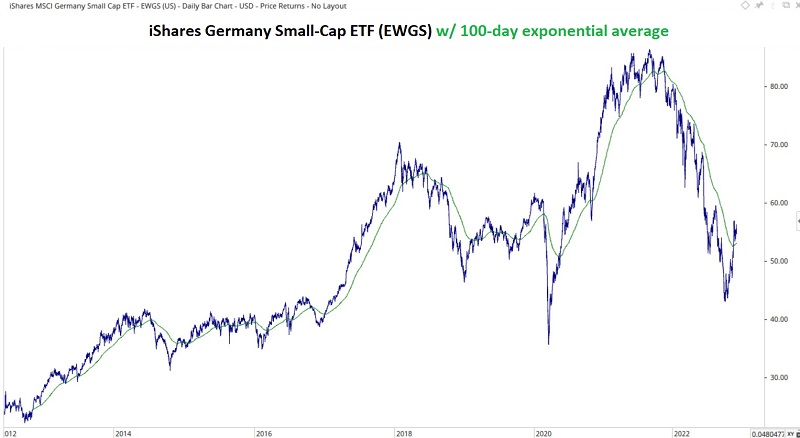
For the first time all year, German small-caps are in a sustained uptrend, defined as trading above their 100-day exponential moving average.
For testing purposes, we will use data for the MSCI Germany Small Cap Index starting in 1995. For trading purposes, a trader can use iShares MSCI Germany Small Cap ETF (EWGS), which tracks the index.
The chart below shows ticker EWGS with a 100-day exponential moving average (green line), which it is currently above.
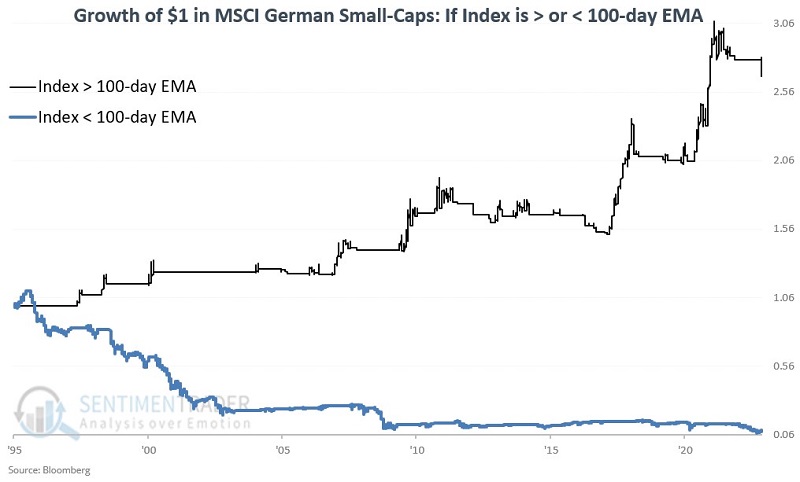
Now let's go back to using the Index to test historical results. The black line in the chart below shows the growth of $1 invested in the Index only when it closed the previous day above its 100-day EMA. The blue line shows the growth of $1 invested in the Index only when it closed the last day below its 100-day EMA.
The cumulative gain when price > 100-day EMA was +167.3%. The cumulative decline when price < 100-day EMA was a fairly stunning -90.7%. Clearly, the trend is your friend in this particular niche sector.
Add in a seasonality filter
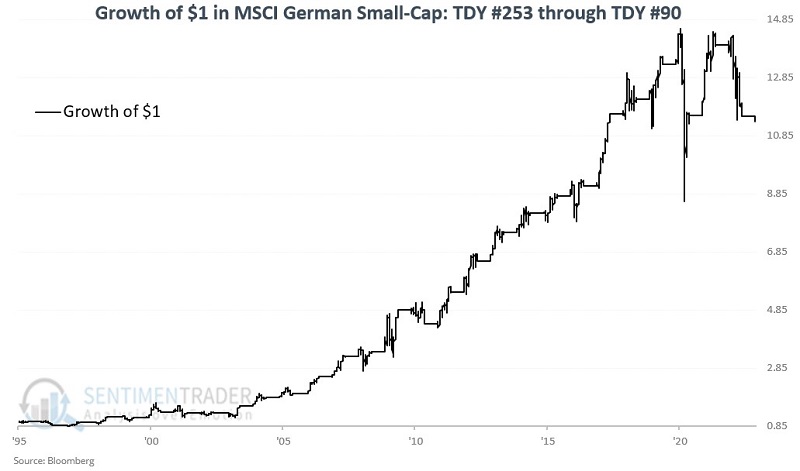
Fortunately, for this Index, we can make it very simple. A favorable seasonal period begins at the close of Trading Day of Year (TDY) #253 and extends through TDY #90 the following year. The rest of the year is considered seasonally unfavorable.
The chart below displays the growth of $1 invested in the Index only during TDY #253 through TDY #90 the following year, since 1994. During this favorable seasonal period, the Index registered a cumulative gain of +1,034%. The next favorable seasonal period will start at the close on December 21.
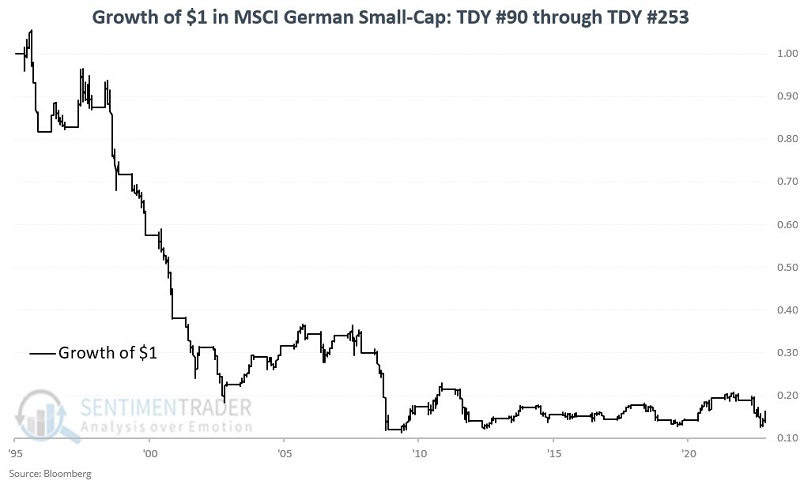
And the chart below displays the growth of $1 invested in the Index only during TDY #90 through TDY #253. During these stretches, the Index registered a cumulative loss of almost -84%.
Combining seasonal and price filters
First, and as a frame of reference, the hypothetical return for the MSCI Germany Small Cap Index since 1995 is +85% on a buy-and-hold basis.
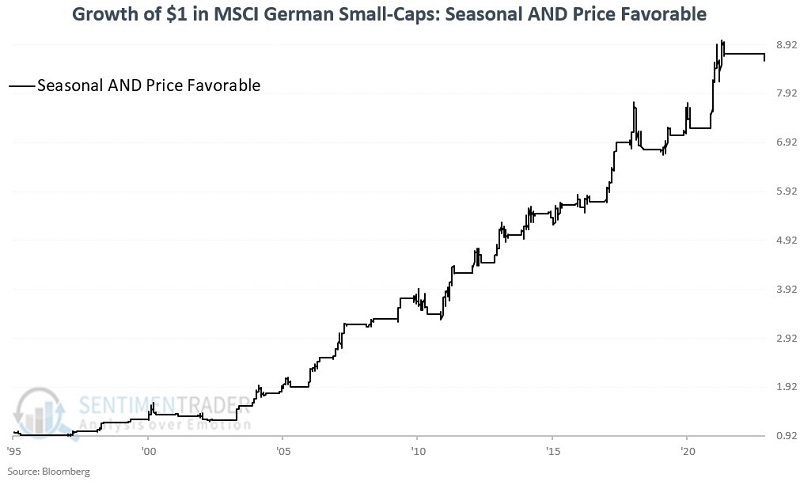
The chart below shows the cumulative growth of $1 invested in the Index only when BOTH price and seasonal filters are favorable. The cumulative % return when both filters are favorable is +758%.
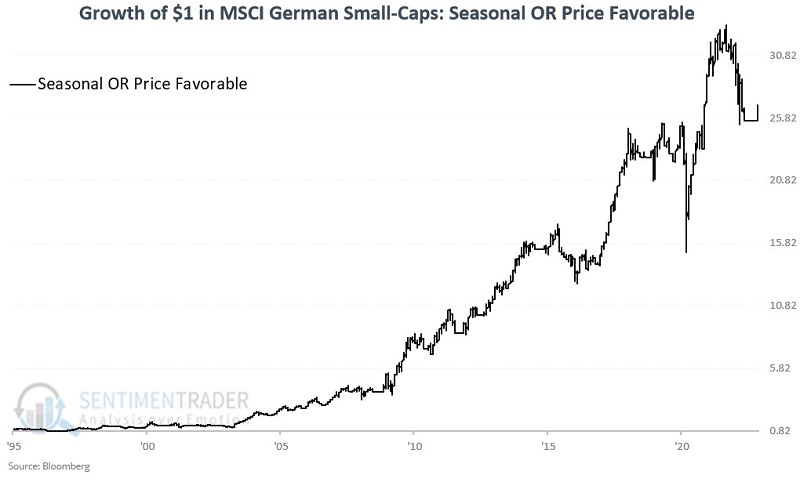
The chart below shows the cumulative growth of $1 invested in the Index only when EITHER price OR seasonal filters are favorable. The cumulative % return when either filter is favorable is +2,539%.
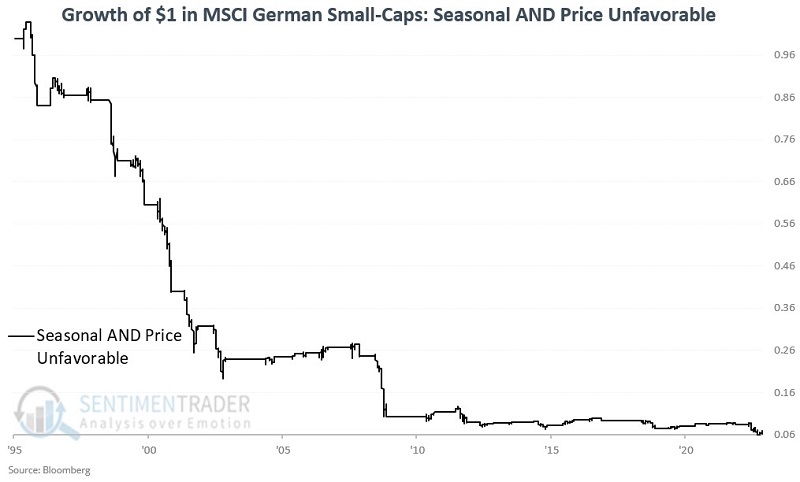
Probably the most telling chart is the one below. It shows the cumulative growth of $1 invested in the Index only when NEITHER price NOR seasonal filters are favorable. The cumulative % return when both filters are unfavorable is a staggering -93%.
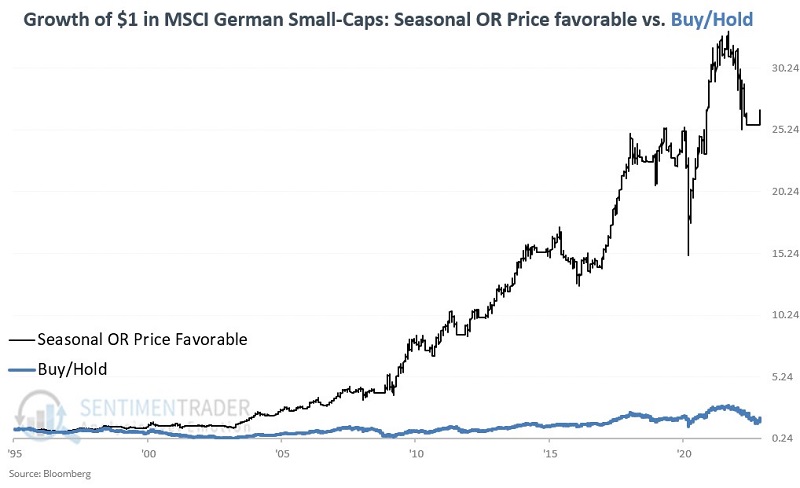
Lastly, the chart below displays the growth of $1 invested in the Index only when either price or seasonal filters are favorable versus buy-and-hold. The filtered approach shows a gain of +2,539% with a maximum drawdown of -40%. It is volatile and not for the faint of heart. Still, it compares pretty favorably to buy-and-hold, which shows a gain of +85% with a maximum drawdown of -78%.
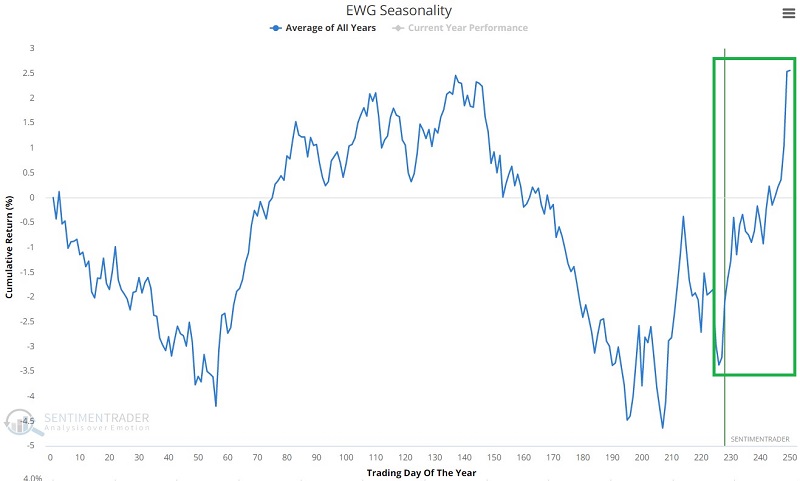
The chart below displays the annual seasonal trend for iShares MSCI Germany ETF (EWG). Note that the German stock market tends to exhibit strength until the end of the year. If that strength unfolds this year, it will likely lift all boats, including small caps.
What the research tells us…
There is no guarantee that German small-cap stocks will rise when either or both of the filters discussed are favorable. The best scenario would be for them to remain above the 100-day exponential moving average after December 21, when the next seasonally favorable period begins. On the flip side, there is not much argument to be made for buying and holding this niche sector over the long term. And there is especially no good reason to hold it when both filters are unfavorable.