Products
SentimenTrader Trading Tools
‍
Backtest Engine
My Trading Toolkit
Correlation Analysis
Seasonality
Market Prediction
Indicators & Data API
‍
Proprietary Indicators & Charts
Market Data API
Strategies & Scanner
‍
50+ Trading Strategies
Smart Stock Scanner
Smart Option Scanner
Research Reports
‍
Research Solutions
Reports Library
Free Resources
Simple Backtest Calculator
Simple Seasonality Calculator
The Kelly Criterion Calculator
Sentiment Geo Map
Public Research Reports
Education
Sentiment Indicators
Technical Indicators
Pricing
Company
About
In the News
Testimonials
Client Success Stories
Contact
Log inLoginSign up
< BACK TO ALL REPORTS

Global indexes join the breakout party

Dean Christians
2024-03-28
The 10-day moving average of global indexes registering a 52-week high cycled from 0% to greater than 25%, triggering a global breadth buy signal. Similar breakout conditions preceded a 92% win rate for a world index over the subsequent three months. A bullish global backdrop provides a favorable tailwind for the S&P 500.

Key points:

  • A composite that measures 52-week highs for global indexes shows an expansion in breakouts
  • Similar participation trends preceded a 92% win rate for a world index over the ensuing three months
  • Broadening global participation provides an additional tailwind for the S&P 500's uptrend

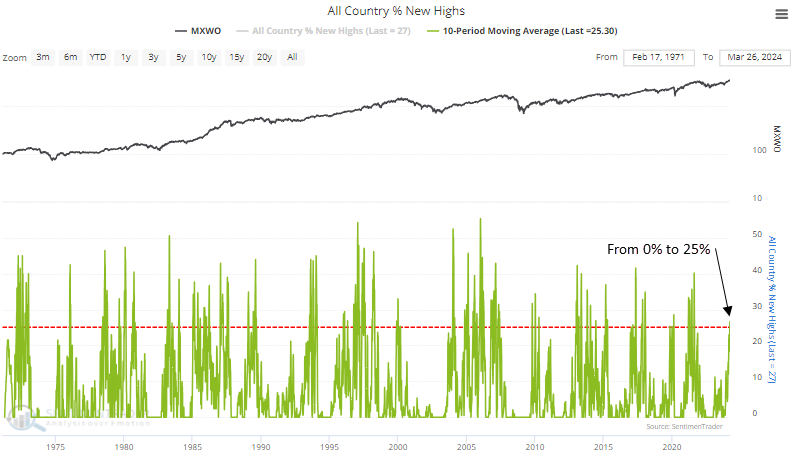
There's a noticeable uptick in the number of global indexes breaking out

Over the last few months, our research efforts have highlighted index breakouts and the proliferation of annual highs for stocks in several sectors. Broadening participation signifies a healthy uptrend likely to endure.

Although global indexes have been trending higher, there has been a noticeable absence in 52-week highs until now.

The 10-day moving average of global indexes closing at a 52-week high cycled from 0% to greater than 25%, indicating that more and more international markets are breaking out.

As Bob Farrell was fond of saying, "Markets are strongest when they are broad and weakest when they narrow to a handful of names."

Similar expansions in 52-week highs for global indexes preceded excellent returns

Whenever the 10-day moving average of global indexes closing at a 52-week high cycled from 0% to greater than 25%, the MSCI World Index exhibited outstanding returns and win rates, with several horizons showing significance relative to any random time.

The three-month horizon was particularly robust, showing a 92% win rate and 21 straight gains between 1980 and 2009. 

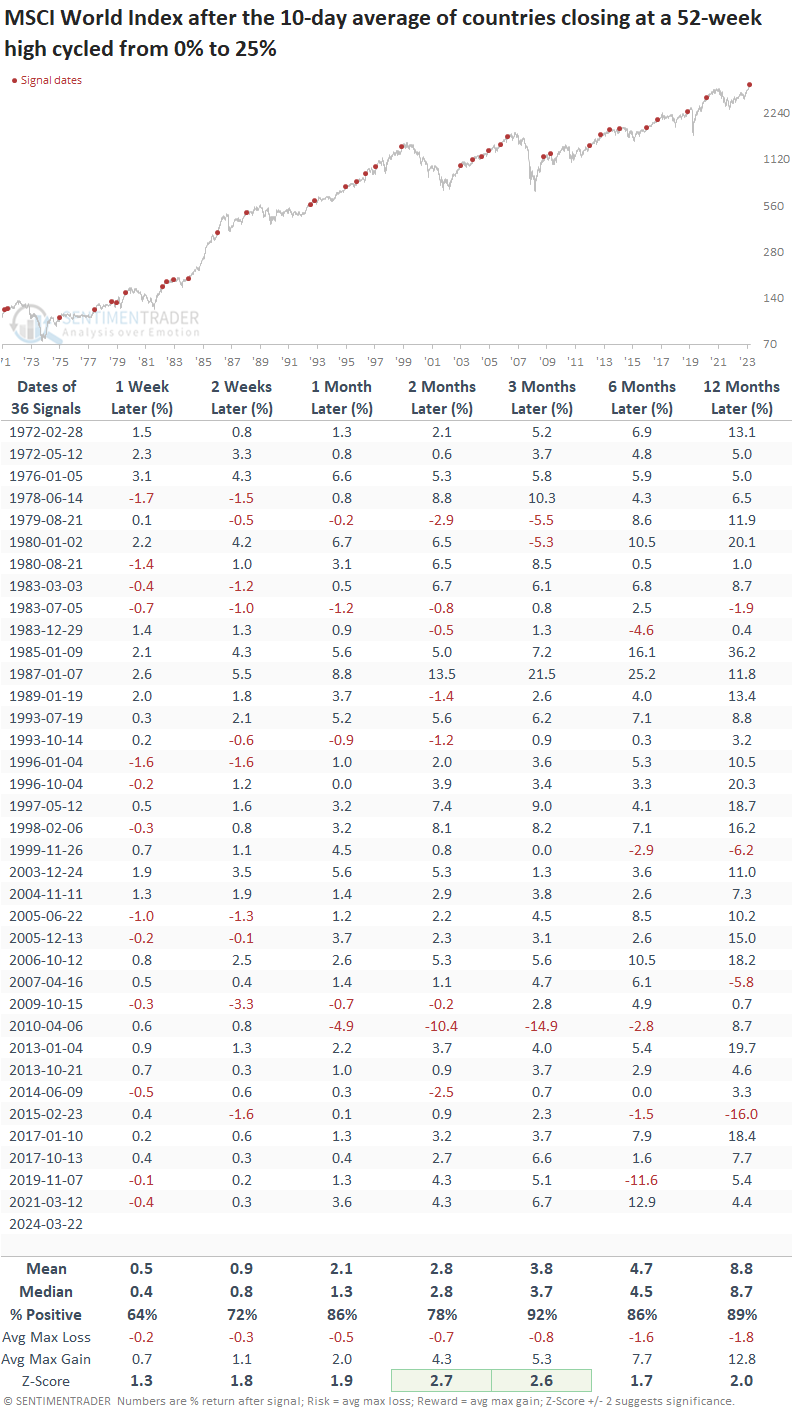
It was exceedingly rare to encounter a maximum loss exceeding -10% in the following three months, with only one instance surpassing this threshold, notably linked to the 2010 Flash Crash. 

The S&P 500 responded exceptionally well to global breakouts, exhibiting outstanding performance and win rates. In 4 out of 7 horizons, returns showed significance relative to any random time.

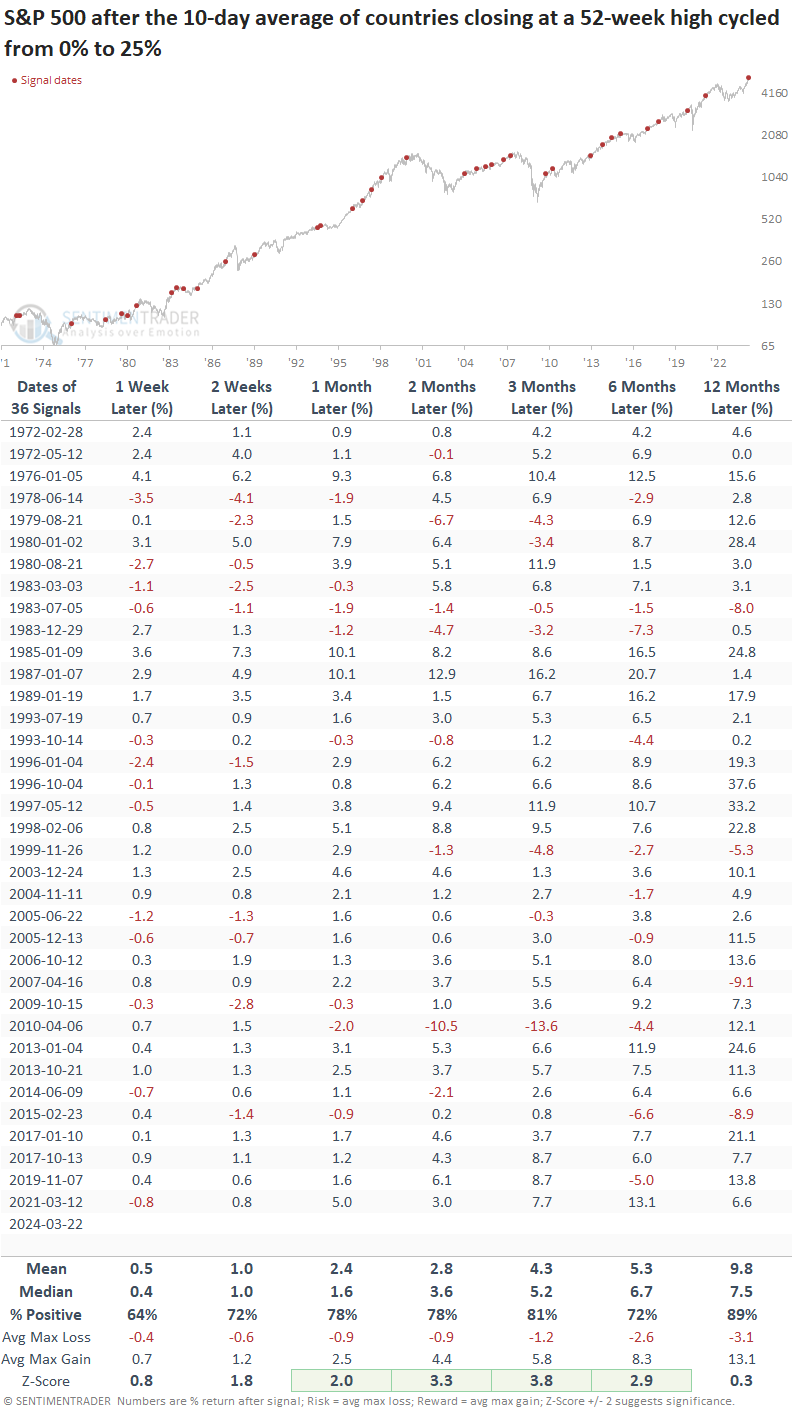
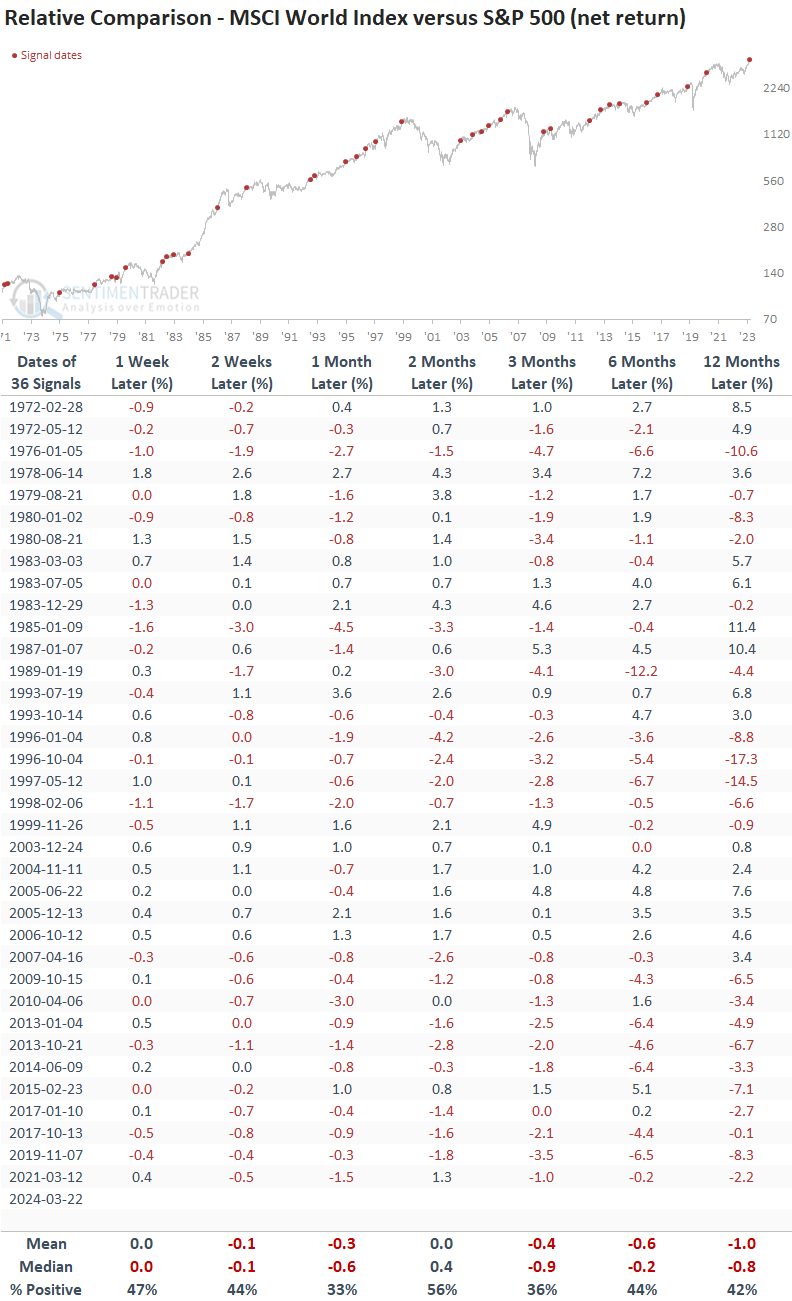
From a relative perspective, the world benchmark consistently underperformed the S&P 500, which is unsurprising given that the world's most benchmarked index has been heavily influenced by growth stocks for most of the last three decades, notwithstanding the 2003-07 value cycle.

Given the underperformance in the world index relative to the S&P 500, I would classify the global index breakout as a confirmation signal rather than a call to action to buy a world index ETF. i.e., add this one to the favorable side of the bullish ledger.

What the research tells us...

The ongoing presence of big-picture indicators confirming the sustainability of the uptrend suggests equity investors should maintain a positive outlook, even amidst customary corrections, which are part and parcel of stock ownership. The latest indicator to paint a favorable picture for stocks, a composite that measures the percentage of 52-week highs for global indexes, triggered a buy signal when its 10-day average cycled from 0% to greater than 25%. After similar alerts, the MSCI World Index and the S&P 500 exhibited excellent returns and win rates.

PRODUCTS
SentimenTrader
Trading Tools
Indicators & Data API
‍
Strategies & Scanner
‍
Research Reports
FREE
RESOUrCES
Simple Backtest
Calculator
Simple Seasonality
Calculator
The Kelly Criterion
Calculator
Sentiment Geo Map
‍
Public Research Reports
‍
Education
Sentiment Indicators
‍
Technical Indicators
‍
Pricing
Bundle pricing
‍
FAQ
‍
Announcements
‍
COMPANY
‍
About
‍
In the News
‍
Testimonials
‍
Client Success Stories
CONTACT
‍
General Inquiries
‍
Media Inquiries
‍
Financial Professionals Inquiries
‍
© 2026 Sundial Capital Research Inc. All rights reserved.
Setsail Marketing
TermsPrivacyAffiliate Program
Risk Disclosure: The information and tools provided are for research and analytical purposes only and are not intended as investment advice. Market analysis involves uncertainty, and outcomes may differ from expectations. Users should conduct their own due diligence and consider their individual circumstances before making any financial decisions. Past performance is not necessarily indicative of future results.

Hypothetical Performance Disclosure: Hypothetical performance results have many inherent limitations, some of which are described below. No representation is being made that any account will or is likely to achieve profits or losses similar to those shown; in fact, there are frequently sharp differences between hypothetical performance results and the actual results subsequently achieved by any particular trading program. One of the limitations of hypothetical performance results is that they are generally prepared with the benefit of hindsight. In addition, hypothetical trading does not involve financial risk, and no hypothetical trading record can completely account for the impact of financial risk of actual trading. for example, the ability to withstand losses or to adhere to a particular trading program in spite of trading losses are material points which can also adversely affect actual trading results. There are numerous other factors related to the markets in general or to the implementation of any specific trading program which cannot be fully accounted for in the preparation of hypothetical performance results and all which can adversely affect trading results.

Testimonial Disclosure: Testimonials appearing on this website may not be representative of other clients or customers and is not a guarantee of future performance or success.