
Getting closer to a thrust, but close doesn't count as much

Key points:
- One of the most-cited and longest-lasting breadth thrust signals hasn't quite qualified as a signal
- While it got oversold enough, buyers haven't followed through enough to meet the upper threshold
- Almost-thrusts were decent enough signs for stocks, especially during uptrends
Buyers haven't boosted stocks enough for a thrust
Almost exactly four years ago, stocks were booming off the pandemic panic low. Even though it was evident that there was overwhelming buying interest, many technicians didn't want to believe it. The biggest stumbling block is that various indicators didn't meet the "official" conditions for a buying thrust.
Regardless, we noted many different types of thrusts at the time, and they all pointed aggressively higher. Granted, I'm picking that period as an example and could point to others where an "unofficial" thrust didn't work out. But over the past 23 years, I've found that the concept matters, not the specific rules.
Even if we relax the rules, the most recent market action has missed the usual definition of a thrust - overwhelming buying interest. The NYSE Zweig Breadth Thrust is a 10-day exponential moving average of the Up Issues Ratio. Within ten sessions, it should cycle from below 40% to above 61.5%.
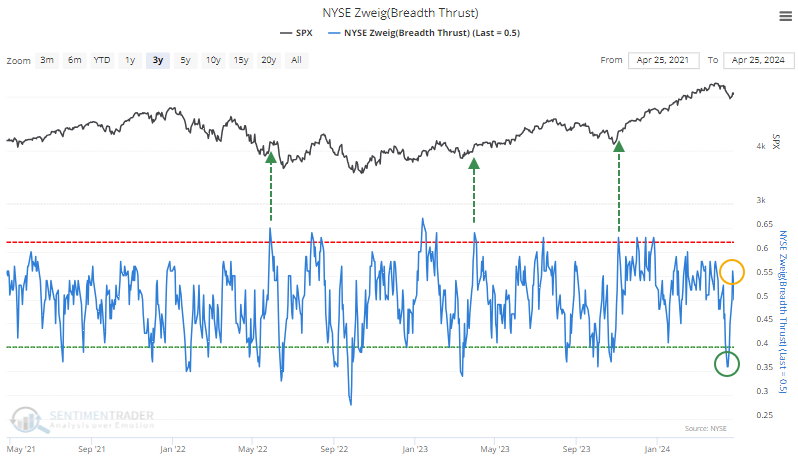
Even though the indicator did drop enough to trigger the first condition, it hasn't rebounded nearly enough to trigger the second. On the other hand, its initial rebound off its low was very fast and very large. The indicator rose by more than 20% within a week.
Almost-thrusts were decent signals
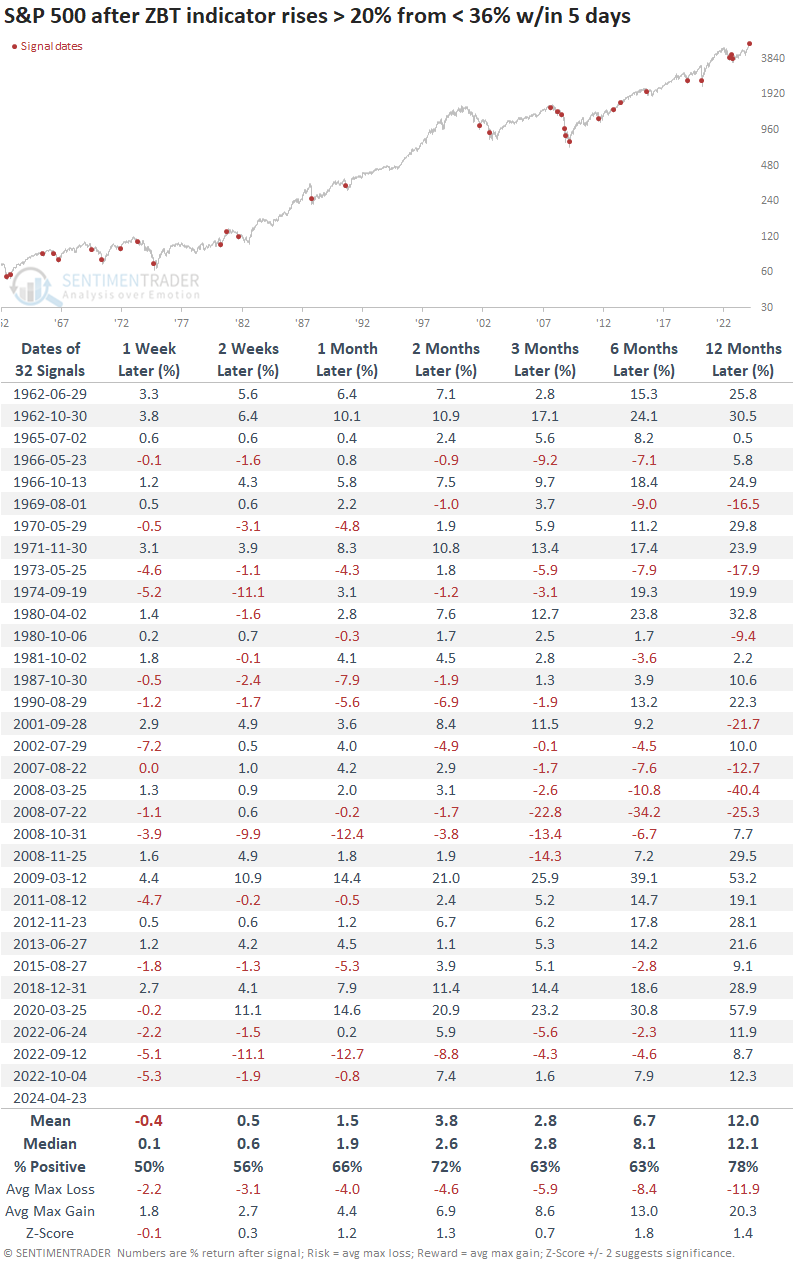
Below, we can see every time in the past 60 years when the indicator rose at least 20% from below 36% within a week. While mid- to long-term returns were well above a random return, there were too many false signals for comfort.
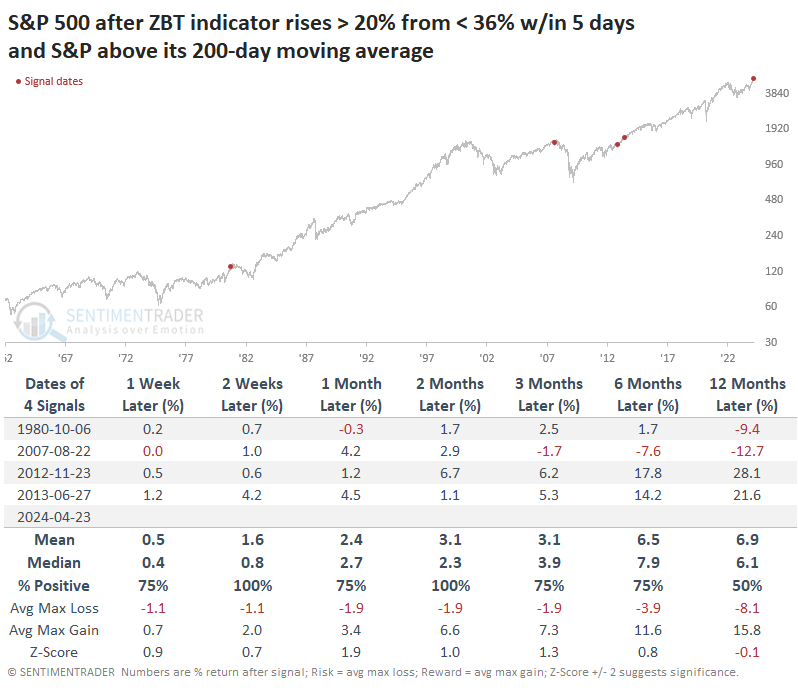
Even in recent years, most thrusts occurred from deeply oversold conditions when stocks are far off their highs and in prolonged downtrends. That is far from the case now. This has been one of the few examples of a mini-thrust when the S&P held above its 200-day moving average.
The few other times this was triggered with the S&P above its average, the index continued higher each time up to two months later. Two of those, however, led to significant peaks and extended drawdowns.
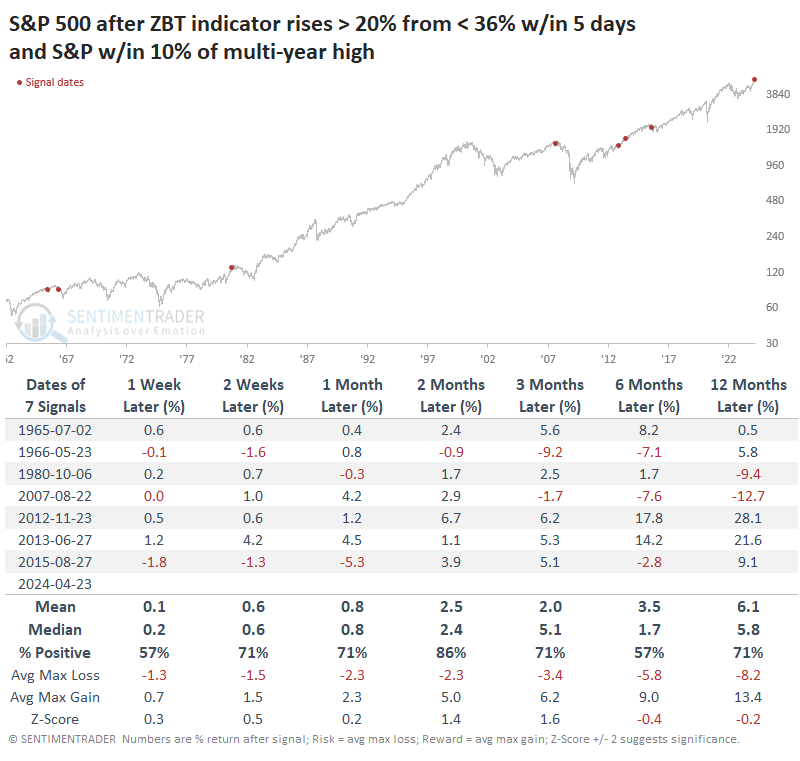
Looking at it another way, there were a few more instances when the S&P 500 was trading within 10% of its high at the time of the signal (even if it was below its 200-day moving average). Again, the next couple of months were almost universally positive, though two (maybe three, depending on your tolerance) failed.
What the research tells us...
Regarding markets, rules are helpful guidelines but should not be considered gospel. If the parameters change a little, but the results change a lot, then the rule isn't robust and should be considered suspect. Breadth thrusts are one of the rules that tend to withstand slight modification of the rules and yet still hold up.
When it comes to the latest attempt at a Zweig Breadth Thrust, buyers have come up short, and unless we see a significant surge in the next couple of sessions, it probably won't "officially" trigger. That doesn't mean buyers have failed, and we're doomed to return to the lows. If anything, what has happened already is positive enough. It would be easier, however, to have more confidence in the lasting power of the signal if we get enough of a boost to push the indicator above its upper threshold or at least much closer to it.