
Gas Markets on Thin Ice

Key points
- Natural gas prices surged nearly 70% in a single week due to extreme arctic weather, but sentiment has reached extreme optimism.
- The Optix sentiment indicator for the United States Natural Gas Fund (UNG) triggered a reversal signal after spiking above 95%.
- Historically, such extreme optimism in UNG has been a consistent sell signal, leading to negative returns across almost all timeframes over the subsequent year.
- Inverse ETFs like KOLD offer potential for significant gains if gas prices retreat, but they come with extreme volatility and drawdown risk.
A sudden freeze, a sudden spike
Natural gas trading is often not for the faint-hearted. Although absolute U.S. natural gas production remains high, producers have maintained caution following a prolonged period of depressed prices. This caution is now manifesting as price sensitivity. Even minor shifts in demand expectations can trigger violent price swings. As an arctic blast swept across the Eastern U.S., causing temperatures to plummet and bringing life-threatening wind chill warnings, U.S. natural gas futures skyrocketed nearly 70% in just one week.
The United States Natural Gas Fund (UNG), designed to track natural gas futures prices, saw its Optix exceed 95% alongside the surge in gas prices, triggering our Optix Reversal Model.
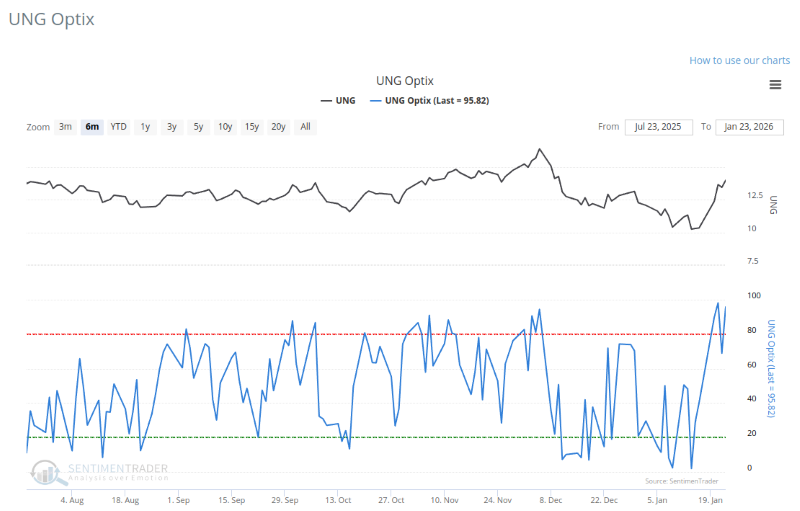
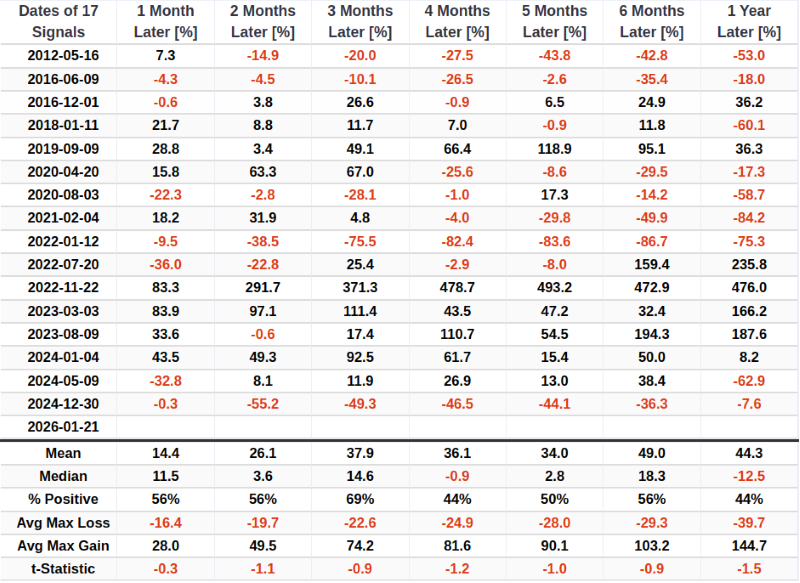
Natural Gas ETF Overview
The chart below displays the signal dates when the Optix for the Natural Gas ETF (UNG) completed a reversal by exceeding 95% after previously hitting a low (below 10%). For related backtest, click here.
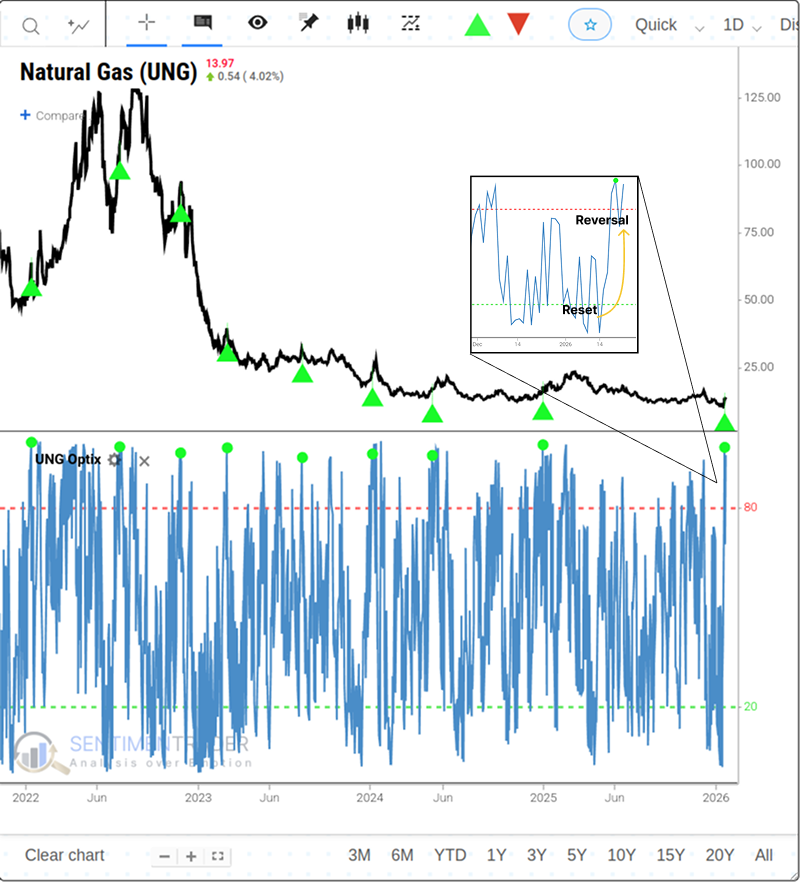
As illustrated, UNG's performance has been poor following these signals. Across all time windows from 1 month to 1 year, the ETF has shown a significant and persistent downward trend, with average returns consistently negative and a very low probability of gains.
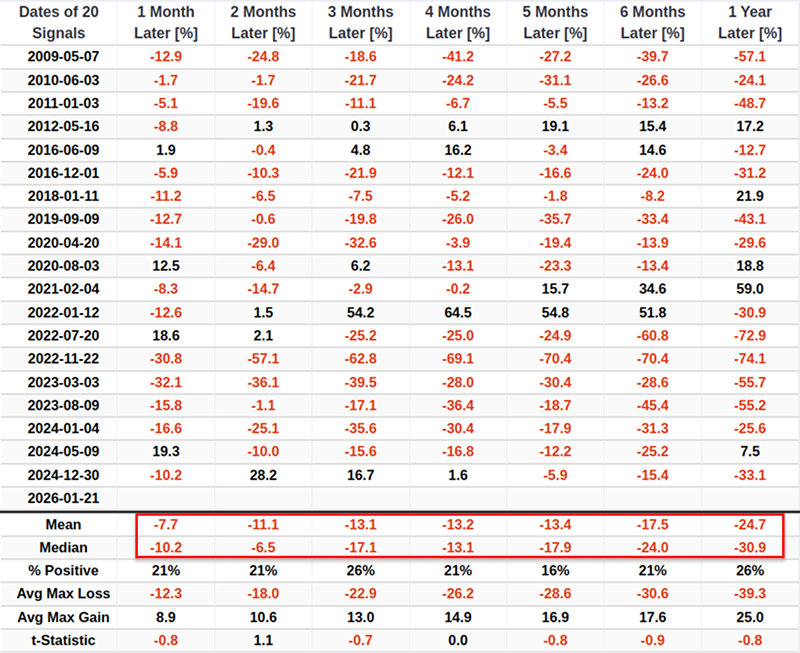
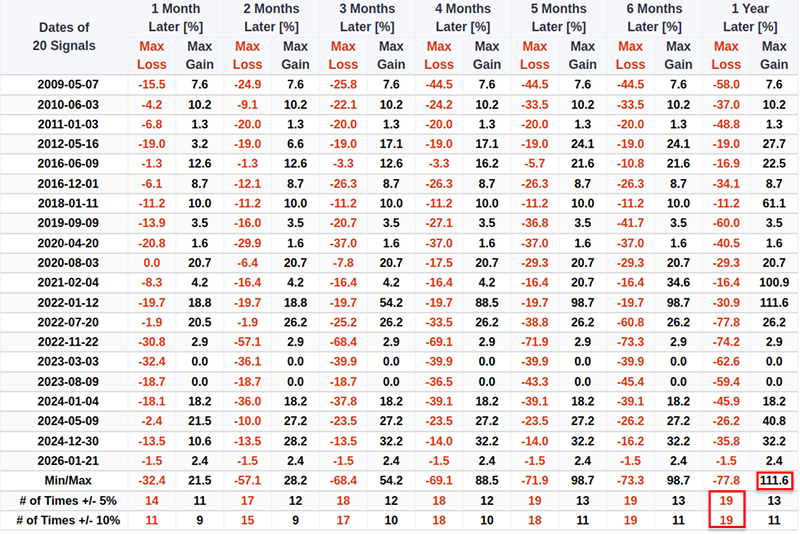
In UNG's 18-year history, despite the potential for significant rallies during the holding period (with a maximum gain reaching 111%), this signal is accompanied by extremely asymmetric downside risk. In the subsequent year, investors faced a deep drawdown exceeding 10% in 95% of cases (19 out of 20 instances).
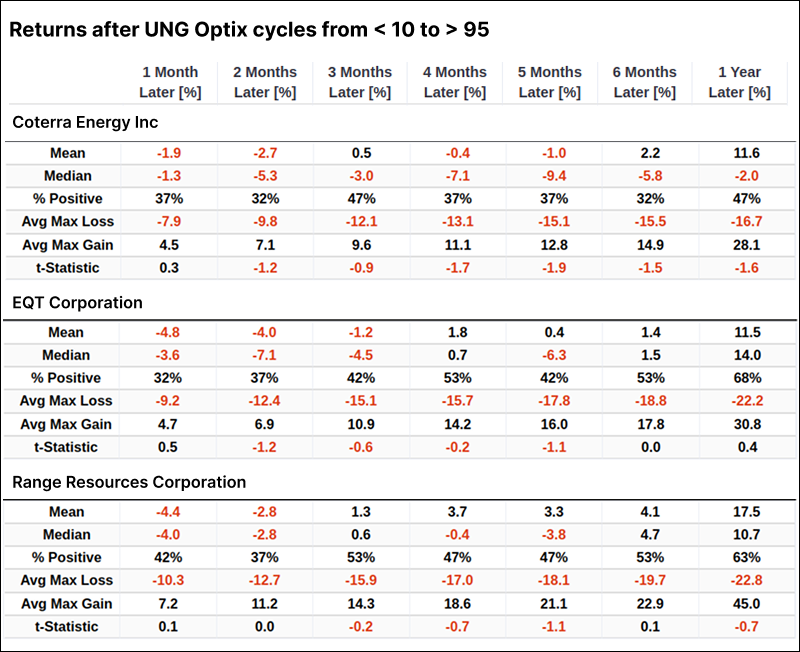
Natural Gas Stocks
The returns and win rates for various natural gas stocks have been mediocre to underwhelming following these sentiment extremes. However, even when gas prices collapse, high-quality stocks (particularly EQT and RRC) have historically far outperformed a direct holding in the commodity itself, thanks to their production capabilities and operational efficiency.
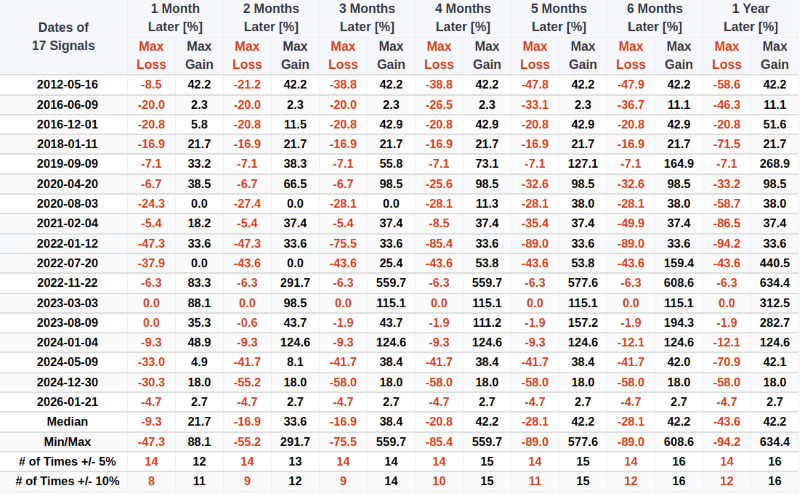
Aggressive traders willing to tolerate extreme risk and volatility to short the commodity might consider KOLD. The ProShares UltraShort Bloomberg Natural Gas ETF (KOLD) seeks to track twice the inverse daily performance of natural gas futures. However, it is crucial to note that investing in this ETF involves extreme volatility and risk.
The chart below displays the return statistics for KOLD across holding periods ranging from 1 month to 1 year, following 17 historical signal triggers.
The volatility is evidently extreme. While the Mean return is skewed higher by a few spectacular gains (such as in late 2022), the Median return and Win Rate (% Positive) reveal massive risks for long-term holding, with frequent large drawdowns.
Although its potential for explosive gains is staggering (with a maximum 1-year potential gain reaching 634%), investors must almost certainly endure severe floating losses during the holding period.
What the research tells us...
The recent spike in natural gas prices, driven by severe winter weather, has pushed sentiment to unsustainable levels of optimism. The UNG Optix indicator hitting 95% has historically been a reliable precursor to significant price declines, as the "fear premium" embedded in the price tends to evaporate quickly once the immediate weather threat passes. While natural gas producers offer a relatively safer way to navigate this volatility compared to the commodity itself, the data suggests the path of least resistance for natural gas prices is lower. For those with a high risk tolerance, inverse ETFs like KOLD present a high-reward, high-risk opportunity to capitalize on a potential mean reversion.
It's still important to note that KOLD is currently priced very cheaply with an extremely high risk-reward ratio, but it may be a case of "catching a falling knife." Be sure to keep a close eye on the weather forecast-it's KOLD's lifeline.